
Five Concrete Reasons Your Students Should Be Learning to Analyze Data in the Reproducible Paradigm
 The next time you’re leafing (or more likely clicking) through a scientific journal, pick a paper and focus on the description of the data analysis. As statisticians, it’s the analysis that naturally draws our attention, but pay attention to whether the authors provided you with sufficient information to recreate their data analysis starting with the raw data set and continuing through to the last p-value. Surprisingly, and somewhat dismayingly, the answer to that question will likely be “no.”
An analysis that can be passed from one person to another and, using the same data, generate the same results in an unambiguous manner is reproducible. Despite evidence of the persistence of irreproducible data analysis in the sciences, these same journal authors would likely agree that reproducible analysis constitutes an integral part of the scientific process. So why the disconnect? There are many reasons, but we will focus on one: Once upon a time, these scientists were bright-eyed students sitting in their first data analysis course and that course likely did not teach reproducible methods.
A typical workflow in data analysis has at least two major components: a statistical software package for performing the data analysis and a layout package for presenting the results. Traditionally, the analyst’s work begins in their statistical package of choice (e.g., R, SAS, Minitab, Excel), where they perform the data analysis. Then, results are summarized and presented using a word processor (e.g., Microsoft Word, Google Docs, LaTeX). This workflow is ubiquitous and student homework assignments are produced in this manner in most undergraduate courses where students are expected to compute with data. Most often, tables, output, and plots are simply copied and pasted from the statistical package to Word. This copy-and-paste paradigm has many undesirable aspects: It is prone to errors, the presented results are not readily reproducible, the separation of computation from analysis makes it difficult—especially for a beginner in data analysis—to present their findings in a logical order, and it leaves room for selective presentation of results.
While the ultimate goal of teaching in a reproducible paradigm is to prepare students to be responsible scientists in the future, you don’t have to wait until your students go off on scientific careers to see the fruits of your labor. The advantages of teaching data analysis in a reproducible framework become apparent from day one. Here, we outline five concrete reasons why your students should be learning to analyze data in the reproducible paradigm, using R Markdown to illustrate them.
R Markdown, based on the free and open source statistical programming language R, enables students to develop the basic capacity to undertake modern data analysis and communicate their results while avoiding the shortcomings of the copy-and-paste paradigm. This approach, in a nutshell, allows for transparent, reproducible, data analysis tightly integrated with written interpretation. At a high level, it renders a well-annotated R script into a self-contained HTML, PDF, or Microsoft Word file, replete with graphics, commands, and stylized text. Note that there are other reproducible analysis tools available (e.g., Sweave and IPython notebook), but none as well suited to the introductory statistics student.
Figure 1 displays snippets from the input (right) and output (left) of a data analysis report produced using R Markdown. R commands are typed directly into the Markdown file, set off in chunks. The rendering engine then parses this file, first executing each of the R commands in the chunks and then processing the output from those commands. Additional content such as text for interpretations and lists, headers, tables, external images, and web links, etc. surround the R chunks in a standard way.

Figure 1. On the right, R Markdown file input. On the left, output with code, graphics, and text.
(1) Analyze Iteratively
This workflow establishes the norm that data analysis and science in general should be an iterative process. Just as our colleagues in English departments stress the importance of multiple drafts and multiple revisions, we are able to do the same within this paradigm, encouraging data analysis that is more thorough and more thoughtful.
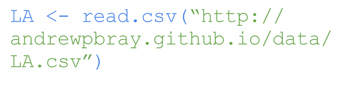
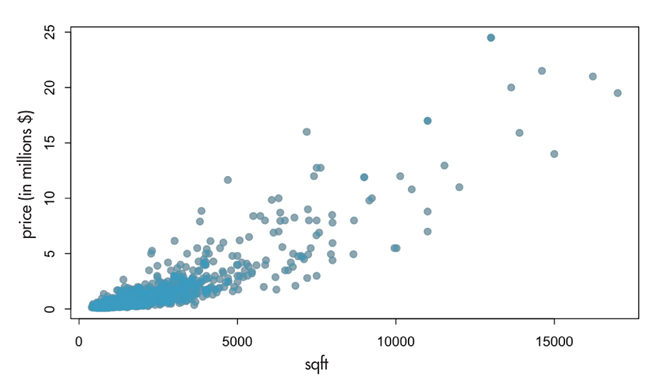
Consider the following situation: You have students who have been working with housing data and wish to describe the relationship between the square footage and sale price of homes in Los Angeles. They probably started by constructing a scatterplot of these two variables:

They would probably be able to identify the positive association between the two variables and possibly jump right into fitting a linear model. Only once they’ve started writing up their interpretation will they realize their residual plots look a bit troubling, most notably the dramatic outliers. If they were working in a nonreproducible workflow, this would require the data set to be modified, perhaps in Excel. The plots would need to be remade, the model rerun, and everything recopied into their write-up. Using R Markdown, they need only add two lines to restrict their analysis to those home with square footage less than 20,000.
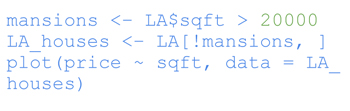
When the students recompile their markdown file, they will exclude the mansions and execute all their downstream analysis in one click.
The ease of this revision brings data analysis much closer to a workflow that students will recognize from a writing course, where multiple drafts pave the way to a final draft. It allows us to demonstrate that an analysis is an iterative process involving critical feedback and revision.
(2) Report Transparently
Often, there are many data cleaning steps between the raw data set and the data set on which the final analysis is done. These steps are rarely outlined sufficiently in published work, hence it can be difficult or impossible to replicate published results, even with access to the data set.
When analysis is done and presented using markdown transparency, all steps of the analysis, including data cleaning, become an inherent part of the final outcome. While this level of detail may not always be appropriate for published work in a scientific journal, it is definitely desired for a data analysis report as part of coursework, especially in a course in which students are just learning to use these data analysis and computational tools.
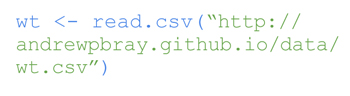
Consider this example: We asked students in an introductory statistics course on an anonymous survey to report their weights, in ounces. We then distributed these data back to the students and asked them to analyze it.
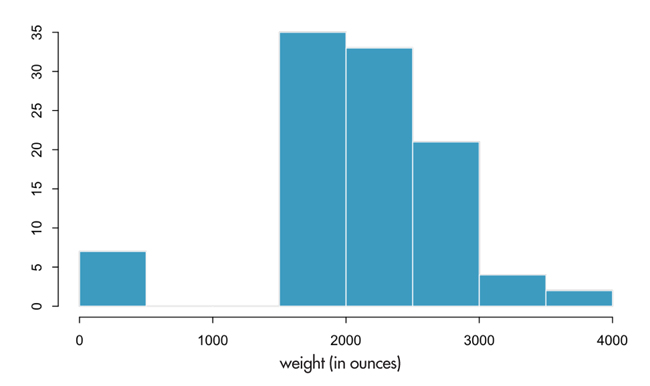
The first visualization of the data reveals a curious feature. A few students reported weighing less than 500 ounces (less than 31.25 lbs).
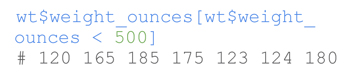
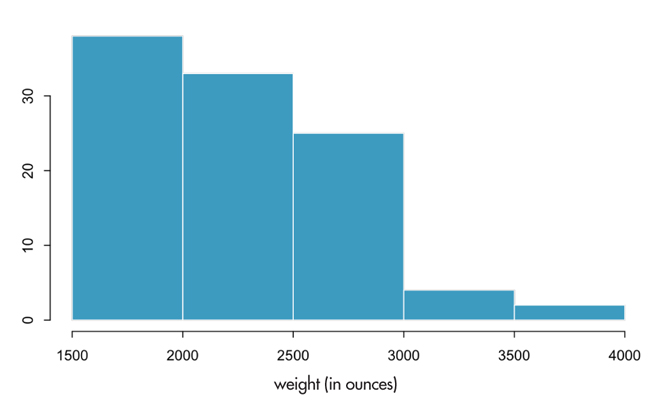
These appear to be students who reported their weight in pounds instead of ounces. Before proceeding with the analysis, we instruct the students to correct this. However, such a correction should be well documented and transparently presented so others replicating the analysis starting with the same data set can achieve the same results. So we create a new variable that converts the pounds to ounces for these observations.

(3) Collaborate Seamlessly
Given that collaboration among researchers is now the norm, providing students with opportunities to work collaboratively on projects, even at the introductory level, has been gaining popularity. While this is an invaluable experience for students, it also can be a source of frustration, hence streamlining a collaborative workflow is worthwhile. R Markdown provides such a mechanism in part due to its inherent emphasis on reproducibility. Students working together are able to follow, and even extend, each other’s work with minimal effort. The addition of an RStudio server or third-party file synchronization solution (e.g., Dropbox) can provide a functional workaround for having multiple students edit the same R Markdown file.
(4) Compute with Clarity
When students get their first chance to run freely in a programming environment such as R, the result is often a jumble of false starts, dead ends, and doubling back. The freedom of this sandbox environment can lead to confusion and frustration. A markdown document provides a structure that allows students to organize their thoughts and integrate their code with written interpretation. While an analysis contained in a single script looks impenetrable to a new programmer, a markdown document bridges the computing language and the natural language and reads like a well-organized story.
(5) Assess the Reasoning, Not Just the Final Outcome
If your students are getting their hands dirty in real data analysis, then you’ve opened yourself up to a grading challenge: How can you assess the quality of their analysis when all that is turned in is the final product of a long string of decisions? In fact, in the irreproducible paradigm, the final report has little information you can use to assess how students reasoned through each step in the analysis process. A markdown document, by contrast, makes clear every choice they made from the first moment they loaded in the raw data set.
Reading a good final report produced in the traditional way, including only the narrative and selective output, can be like getting a postcard from your student at the summit of a mountain. It tells you they have reached their final destination, but nothing about how they got there. Did they navigate the maps well and hike up on their own? Did they charter a helicopter to the top? Did they Photoshop themselves into the picture? On the other hand, reading a good final report produced using markdown is like reading their detailed travel blog. It presents evidence of not only them making it to the top of the mountain, but also the skills to navigate through their next adventure.
Teaching data analysis in the reproducible paradigm means being able to provide valuable and targeted feedback, but there is a more pragmatic element at play here, too: Grading a markdown document is easier than grading an irreproducible document. With the entire analysis contained in a single file, you don’t need to shuffle through a jumble of plots and scripts. It also removes the guesswork involved in inferring how the students reached their conclusions.
In 2013, the journal Nature published an editorial urging researchers to do whatever they can to improve research reproducibility. As statistics educators, we are the members of the scientific community that are most well suited to, and responsible for, addressing this challenge. The introductory statistics course is a perfect candidate for when we should be instilling best practices in scientists in training, as they are first introduced to data analysis tools in this course. Providing the students with the tools to do and present reproducible data analysis before teaching them rigorous methods highlights the importance of this issue, and with appropriate support mechanisms, introductory statistics students are receptive to its adoption.
Editor’s Note: You can access a version of this article produced in R Markdown, as well as the source files.
Further Reading
Allaire, J. J., Jeffrey Horner, Vicent Marti, and Natacha Porte. 2014. Markdown: Markdown rendering for R. R package version 0.7.
Baumer, Ben, Mine Çetinkaya-Rundel, Andrew Bray, Linda Loi, and Nicholas J. Horton. 2014. R Markdown: Integrating a reproducible analysis tool into introductory statistics. Technology Innovations in Statistics Education 8(1).
Stodden, V., F. Leisch, and R. D. Peng (Eds.). 2014. Implementing reproducible research. CRC Press.
Xie, Y. 2013. Dynamic documents with R and knitr. CRC Press.
2013. Announcement: Reducing our irreproducibility. Nature 496.
About the Authors
Mine Çetinkaya-Rundel is an assistant professor of the practice at Duke University. Her research interests include statistics pedagogy, spatial statistics, small-area estimation, and survey and public health data. She is a co-author of OpenIntro Statistics and a contributing member of the OpenIntro project, whose mission is to make educational products that are open-licensed, transparent, and help lower barriers to education.
Andrew Bray is Five College Postdoctoral Fellow in Statistics and is teaching in the fall at Mt. Holyoke College. He is also a contributor to the OpenIntro project.
Dalene Stangl is professor of the practice of statistical science and public policy and associate chair of the department of statistical science at Duke University in North Carolina. She has served in editorial positions for the Journal of the American Statistical Association, The American Statistician, and Bayesian Analysis and has co-edited two books with Donald Berry, Bayesian Biostatistics and Meta-Analysis in Medicine and Health Policy. Her primary interest is promoting Bayesian ideas in the reform of statistics education and statistical practice..

In Taking a Chance in the Classroom, column editors Dalene Stangl, Mine Çetinkaya-Rundel, and Kari Lock Morgan focus on pedagogical approaches to communicating the fundamental ideas of statistical thinking in a classroom using data sets from CHANCE and elsewhere.


