
A Look into the AP Statistics Classroom: Who Teaches It and What Aspects of Statistics Do They Emphasize?

With Advanced Placement (AP) Statistics continuing to grow in enrollment and its importance as an optional course in high school, we aimed to understand more about the practices in this course. A survey of 445 AP Statistics teachers and interviews with 18 volunteers provides insight into the teachers of this course, what their classrooms look like, and the aspects of statistics that are emphasized in their curricula and instruction. Results can assist those in the statistics education community who work with AP Statistics teachers on a local, regional, or national level.
Many in the American Statistical Association (ASA) community are highly involved in efforts to assist in developing instructional materials, professional development, and scoring of Advanced Placement (AP) Statistics exams each summer. While members of the ASA may know active AP Statistics teachers and have a strong sense of their teaching practices, we sought to survey a broad base of teachers of AP Statistics to get a glimpse into who is teaching this course, what their classes may look like, and the aspects of statistics they emphasize so readers of CHANCE can get to know trends that may help inspire ways to support the AP Statistics teacher community in the future.
We surveyed a national sample of AP Statistics teachers in November and December 2018 (approved by North Carolina State University Institutional Review Board, protocol #14355). To be eligible to complete the survey, a teacher had to either be teaching AP Statistics in the 2018–2019 school year or have taught it during 2017–2018.
The convenient and volunteer sample of respondents were from 47 states. Most survey respondents taught in public schools (83%), with 13% teaching in private and 3% in charter schools. Responses on survey items ranged from n = 445 to n = 371, due to skipping items and survey attrition. Details of the survey design, recruitment, and more complete results are in a 2021 article by Hollylynne Lee and Taylor Harrison in the Journal of Statistics and Data Science Education (JSDSE). Surveyed teachers volunteered for, and 18 participated in, follow-up interviews in May–June 2019 to further explore their practices and beliefs about teaching statistics.
AP Statistics Teacher Characteristics
Teaching experience
The sample was generally highly experienced high school mathematics teachers (mean = 16.25, median = 15), with most (80%) having more than 10 years’ teaching experience. The sample had a wide range of experience in teaching AP Statistics, with a mean of 12.2 sections of the course taught and a median of nine sections (e.g., a teacher may teach more than one section in a school year).
Figure 1 includes measures for teachers who indicated teaching high school mathematics or statistics for at least one year and fewer than 50 years. A few extreme measures, such as teachers who indicated teaching more than 45 sections of AP Statistics in fewer than six years of high school teaching, were removed and are not indicated in the frequencies and percentages. Measures falling on the median lines were included in frequencies and percentages (purple values in Figure 1) less than the respective medians. The majority of teachers with 15 or fewer years of high school math teaching had taught nine or fewer AP Statistics courses. The majority of teachers with more than 15 years of high school math teaching experience had taught more than nine AP statistics courses.
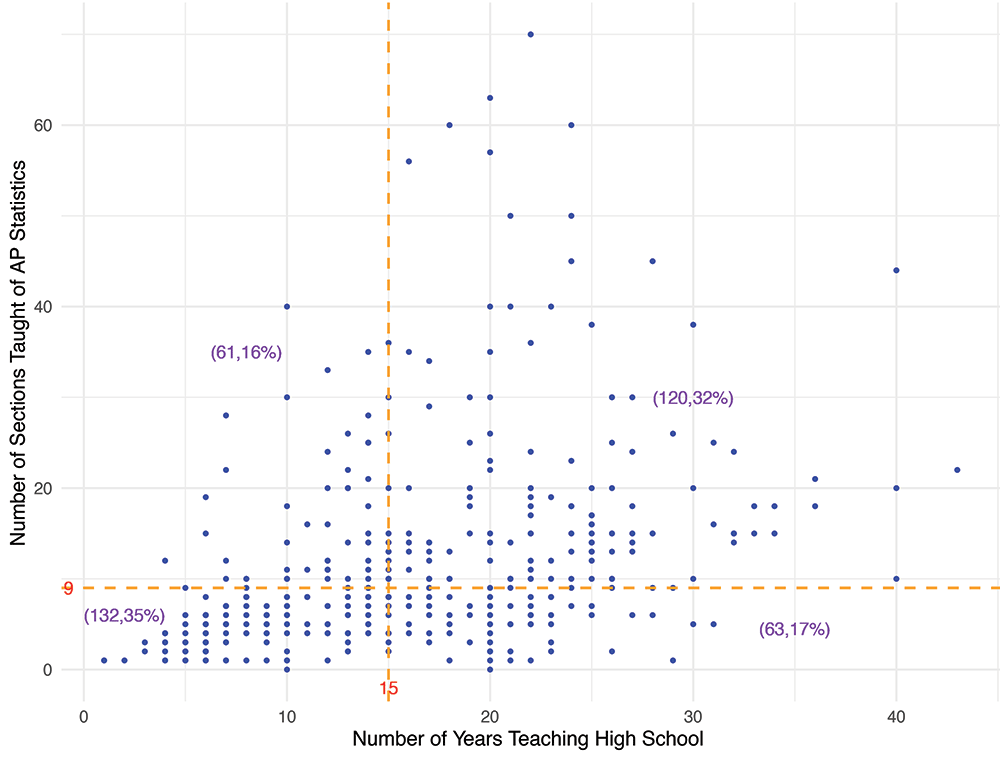
Figure 1. Relationship between years of experience teaching AP Statistics and teaching high school mathematics. Dashed lines are median values. Values in purple indicate the number and percent of teachers in that quadrant relative to the median lines.
Although there are expected and practical bounds for this trend, it appears that teachers who begin teaching AP Statistics courses tend to teach the course repeatedly throughout their career. Otherwise, it could be expected that a higher frequency of teachers would fall into the bottom-right category with respect to the median lines. However, those in the bottom right of the graph represent 17% of AP Statistics teachers in this sample. This is an indication that some highly experienced high school mathematics teachers are relatively new to teaching AP Statistics, given those who may have begun teaching these courses later in their careers. Many AP Statistics teachers are also early- to mid-career (1–15 years) and have taught less than one AP Statistics course per year of teaching experience.
Educational background
Most AP Statistics teachers are highly educated, with 72% holding a master’s degree, 4% a doctorate, and 3% some other terminal degree such as an educational specialist (typically 15–30 hours beyond a master’s degree). Survey respondents indicated the discipline for their educational degrees: At any educational level, most (62%) of these AP Statistics teachers hold an education degree (including mathematics education), while 58% have a degree in mathematics or a similar field such as applied mathematics (not including statistics or mathematics education). In many institutions, secondary mathematics teachers earn degrees in mathematics with add-on teaching licensure, while others earn undergraduate degrees in mathematics education or secondary education. Seven percent reported holding a degree in statistics or a similar field.
Interestingly, another 7% of participants did not hold any degrees in education, statistics, or mathematics, and instead listed degrees from an engineering discipline, business, finance, or economics. These teachers are likely to be career-changers who have entered the teaching profession through alternative teaching licensure or preparation routes.
About half of the AP Statistics teachers in the sample (n = 197, 51%) had taken two or fewer undergraduate or graduate statistics courses, which means about half had taken three or more courses, with 73 teachers reporting having taken six or more statistics courses. This is notable in that there is an association between teachers’ feelings of preparedness to teach introductory AP Statistics and the number of statistics courses they have taken. This association is evident in the mosaic plot in Figure 2, where feelings of preparedness increase with the number of undergraduate or graduate statistics courses taken. Feeling completely unprepared was rare; teachers indicated feelings of complete unpreparedness only when they had taken two or fewer undergraduate or graduate statistics courses.
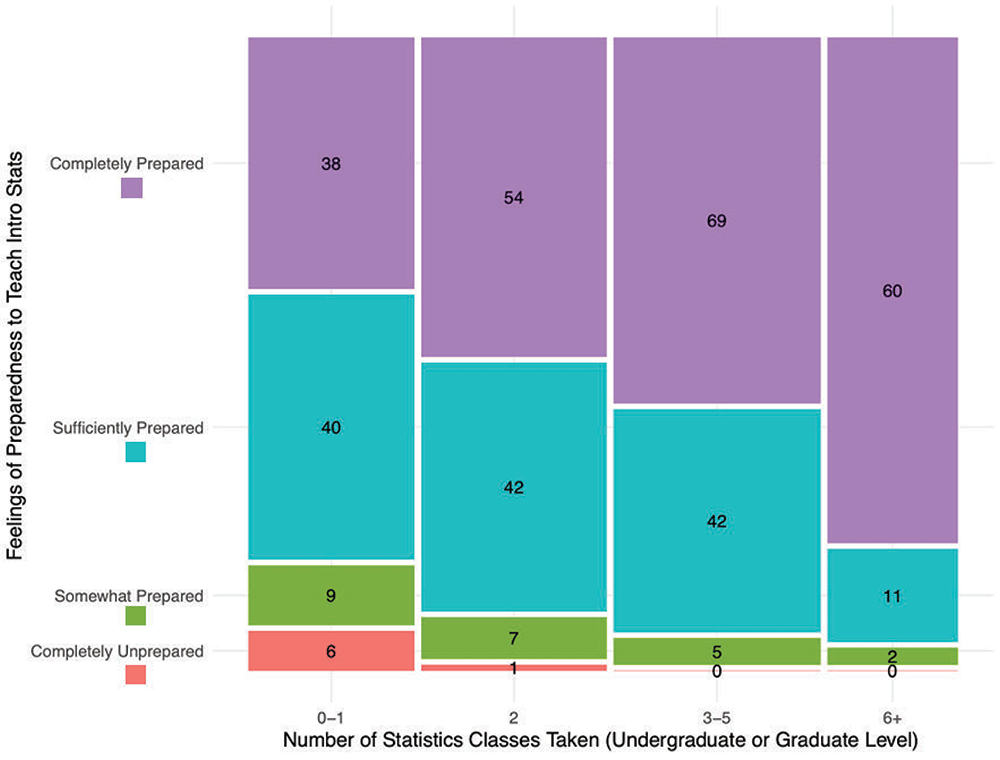
Figure 2. Relationship between number of statistics courses taken and four levels of feelings of preparedness to teach introductory statistics. Number of teachers indicated in each block.
The Statistical Education of Teachers report, published in 2015, recommended that all teacher preparation programs include three courses in statistics for all secondary mathematics teachers. Many teachers also have opportunities to take statistics courses in graduate programs, with beginning graduate-level courses often having similar content to first and second year undergraduate courses.
It is well known that content courses are not sufficient in preparing teachers to teach statistics. In their 2021 paper in JSDSE, Hollylynne Lee and Taylor Harrison discuss further the ways AP Statistics teachers have pursued professional learning: through workshops, conferences, online courses, serving as a reader for AP Statistics exam scoring, and engagement with online resources designed for statistics teachers.
Course Characteristics
Student background
The College Board makes a strong point of encouraging schools to provide equitable access to the AP Statistics course for as many students as possible. They explicitly recommend that a second course in algebra is a reasonable prerequisite and discourage restrictive gateway practices for access to the course. For the majority of teachers reporting (73%), the prerequisite for AP Statistics at their school was Algebra II or the Common Core Math equivalent (e.g., an Integrated Math III course); 5% reported no specific course requirement.
The good news is that AP Statistics is considered an option and available for students as a third- or fourth-year math class in many of these high schools. However, other schools are setting prerequisites that would require students to be on accelerated paths through their high school math requirements. Pre-calculus or Advanced Functions and Modeling was a prerequisite course reported by 14% of teachers, while 8% reported some other requirement (e.g., Discrete Math, a co-requisite requirement with Algebra II, or teacher recommendation).
These practices seem counter to the intent of the College Board to ensure equitable access to a course in statistics, especially since most schools do not offer a non-AP course that engages students in statistics. Related to taking the AP Statistics exam, 65% stated there was an expectation or requirement that students in their course take the exam, with teachers reporting a mean of 86% of students who actually do so.
When AP Statistics teachers were asked to identify any constraints that keep them from making changes they would like to implement to improve their courses, 126 listed student characteristics (ability, interest, etc.) as a contributing factor. Some also used the “other (please describe)” choice to provide information. Additional insight was gained from two comments in particular: that any student in their school who signs up to take the AP Statistics course is allowed to do so, regardless of their ability level or actual interest in the course, and that another particular school did not provide any other statistics course (such as Honors Statistics) as an alternative to the AP Statistics course. If these are viewed in tandem, the problem would be exacerbated, since students might have no other “choice” for learning more statistics than the AP Statistics course.
Similar concerns were expressed by 18 AP Statistics teachers interviewed as a follow-up to this survey. One teacher said that it is harder for her to teach AP Statistics than it is to teach AP Calculus, due in part to the motivation level of students, given her students’ perception that AP Statistics is the “easier” of the two AP courses. Another teacher also described the different levels of students seen in her classroom. Some students are taking AP Statistics after already having completed Calculus, and according to her, others “sneak in” by getting through Algebra II. In her mind, this compounds the fact that the curriculum is already “enormous” to teach, and having to differentiate instruction for such a “huge diverse learning population” is challenging and somewhat stressful to do, even in a year-long course.
Class size and students per school
The typical class size of an AP Statistics course has a mean of 22.5 students, with a median of 24. Twelve percent of teachers had typical class sizes of fewer than 15 students, while 6 percent reported larger class sizes—of 35 or more students (see Figure 3a). The mean number of students enrolled per year in a school is 56.6, with a median of 40 students. This distribution is highly skewed right, with most reporting fewer than 50 students (e.g., one or two class
sections per year), and 17% of teachers reporting 101–350 students enrolled in AP Statistics each year at their high schools (three to 10 sections per year), which is probably highly related to the size of the school (see Figure 3b).
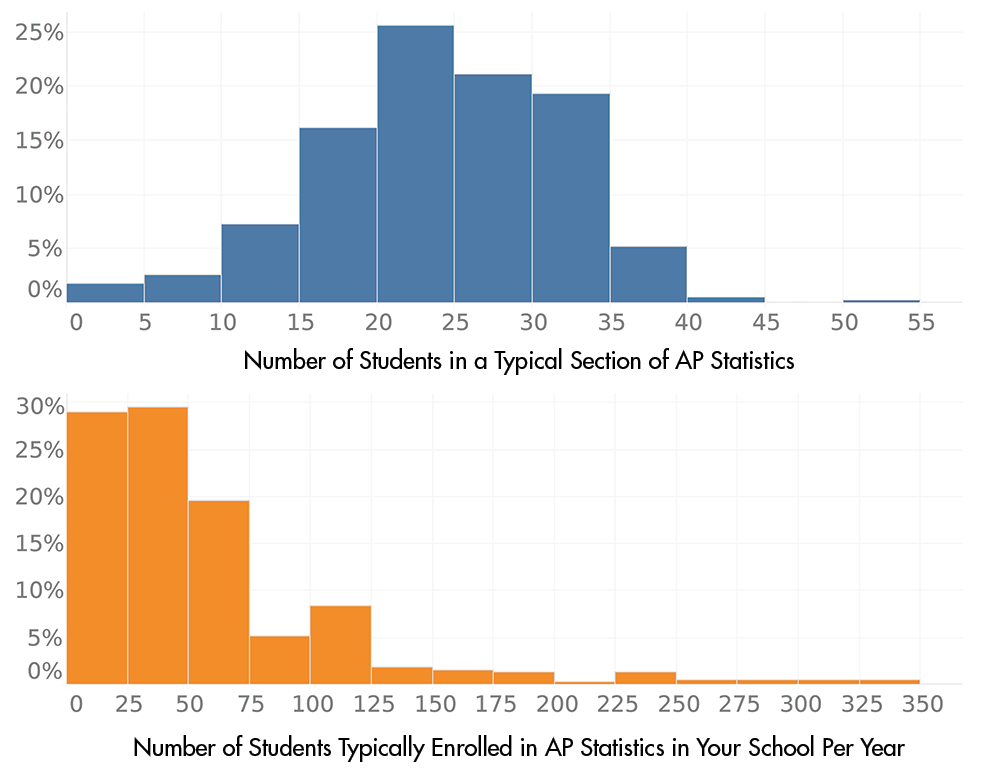
Figure 3. Distribution of: (a) number of students per section (blue), and (b) number of students enrolled in school per year in AP Statistics (orange).
Class time
Most AP Statistics teachers (75%) report having similar amounts of instructional time, either ~90 minutes for half the days in a school year (semester or year-long A/B blocks of time), or a traditional schedule of 45–60 minutes per day for an entire year. However, some teachers described an “other” schedule with as little as ~60 hours total of instructional time per course (200 minutes a week for half a school year), and some as high as ~270 hours (450 minutes a week for the entire year).
Student opportunity to learn statistics in class time with their teacher and how that is distributed throughout a school year varies greatly, although the most common (40%) is a traditional schedule of daily class periods of 45–60 minutes all year.
Figure 4 shows how highly variable the percent of class time teachers spend on various instructional activities is among all teachers, with the predominant activities for many teachers—but certainly not all—being whole-class lecture discussions or demonstrations, and students working in groups. The 2010 and 2019 course description documents certainly emphasize and encourage students working in groups to solve problems, conduct investigations, and develop conceptual understanding of topics.
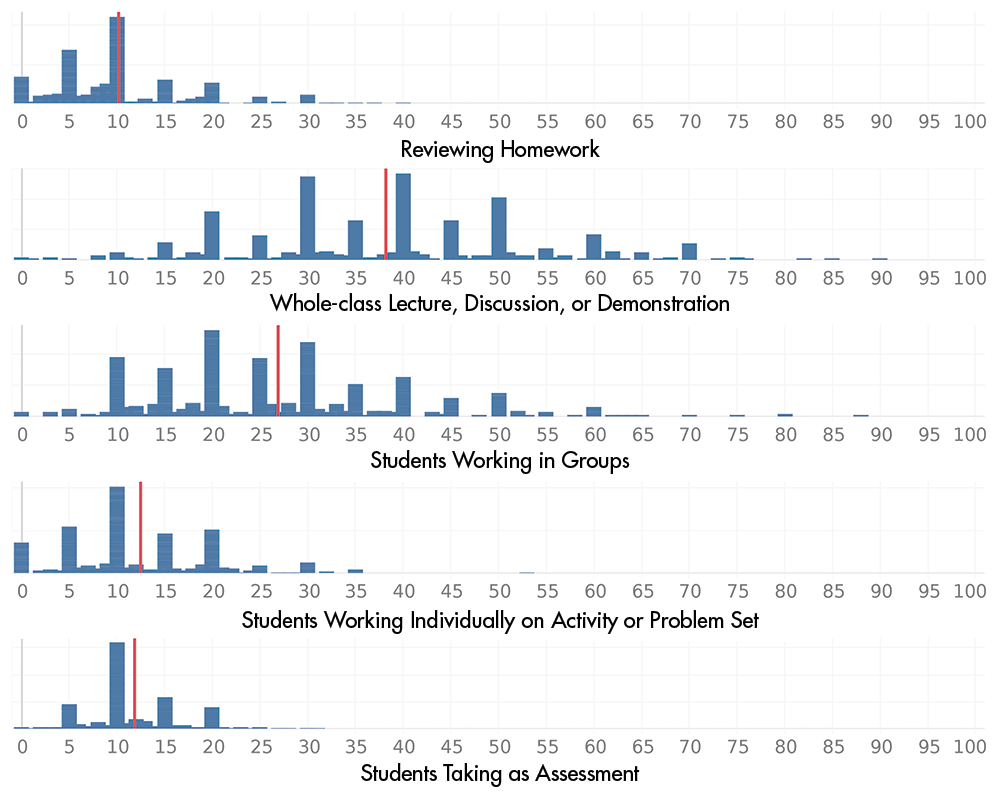
Figure 4. Distribution and mean (red line) for proportion of class time spent on various instructional activities in AP Statistics classes.
These data suggest that a collaborative student work environment could be a major part of a student’s experience in some classes, but is a much smaller aspect of their learning experience in most AP Statistics classes.
The explanation of a typical day in an AP Statistics classroom provided by one of the interviewed teachers can illustrate how the quantitative data presented in Figure 4 match, in general, the practices and responses of the 18 AP Statistics teachers as described in their follow-up interviews. For this teacher, class usually starts with a review of students’ nightly textbook homework, typically in groups, particularly emphasizing difficult problems where group members are unable to reach a consensus on the solution. Next is a transition to the new material for the day, often provided through direct instruction via a PowerPoint slide deck. To solidify this new content knowledge, students then practice problems (typically from past AP exams), both multiple choice and free response, that are 12 minutes in length and divided up as 7 minutes of individual work time and 5 minutes to work in groups.
The direct instruction portion typically lasts approximately a third to half of the class period. Students working in groups and individually account for the remainder of the class period, including homework, free response questions, and multiple choice questions, all of which have both individual and group components.
While there were many variations of this routine, this teacher provides some insight into the ebb and flow of a typical AP Statistics classroom. Other teachers described using applets, graphing calculators, simulations, and demonstrations sprinkled in among direct instruction, including many hands-on activities and tasks for group work, and engaging students in a variety of assessments, almost daily, involving both free response and multiple choice items similar to those on the AP Statistics exam.
Access to and use of tools
The 2010 AP Statistics Course Description makes a strong point that:
<blockquote?The AP Statistics course depends heavily on the availability of technology suitable for the interactive, investigative aspects of data analysis. Therefore, schools should make every effort to provide students and teachers easy access to computers to facilitate the teaching and learning of statistics. (p. 6)
Based on teachers’ reports, however, computer-based tools are not often used. Overwhelmingly, the teachers (96%) report a strong reliance on graphing calculators for student work (activities, homework, assessments) and minimal use of computers for engaging in other tools. For example, 50% of AP Statistics teachers in this survey have students use spreadsheets, and 52% have students engage with web applets (e.g., Rossmman/Chance apps, Statkey, textbook-related apps); however, 50% never use statistical software (JMP, Minitab, SAS, R), and 65% never use educational statistical tools such as Fathom, TinkerPlots, or CODAP (which is web-based and free).
When either of these types of tools is used, it is mostly only by teachers for whole-class demonstrations—only 23% of teachers report that students use statistical software directly and 10% have students use educational statistical tools.
The results from the survey were confirmed by the 18 AP Statistics teachers in follow-up interviews. More often than not, when the teachers interviewed discussed using applets or simulations in their classroom, they are using the technology to demonstrate statistical concepts to give students an opportunity to visualize concepts, especially with more-difficult concepts such as taking repeated samples and the sampling distribution. It was reported less often that students were in the driver’s seat with technology.
Further research is needed to investigate the surrounding factors, but this could be related to access to technology and instructional practice. One teacher, however, enthusiastically portrayed their AP Statistics classroom where students were nearly always working in groups, rather than individually (typically groups of four, a practice that seems to be used in all their classes, not just AP Statistics), where students are using Google ChromeBooks from a dedicated cart in the classroom to access applets (they referenced the class textbook, Practice of Statistics, and StatsMedic) associated with each particular lesson.
Even for the few other teachers reporting access or ability to use a cart of ChromeBooks, only this interviewed teacher reported a high level of students’ engagement with technology tools where students were in charge of the applets and their own learning. This teacher also expressed the desire to be able to use a statistical software package, but did not believe ChromeBooks were sufficient for that purpose, in terms of memory, speed, and computational power. Other teachers expressed some level of frustration with their ChromeBooks, which appeared to be rarely used in their classes.
The most common reasons why teachers predominantly report using graphing calculators are that: 1) graphing calculators are the only technology allowed on the AP Statistics exam, 2) students are provided with statistical output, and 3) there is a lack of time to incorporate other technology. It is important to note that only 41 of surveyed teachers reported that computing technology is not available for use in their classrooms. But even when computers are made available, teachers are not giving students the opportunities to experience the “interactive, investigative aspects of data analysis.”
The 2019 AP Statistics Course and Exam Description includes stronger statements and encouragement for using computer-based tools, especially free web-based applets, and explicitly encourages at least a teacher computer with software installed to be used in class demonstrations. Based on these data, we hope that the resources provided in the new course description will assist teachers in moving toward using more computer-based tools to supplement, or replace, their use of a graphing calculator.
What Aspects of Statistics Are Emphasized?
Curricular emphasis on statistics
The 2010 AP Statistics Course Description organized the course into four topics and listed a range for the approximate weight for each topic on the AP Statistics exam.
- Exploring Data: Describing patterns and departures from patterns (20–30% exam weight)
- Sampling and Experimentation: Planning and conducting a study (10–15% exam weight)
- Anticipating Patterns: Exploring random phenomena using probability and simulation (20–30% exam weight)
- Statistical Inference: Estimating population parameters and testing hypotheses (30–40% exam weight)
In 2019, the course description was updated to include nine topics instead of four, but mapping the nine new topics onto the four old ones results in approximately the same exam weights.
Asked to estimate the percentage of their overall course devoted to the four topics, in general, teachers (n = 426) reported devoting curricular time approximately in proportion to the 2010 suggested exam weights, with considerable variability and some notable trends (see Figure 5). The topic of Sampling and Experimentation is receiving more curricular time than its proportional exam weight, with 51% of teachers reporting spending more than 15% of time (recommended 10–15% exam weight) and a mean of 17% of curriculum emphasis. The topic of Statistical Inference received curricular emphasis in the upper end of the recommended range (mean 38.1%), with 27% of teachers spending more than 40% (maximum exam weight) of the curriculum focused on inference.
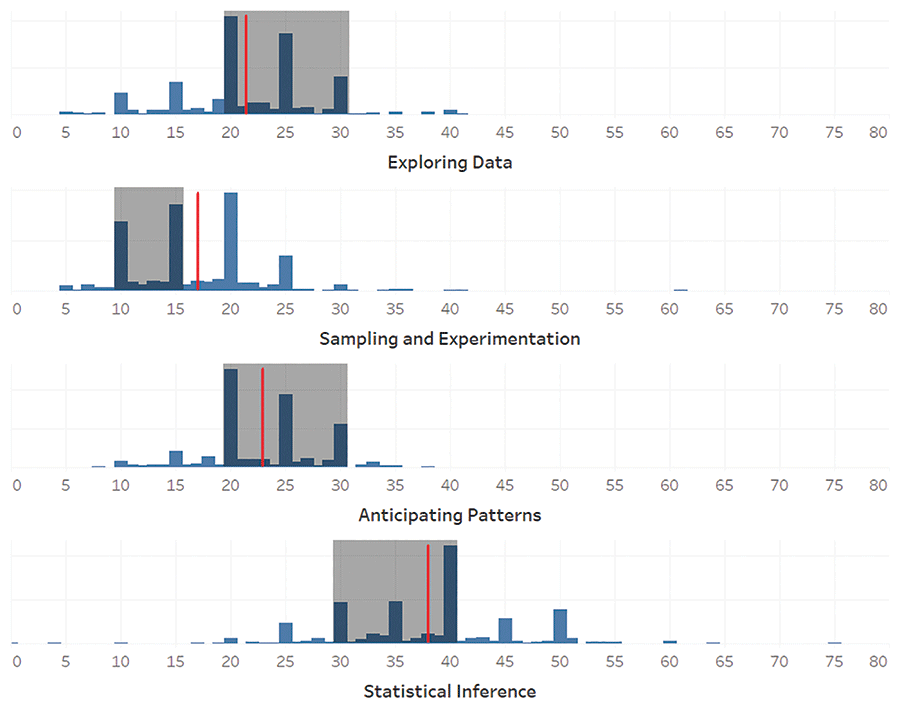
Figure 5. Distribution of proportion of time (mean indicated by red line) in courses related to four categories in AP Statistics curriculum, with shaded portion representing range of emphasis of topic on the AP Statistics exam in the 2010 AP Statistics Course Description.
Two topics had a mean curricular emphasis in the lower end of the recommended range, with many teachers reported using less time in their curricula than the recommended minimum exam weight: Exploring Data (27%) and Anticipating Patterns (17%). The new 2019 course guide may assist teachers in better pacing of the curriculum since it organizes content into units.
Emphasis on important goals for statistics learning
We were also interested in how much time teachers spent on preparing students for different aspects of statistical practice. Almost all participants report spending a “moderate” amount or “a lot” of time on preparing students to engage in aspects of statistical practice highly valued by the ASA and emphasized in the GAISE College Report: understand and use statistical inference; produce and interpret graphs and summaries; explain variability and the central role of randomness; and answer questions using an investigative process (Figure 6).
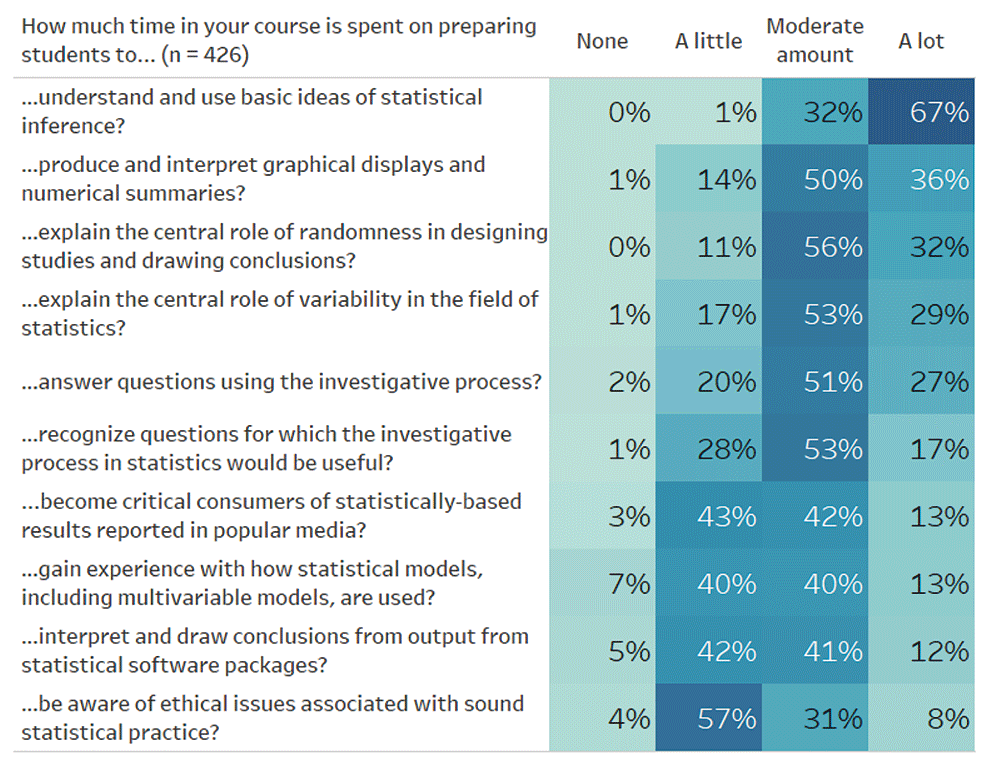
Figure 6. Emphasis on preparing students for different aspects of statistical practice, ordered from most to least emphasis. Darker-blue colors indicate teachers selecting a response with greater frequency.
AP Statistics teachers spend less time, however, on preparing students to become critical consumers of media reports, gaining experience with how statistical models are used, interpreting output from statistical software, and becoming aware of ethical issues associated with statistical practice.
Summary and Recommendations
We hope that the trends presented here will provide insights for those in the ASA community who work most closely with AP Statistics teachers. While many AP Statistics teachers responding to this survey have strong backgrounds in statistics content and are highly experienced high school teachers, some have not engaged much in learning statistics themselves via courses. In recognition of this, increasing professional development (PD) opportunities, such as workshops focusing on statistics concepts and engaging in statistical investigations, can offer supplemental opportunities for teachers to gain confidence in their preparedness.
This type of PD can be useful even for teachers who have taken many statistics courses, since engaging in investigations themselves—ideally working in small groups—offers more than statistical content knowledge and can increase the understanding of different instructional strategies and use of computing tools to support work with data.
Although teachers may be experienced high school math teachers, it is important to remember that many AP Statistics teachers are relatively new to teaching this course. Even if they have taken a few statistics courses, that may have been long before reform efforts in college-level statistics instruction occurred as suggested in the GAISE College Report.
Teachers need assistance in learning to use computer-based tools for engaging in statistics that align more closely with those used in collegiate level statistics courses. Not surprisingly, statistical inference is a clear focus in AP Statistics, with a large portion of course time dedicated to this element. However, given the strong use of the graphing calculator, the aspects of statistical inference that students get to experience may not live up to the conceptual ideas promoted in simulation-based inference activities often used in college-level introductory statistics. With current efforts toward improving ethical use of data and preparing data-literate citizens who can make sense of graphs and statistics reported in media, there should be more effort in ensuring these aspects are incorporated into AP Statistics, in both the curriculum and instructional practices.
Despite sharing a common curriculum, there is large variation in how AP Statistics is implemented across different schools. Differences in students’ mathematical backgrounds, class sizes, and students enrolled per school indicate that teachers must be able to adapt their statistics instruction to their school contexts. Some schools seem to impose undue prerequisites for course placement, and some teachers express concern about student motivation and how that affects their classrooms. Making teachers aware of the different contexts they may face can better prepare them for the realities of the classroom.
Although some teachers in this survey probably are relatively well-connected to the statistics community, many others are not. Particularly for those who are new to teaching AP Statistics or are the only AP Statistics teacher in their school (a common occurrence), a connection to a larger community can help them implement the course successfully.
The ASA community has always been a critical partner in the success and growth of the AP Statistics course in high schools. We encourage this continued commitment to improve the curriculum, assessment, teacher professional learning, and outreach to local AP Statistics teachers that can ultimately improve equitable access to strong statistical learning experiences for more high school students. These ideas could help with getting involved.
- Connect with local AP Statistics teachers (check websites of local high schools or contact a school district secondary mathematics administrator).
- Consider sending teachers information about the free trial ASA membership for K–12 teachers and specific resources and professional development for teachers.
- Get to know the AP Statistics community of teachers through the College Board’s online discussion board. Suggest this online community to teachers as well: https://apcommunity.collegeboard.org/web/apstatistics/home.
- Offer to visit an AP Statistics class to let students know how you use statistics and computing tools in your job and connect them to the ASA’s thisisstatistics.org website. Emphasize ethical practices in statistical work and the importance of being critical consumers of graphs and statistics reported in media.
- Offer a workshop to introduce AP Statistics teachers to industry computing tools such as R, SAS, and Python, or educational statistical tools such as StatCrunch or CODAP.
- If affiliated with a university, connect with faculty in secondary mathematics education. Consider offering a graduate-level course for teachers that engages them with statistics content; using computing tools; and illustrating ways to use instructional strategies, such as working in groups to investigate data. Work with faculty in secondary mathematics teacher preparation programs to consider how to increase the number of statistics courses required in the program and how to infuse more preparation to teach statistics in courses. Consider using materials such as MODULE(S)2 and ESTEEM that are specifically designed for secondary statistics teacher preparation.
By getting involved and working together as a statistics community, we can have positive impacts on statistics learning opportunities for many high school students.
Further Reading
College Board. 2008. AP statistics teacher’s guide. The College Board.
College Board. 2010. AP statistics course description. The College Board.
College Board. 2019. AP statistics course and exam description. The College Board.
ASA Revision Committee. 2016. GAISE College Report Guidelines for assessment and instruction in statistics education college report.
Franklin, C., Bargagliotti, A.E., Case, C.A., Kader, G., Scheaffer, R., and Spangler, D. 2015. The statistical education of teachers. American Statistical Association.
Lee, H.S., and Harrison, T.R. 2021. Trends in teaching Advanced Placement Statistics: Results from a national survey. Journal of Statistics and Data Science Education. DOI: 10.1080/26939169.2021.1965509.
About the Authors
Hollylynne S. Lee is a Distinguished Professor of Mathematics and Statistics Education in the Department of STEM Education at North Carolina State University. Her research focuses on the use of technology to support teaching and learning of statistics, probability, and data science concepts in grades 6–12 and introductory college courses. She is a 2020 Fellow of the American Statistical Association.
Zachary T. Vaskalis is a doctoral candidate in the Learning and Teaching in STEM–Mathematics and Statistics Education program at North Carolina State University, as well as an assistant professor at the Campbell University School of Osteopathic Medicine, teaching biostatistics. His research interests include biostatistics education, teaching and learning statistics, statistical thinking, evaluation and assessment, curriculum development, and empathy.
David J. Stokes is a doctoral candidate in the Learning and Teaching in STEM–Mathematics and Statistics Education program at North Carolina State University, and a graduate research assistant for the Writing Data Stories Project, the Validity Evidence for Measurement in Mathematics Project, and the Department of Academic and Student Affairs – Office of Assessment. His research interests include sociocultural approaches in STEM and data science education in relation to changing patterns in STEM underrepresentation.
Taylor R. Harrison is an assistant professor of mathematics education at Northwest Missouri State University. His research interests include the instructional practices and decision-making of secondary statistics teachers, and the design of curricular materials for statistics and teacher education.


