When Nothing Is Not Zero
A true saga of missing data, adequate yearly progress, and a Memphis charter school
One of the most vexing problems in all of school evaluation is the issue of missing data. This manifests itself in many ways, but when a school, a teacher, or a student is being evaluated on the basis of their performance, the most common missing data are test scores.
If we want to measure growth, we need both a pre- and a post-score. What are we to do when one or the other, or both, are missing? If we want to measure school performance, what do we do when some of the student test scores are missing?
There is no single answer to this problem. Sometimes the character of the missingness can be ignored, but usually this is reasonable only when the proportion of missing data is very small. When that is not the case, the most commonly adopted strategy is called “data imputation.” This means we derive plausible numbers and insert them where there are holes. How we choose what numbers we insert depends on the situation and what ancillary information is available.
Let us consider the specific situation of Promise Academy, an inner city charter school in Memphis, Tennessee, that enrolled students in kindergarten through 4th grade for the 2010-2011 school year. Its performance has been evaluated on many criteria, but of relevance here is the performance of Promise students on the state’s reading/language arts (RLA) test. This score is dubbed its reading/language arts adequate yearly progress (AYP) and is dependent on two components: the performance of 3rd- and 4th-grade students on the reading/language arts portion of the test and the performance of 5th-grade students on a separate writing assessment.
We observe the RLA scores, but because Promise Academy does not have any 5th-grade students, all of the writing scores are missing. What scores should we impute to allow us to calculate a plausible total score? Tennessee’s rules require a score of zero be inserted. There are circumstances in which imputing scores of zero might be reasonable. For example, if a school only tests half of its students, we might reasonably infer that they were trying to game the system by choosing to omit the scores from what are likely to be their lowest-performing students. This strategy is mooted by imputing a zero for each missing score. But this is not the situation for Promise Academy. Here, the missing scores are structurally missing—they could not submit 5th-grade scores because they have no 5th graders! Yet following the rules requires imputing a zero score and would mean revoking Promise Academy’s charter.
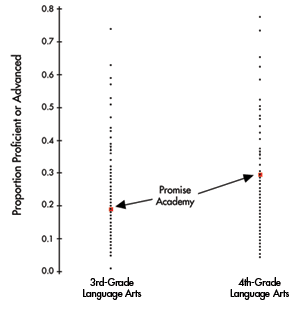
What scores should we impute for the missing ones so we can more sensibly compute the required AYP summary? We see in Figure 1 the distribution of performance on all schools for 3rd- and 4th-grade RLA tests. We see that Promise Academy did reasonably well on both the 3rd- and 4th-grade tests.

Figure 1. The proportion of 3rd- and 4th-grade students who score in the “Proficient” or “Advanced” categories in language arts for each elementary school in Memphis, Tennessee. The performance of Promise Academy’s students is highlighted.
Not surprisingly, the calculated figure for AYP in RLA can be estimated from 3rd- and 4th-grade performance. It will not be perfect, because AYP also includes 5th-grade performance on the writing test, but it turns out to estimate AYP very well indeed. Figure 2 is a scatterplot showing the bivariate distribution of all the schools with their AYP RLA score on the horizontal axis and the predicted AYP RLA score on the vertical axis. Drawn in on this plot is the regression line that provides the prediction of AYP RLA from the best linear combination of 3rd- and 4th-grade test scores. In this plot, we have included Promise Academy. As can be seen from the scatterplot, the agreement between predicted AYP and actual AYP is remarkably strong. The correlation between the two is 0.96 and the prediction equation is:
AYP = .12 + 0.48 × 4th RLA + .44 × 5th RLA.

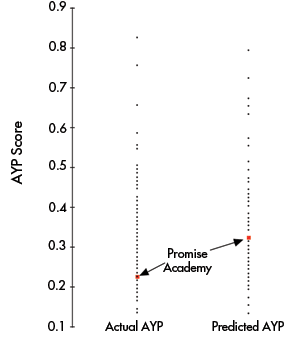
Figure 2. A scatterplot showing, on the horizontal axis, the actual AYP score for every school using the actual performance of 3rd-, 4th-, and 5th-grade students. The vertical axis shows what the AYP score is predicted to be from just the 3rd- and 4th-grade scores. The performance of Promise Academy is highlighted.
We note that Promise Academy’s predicted AYP score is much higher than its actual AYP score (0.33 predicted vs. 0.23 actual) because they do not have any 5th graders and hence the writing scores were missing. The difference between the actual and predicted is due to a zero writing score being imputed for that missing value. The regression line provides us with our best estimate of what Promise’s AYP would have been in the counterfactual case of their having had 5th graders to test. We thus estimate that they would have ranked 37th among all schools in AYP rather than 88th based on the imputation of a zero.
This dramatic shift in Promise Academy’s rank is made clearer in Figure 3, which shows the two AYP scores graphically.

Figure 3. The same results shown in Figure 2 are repeated as two dotplots showing the dramatic change in Promise Academy’s AYP score when we do not include their nonexistent 5th-graders’ performance.
Standard statistical practice would strongly support imputing an estimated score for the impossible-to-obtain 5th-grade writing score, rather than the grossly implausible value of zero.
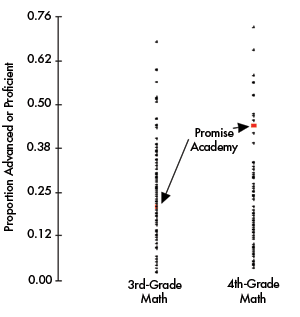
We note in passing that the solid performance of Promise Academy’s 3rd and 4th graders in the language arts tests they took was paralleled by their performance in mathematics. In Figure 4, we can compare the math performance of Promise’s students with those from the 110 other schools directly. This adds further support to the estimated AYP RLA score that was derived for Promise Academy.

Figure 4. The proportion of 3rd- and 4th-grade students who score in the “Proficient” or “Advanced” categories in mathematics for each elementary school in Memphis, Tennessee. The performance of Promise Academy’s students is highlighted.
The analyses performed thus far focus solely on the actual scores the students at Promise Academy obtained. They ignore entirely one important aspect of the school’s performance that has been a primary focus for the evaluation of Tennessee schools for more than a decade—value added. It has long been thought that having a single bar over which all schools must pass was unfair to schools whose student bodies pose a greater challenge for instruction. Thus, evaluators have begun to assess not just what level the students reach, but also how far they have come. To do this, a complex statistical model—pioneered by William Sanders and his colleagues—is fit to “before-and-after” data to estimate the gains—the value-added—that characterizes the students at a particular school. It is here that we can obtain ancillary information to augment the argument made so far about the performance of Promise Academy. Specifically, two separate sets of analyses by two research organizations (Stanford’s Center for Research on Education Outcomes and Tennessee’s own Value-Added Assessment System) both report that, in terms of value-added, Promise Academy’s instructional program has yielded results that place it among the best-performing schools in the state. Despite the problematic character of value-added models, we cannot interpret positive results as negative.
When data are missing, there will always be uncertainty in the estimation of any summary statistic that has, as one component, a missing piece. When this occurs, standards of statistical practice require that we use all available ancillary data to estimate what was immeasurable. In the current case, it was the performance of 5th graders in a school that ends in 4th grade. In this instance, it is clear from 3rd- and 4th-grade information in both reading/language arts and mathematics as well as value-added school parameters, that the Promise Academy AYP score obtained by imputing a zero score for the missing 5th grade grossly misestimates the school’s performance.
In October of 2011, the school presented its case to the Memphis City Schools administration. Using all the information available, the administration recognized the competent job being done by Promise Academy. Its charter was secured for another year, at which time Promise Academy will have extended its student body to include 5th grade and the necessity for imputing structurally missing data will be moot.
The lesson learned from this experience is important and should be remembered: Nothing is not always zero.


