
Skewed Distributions in Data Science
According to a 2017 article in the Economist, “The world’s most precious resource is not oil, but data.” Given the general excitement and enthusiasm about predictive analytics as a way of generating revenue, this seems to be an accepted opinion of many. However, the quote could have been changed a little, ending in “data scientist” instead of “data.” “Precious” implies scarcity, and in these days of information overload, data are not scarce.
Data by themselves, though, are just a bunch of numbers or words. Going from the raw ore to the final polished product of a prediction or analysis, the necessary middle step is the human who can clean, join, query, analyze, write the algorithm, and predict from the data—the data scientist. The more precious “resource” is the data scientist, because unlike data, it is scarce, and the skillset is hard to master.
Who are the data scientists, what can data scientists do, and where does this lead us as a society?
The Data Scientists
Understanding and describing a “typical” data scientist requires looking at the demographics of this group. The companies that hire the most data scientists are Microsoft, Facebook, IBM, Google, Amazon, and Apple, according to reports of race and gender distribution of data scientists in Diffbot State of Data Science, Engineering & AI Report – 2019 – insideBIGDATA. When data scientist was not a reported category, “tech” employees could be used as a proxy. For summary measures for industry, the race and gender percentages of all six companies could be used to calculate the median percentage of the categories.
Data scientists are also common in academia and research groups. Race and gender proportions for academia are compiled from the data from online resources and may not be exact, but the trends are clear: The data science field is predominantly male, with Black and Hispanic groups represented in lower proportions compared to the total U.S. population.
The Data Science Diversity Gap (forbes.com) provides employment requirements and education data. This report indicates that at least an undergraduate degree is needed to be a data scientist. The report also provides the racial and gender distribution of students graduating with a degree in data science. Figure 1a provides a holistic picture of racial distribution in data science. It includes race proportions of the U.S.—those employed in industry and academia, as well as data science graduates. Figure 1b gives the same information for gender. For students of color, the proportions who have a job in data science (5%) and who graduate in data science (4%) are close. Similar trends are observed for Hispanics/Latinos: 7% (employed) and 8% (graduated). In Figure 1b, these percentages are 63% (employed) and 67% (graduated) for males and are close as well.
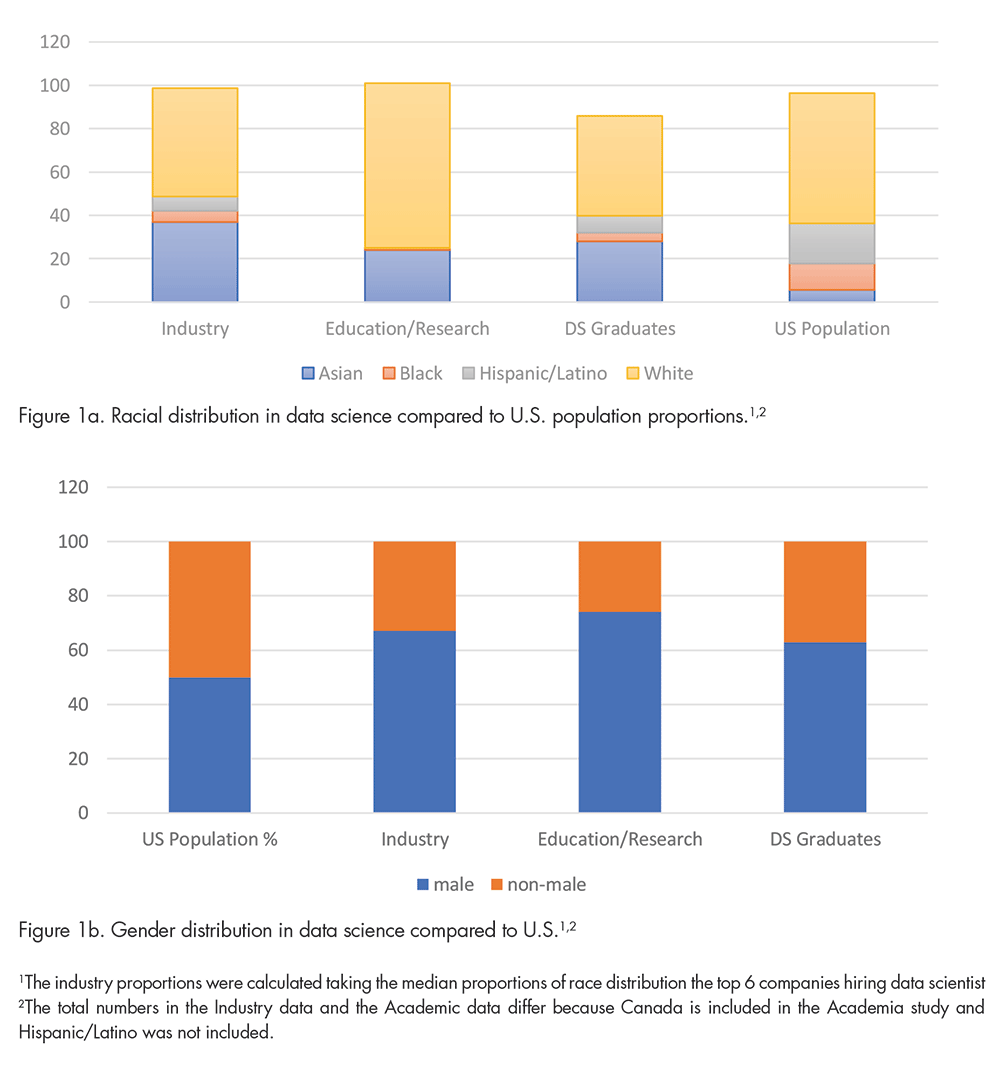
Figure 1a. Racial distribution in data science compared to U.S. population proportions.1,2
Figure 1b. Gender distribution in data science compared to U.S.1,2
1The industry proportions were calculated taking the median proportions of race distribution the top 6 companies hiring data scientist
2The total numbers in the Industry data and the Academic data differ because Canada is included in the Academia study and Hispanic/Latino was not included.
Hence, in very general terms, it appears that racial and gender distribution of students who are graduating from college in data science, roughly, matches the numbers who are employed as data scientists in industry. This points to a lack of a pipeline for employment, rather than a racial or gender bias in employment.
In asking why the proportion of students graduating in data science is out of alignment with the total U.S. numbers, we can look at grade-school-level data, with a focus on what is happening in high school.
To get into data science, considered an amalgam of mathematics, statistics, computer science, and domain knowledge, one of the criteria is “math readiness” on graduating from high school. The high school data in 2015–16 Civil Rights Data Collection: STEM Course Taking (ed.gov) clearly show that students who come from high schools with high Black and Latino enrollments have a distinct disadvantage in terms of classes being offered in math and STEM: The percentage of high schools offering Algebra II is 80% for all high schools compared to 74% for schools with high Black and Latino enrollments. While calculus is offered in 50% of U.S. schools, only 38% of schools with high Black and Latino enrollments offer it.
Using data from Signs that fewer black students are taking calculus in high school (hechingerreport.org), Figure 2 shows distribution of course enrollment by race. Looking at when a student takes Algebra I (offered generally by eighth grade) provides an interesting picture of “math readiness” by race. More Asian and White students take Algebra 1 in middle school so they can enroll in Algebra 2, and ultimately in calculus, by the end of high school. Looking at the opposite angle and focusing on students taking Algebra 1 as seniors (who are unlikely to get into data science): 3% (Asian), 19% (Black), 35% (Hispanic), and 37%(White). When compared to the U.S. population percentage of 5% (Asian), 16% (Black), 24% (Hispanic), 51% (White), there are higher percentages of Black and Hispanic students who are less likely to go into data science.
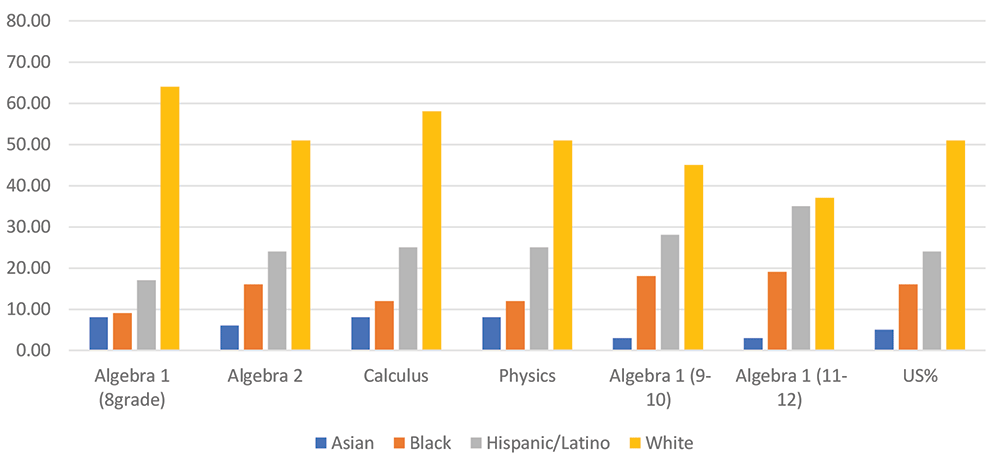
Figure 2. Preparatory courses in grade school.
This is an attempt to show a lack of “math opportunity” by race. Data on socioeconomic status (SES) Data – S&E Indicators 2018 | NSF – National Science Foundation tell a very similar story: In general, regardless of race, the more affluent a student is, the higher their score in mathematics on standardized tests. For example, compare the highest (top 20%) to the bottom (lowest 20%) SES and look at the percentage of students in each group who have not enrolled in any physics classes (mathematics is compulsory for all students, so physics can be used to make this point) in their high school. For White students, 44% in the highest SES level do not enroll in a physics class, compared to 72% in the lowest SES; for Black students, these values are 51% and 67%; for Hispanic, 47% and 66%; and Asians, 23% and 50%.
It is clear that not everybody has the same opportunity, as shown in Figures 1 and 2, for math readiness.
Conclusion
There are opportunity gaps in terms of who can get into data science.
Data: Where Are They Used and for What?
Currently, there are more than 6,000 tweets per second with people freely giving their opinions about everything from politics to pets and pottery. These data are easily harnessed by anyone who knows how to scrape material from the internet. Historical data combined with harnessed data are then used, and business analytics (BI) deployed, to make business decisions. Companies like Tableau, Microsoft, IBM, SAS, and Oracle are all top contenders in the BI space. Apps and software like Domo, Planful, NetSuite, Allvue, and Sigma Computing promise that their software programs are capable of building dashboards; identifying key performance indicators; and suggesting strategic plans, along with visuals.
Both small and large companies advertise predictive analytics (defined as statistical modeling or data mining of historical data to predict the future) and prescriptive analytics (defined as application of mathematical and computational sciences for company-specific decisions). Every administrator, whether in academia or industry, and decision-maker is interested in “data-based decision-making,” wanting to use available or historical data to predict aspects of their products/clients/students and make decisions.
Currently, algorithms based on machine learning (ML) and artificial intelligence (AI) are the rage in automated decision-making, having replaced standard statistical modeling. Companies that came into the tech space early have been using such techniques to recommend books, clothes, electronics, and more to users for quite a while. Targeted advertisements have also become mainstream with profit (sometimes at the cost of social welfare) as the main instigator.
In businesses, where profit is the main goal, this makes sense. However, more and more social decisions are now being automated using algorithms. Examples include qualifying for a home loan or even welfare in some countries. The reasoning behind automated social decisions is often that “humans can be biased, but machines are not.” Studies are being conducted to understand this assertion, For example, Renerik and Henrikson discussed automation in social decisions in Sweden and concluded that automated social decisions are efficient but not transparent, so a “value lens” is needed to look at social decision-making.
As a statistician, it is important to underscore that using historical data to train machine learning-based algorithms and optimize on accuracy means the “best algorithms” will recreate the structure from the training data.
Just recently, I was approached by a startup that wanted to develop an app “degree recommender” for college students. Their idea was to take student performance in high school, first year of college, SES, and demographic data, and recommend each student based on their top three “ideal” majors. Given the results from Figures 1 and 2, this app would probably suggest data science for only certain groups, thus perpetuating the skewness and potentially adding to it.
A desire for apps of this kind is not uncommon; many companies want to provide similar apps for automated social decisions.
Conclusion
Under the guise of unbiasedness, data-based predictions are seeping into social decisions.
Algorithmic Bias, or What Are the Impacts on Society?
To look at the assertion that “humans are biased, machines aren’t” objectively requires understanding that machines do not work by themselves. It is true that computers do not have any ingrained bias but produce results based on the criteria the human programmers want to optimize. If “prediction accuracy” is optimized, when the data used are historical, the best predictions will match what has happened in history.
Ruha Benjamin, in Race after Technology (2019), wrote about how a simple decision of a child’s name could trigger what she calls “the New Jim Code” of racial profiling. She gives several examples about algorithmic inequity. One poignant example is the street “Malcom Ten Boulevard” in automated maps. Somehow, the human who coded and ratified this was not aware that the “X” after Malcolm did not stand for “ten,” indicating ignorance of Black history. There are examples of how facial scans fail for people of color, and how certain ZIP codes are used to profile groups.
Cathy O’Neil, in Weapons of Math Destruction (2016), discussed the dangers of using Big Data in talking about the housing crisis in 2007 and how Big Data and algorithms played a part in lending money to individuals who could not make mortgage payments, while the big Wall Street companies “hedged” their risks. She likens certain code to weapons of math destruction (WMD) and presents a graphic picture of how culpable modelers are if social ramifications are ignored.
In Automated Inequality (2019), Virginia Eubanks described how easy it is to manipulate economically challenged people using data and automation. She provided evidence of how certain ads are targeted to certain groups of people and how exclusionary algorithms disallow opportunities such as housing, mortgage, and loans for all.
These books provide many examples of algorithmic bias.
Conclusion
As humans write algorithms, their biases and ignorance creep in, so researchers must accept the possibility of algorithmic bias.
Discussion
Combining these three conclusions presents an unpleasant reality: Data-based decisions are being made using algorithms written by data scientists who are not representative of the U.S. population by race and gender. However, decisions that are taken as infallible by many are routinely made about demographic groups that are underrepresented in data science. Further, important social decisions are being made using algorithms written by a few but being applied to all.
We must face the question of whether we are automating more bias and more inequality. How is this skewness of racial distribution in data scientists affecting decisions made around the world? As statisticians, we cannot ignore this possibility. We might need to rethink what optimizing means for different contexts. What does predictive accuracy really mean if we do not want history to repeat itself?
The lack of math-readiness and lack of opportunity for certain groups in the K–12 system is widely researched in the U.S. There does not seem to be a quick solution (or even a slow solution). While we wait for K–12 to adjust itself for inequity and opportunity loss, will the biases be at a point of no return? Statisticians and data scientists must ask these questions. They might challenge our notions of accuracy, optimization, and loss functions, but when there are social consequences, we have to start somewhere.
There are no easy answers, but unless the questions are asked and discussed, we who understand the enormity of the situation are culpable. We must bring awareness to the statistics community so together, we can bring this discussion to the forefront. What can we do? Where do we start? Whom do we talk to? There are more questions than answers. I urge colleagues to think, brainstorm, and develop ideas before the divisions are too wide to manage.
Further Reading
Benjamin, R. 2019. Race after Technology. Cambridge, UK: Polity Press.
Eubanks, V. 2019. Automating Inequality. New York: St. Martin’s Press.
O’Neill, K. 2016. Weapons of Math Destruction. New York: Broadway Books.
Renerik and Henrikson. 2019. Value positions viewed through the lens of automated decision-making: The case of social services. ScienceDirect.
Data for Individual Companies
Facebook: U.S. employees by ethnicity 2020 – Statista.
Global Diversity & Inclusion Report 2020 – Microsoft.
Google: U.S. employees by ethnicity 2021 – Statista.
IBM CEO and Leadership – Zippia.
Inclusion & Diversity – Apple.
Who’s Building Your AI? Research Brief – Obsidian Security.
About the Author
Nairanjana (Jan) Dasgupta is a Boeing Distinguished Professor in the Department of Mathematics and Statistics and a Data Science Fellow at Washington State University, Pullman. She is a fellow of the ASA and a member of the Advisory Board for Academic Data Science Alliance (ADSA). In 2021, she chaired the EDI committee for WNAR and was president-elect of the Caucus for Women in Statistics. She is passionate about promoting data literacy for all.


