
Maximizing the Expected Value of a Lottery Ticket: How to Sell and When to Buy
With players attracted by the potential winnings from enormous lottery pools, multistate lotteries like Mega Millions and Powerball sell tens to hundreds of millions of tickets each week across the United States. Larger lottery pools attract more sales, but the expected value of a particular lottery ticket is a function of combinatorics, pool size, and consumer behavior.
Calculating the probability of winning a lottery is a standard exercise in combinatorics. Each ticket for the Powerball lottery contains six numbers, with five “white balls,” each in range from 1 to 69, plus one “Powerball” in range from 1 to 26. The grand prize requires selecting all of these numbers correctly. Thus, there are
![]()
possible tickets, making for very low odds of winning the jackpot. Similar rules hold for Mega Millions and other lottery games.
The payoff for a winning ticket varies each week, depending on the size of the prize pool. The pool for Powerball starts at $40 million, but increases each week until there is a winner. On January 13, 2016, it reached a record high of $1.586 billion.
Players like to win, but they do not like to share. Even the largest lottery pool will yield a disappointing payoff if too many players independently select the winning ticket. Having multiple winners also becomes a genuine risk once the pools get big enough. Indeed, fully six of the 10 biggest Powerball/MegaMillions jackpots (as of March 28, 2019) had multiple winners. Two of these big jackpots had to be shared three ways.
We propose and analyze a practical scheme to increase the likelihood of single winners, or equivalently to minimize the probability of sharing. Paradoxically, this manages to increase the expected value of a lottery ticket without costing the central authorities any additional contributions to the payoff pool. Given that larger potential winnings attract more players, we anticipate that implementation of our scheme would generate increased interest in these games, and enlarge the ostensible benefits for or from the governments running them.
Further, we demonstrate that the number of Powerball tickets bought increases quadratically with pool size, which implies that tickets become increasingly less valuable after the pool passes a critical threshold. This analysis makes it possible to determine the range of pool sizes where tickets have positive expected value. In particular, it establishes that Powerball tickets bought (under the current sales model) with pool sizes between $775.2 million and $1.6656 billion have positive expected value.
Selecting Lottery Tickets with Quick Picks
Purchasers of Powerball and Mega Millions tickets have the option to select the combination for each ticket they buy, and roughly 30% of tickets are sold with such self-selected combinations. However, self-selection leads to a greater likelihood of collisions, where multiple players pick the same combination and hence share the prize pool should they win. People tend to choose numbers that are meaningful to them, such as dates and arithmetic progressions. This lack of independence skews certain combinations to be selected far more often than would be suggested by chance.
The remaining 70% of tickets for these lotteries are sold through Quick Picks, where the point-of-sale terminal generates a combination at random. Details of the generation algorithm are not available to us, but we presume that something like a standard linear congruential generator (LCG) is used to produce pseudo-random numbers. These generators iteratively produce a sequence of values using the recurrence relation
Xn + 1 = (a · Xn + c)mod m
Instantiated with appropriate constants a, c, and m, one can permute through all the values of m before repeating. (See Knuth’s Art of Computer Programming for a thorough discussion of the theory of random number generation.)
Our presumption is that such methods do an effective job of selecting tickets with uniform probability on each sales terminal. However, under the well-known birthday paradox, collisions (multiple people with the same birthday) occur surprisingly early in any such independent sampling strategy. The expected number of tickets sold until the first collision is about ![]() tickets sold, where N is the size of the ticket space. For Powerball, where N = 292,201,338, this works out to an expected sales collision after only 21,367 tickets are sold.
tickets sold, where N is the size of the ticket space. For Powerball, where N = 292,201,338, this works out to an expected sales collision after only 21,367 tickets are sold.
The problem of collisions is further complicated because tickets are sold simultaneously at thousands of terminals across the nation. Synchronizing the random number generators across these machines (with the same constants a, c, and m, and initial X0) would be disastrous, because the same combinations would get sold repeatedly by different stores.
The Quick Pick mechanism works independently in different lottery terminals. Kelly Cripe, spokeswoman for the Multi-State Lottery Association, which runs Powerball, says that Quick Picks “has no memory of what it previously selected” as an explanation for why multiple players can get identical combinations. Presuming that the constants and initializations of the random number generators have been chosen correctly, tickets should be collected in stores independently, with the resultant collision probabilities well-defined as a function of the number of tickets sold.
All of this leads to the question of whether it is possible to construct an efficient distributed lottery scheme that minimizes the probability of having to share the prize.
Distributed Strategies for Generating Tickets
In a setting where m stores generate tickets independently on demand, each distinct lottery ticket can be ranked or, equivalently, put in a bijection with a distinct integer ranging from 0 to N – 1. It is a straightforward task to unrank each such an integer into a ticket, as well as the inverse operation of ranking each ticket to its corresponding integer using a recursive combinatoric approach. This can be combined with a pseudo-random number generator for the integers, to ensure that the tickets look sufficiently randomized when ranking (see appendix).
Our analysis considers a ticket as winning only if it claims part of the grand prize, ignoring any smaller prizes granted for similar but incomplete matches, and assumes the winning ticket will be drawn uniformly at random over the ticket space. To simplify the analysis, it assumes that all tickets are bought through a Quick Pick mechanism, meaning that customers cannot or do not select their own combinations.
The goal is to devise an efficient, distributed mechanism to implement Quick Pick to optimize the expected value of a ticket, given that n tickets have been sold. There are three models.
- Independent Generation—This is the simplest ticket generation strategy, and the one presumably implemented in current lottery point-of-sales terminals. Each store generates an integer in the ticket space from 0 to N – 1 uniformly at random on demand for each customer, which is unranked to generate an appropriate combination. Equivalently, the process of selecting balls from an urn could be simulated to generate tickets on demand.
Under such a system, each of the m stores generates tickets independently, without memory of what they or any other store have generated in the past. The downside is that there is no mechanism to prevent the same ticket being generated twice, in different stores or even the same store. - Central Server Generation—At the other end of the spectrum, stores communicate with a central server, to ensure that no duplicate ticket ever gets sold until the (N +1)st request.
Such a server could be implemented by constructing a random permutation of the entire ticket space and responding to the ith ticket request with the ith element in this ordering. After N tickets have been sold, each subsequent ticket will result in a collision, but this is clearly unavoidable due to the pigeonhole principle.
Although this central server idea appears to be optimal in terms of preventing collisions, it requires constant communication between each sales terminal and the server. If this connectivity is lost at any point, tickets cannot be dispensed. We seek a generation approach where ticket machines can work independently without any need of external communication, while still minimizing collisions. - Deterministic Pairing—In this strategy, each store is assigned a “partner” and each store and its partner comprise a pair. Thus, m stores yield p = [m / 2] pairs. Partitioning the ticket space N into p regions, and assigning a distinct region of size N / p to each pair, represents the range of tickets that a particular pair is allowed to sell from. (Recall that each possible ticket is represented by a distinct integer from 0 to N – 1.)
One of the stores in each pair sells tickets in increasing order from the front of the region, while the other store sells tickets in decreasing order from the back. This guarantees that no collisions will occur for each pair until they exhaust the entire region, making it optimal for two stores. All the ticket numbers are first run through a pseudo-random number generator such as a linear congruential generator to get a “random”-looking number before the actual sale. This will avoid sequential tickets from appearing between any pair of stores. Once the store partners and ticket ranges have been assigned, stores need not communicate further with any external party.
Combinatorial Analysis
To determine the expected value of a purchased ticket, given that k tickets have been sold, let P be the prize pool for a winning ticket, and N be the size of the ticket space.
First, consider the expected value of a single ticket. If the combination on this ticket is unique among all tickets sold, then its expected value is P / N, because the probability of it winning is 1 / N and the prize if it wins is P. If the ticket is not unique and shares its numbers with g tickets in total, then its expected value is P / (gN), since the prize would now be split among g people, resulting in a prize of P / g.
To get the expected value of a purchased ticket, sum over all the expected prizes for each ticket and divide by the total number of tickets. To find the sum of these expected prizes, make the observation that if we consider just a single set of g tickets that share the same numbers, then the sum of the expected values for those tickets will always be P / N, regardless of g. This is due to the fact that for a given ticket number with g collisions, each ticket in the same set will have the expected value P / (gN). Since we have g of them, we get a total expected value sum of P / (gN) * g = P / N. Thus, to compute the expected value sum over all tickets, we just have to count the number of distinct ticket numbers and multiply this value by P / N.
In summary, the expected value of each ticket is simply the number of distinct tickets sold multiplied by P / (kN), where k is the number of tickets sold so far. More formally, let Yk denote the number of distinct tickets given k ticket sales and Xk denote the value of a ticket given k ticket sales. In general:

The computation of E[Xk] for the three distributed strategies now can be discussed.
Independent Random Generation
In the case of independent random generation, the number of distinct tickets can be computed analogously to the number of distinct birthdays among a random sample of k people.
This is a well-known problem, but to motivate the solution, we assume we know how to compute the expected number of distinct birthdays for k – 1 people and consider what happens with k people. Let Yk denote the number of distinct birthdays given a group of k people, which is analogous to number of distinct tickets given k ticket sales. For a given person in the group of k people, the probability that this person does not share a birthday with any of the other k – 1 people is
![]()
(assuming that birthdays are uniformly distributed over N possible days), and the expected value can simply be increased by 1 in such a case. In the other scenario, the new person does not contribute to the number of distinct birthdays, so the value does not increase.
This is summarized by the recurrence where N is the number of possible birthdays (N = 365 for the standard birthday problem):
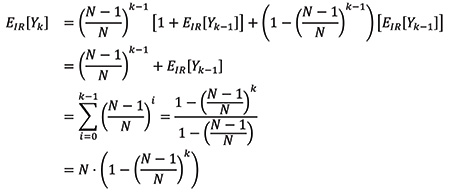
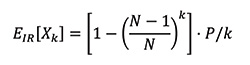
This equation provides the expected number of distinct tickets given k sales so far, where N is the size of the ticket space.
To get the final expected value, multiply by P / (kN) as derived before. Let EIR[Xk] denote the expected value of a ticket given k sales for the independent random generation scheme, and we get:
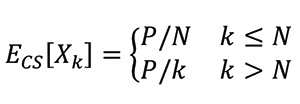
Central Server
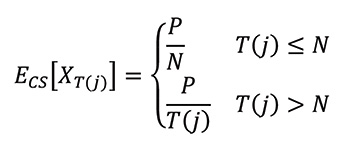
In the case of the central server, each ticket contributes to a unique number. Thus, the expected number of distinct tickets is equal to the number of tickets sold, until N tickets are sold. At that point, the maximum number of distinct tickets have been sold. If ECS[Xk] denotes the expected value of a ticket given k sales for the central server scheme, then:
Deterministic Pairing
The deterministic pairing scheme can be modeled by considering a balls and bins problem with a limited capacity of c for each bin, where the balls represent a ticket and the bins represent the partitions of the ticket space. A ball is discarded whenever it is thrown into a full bin. This captures the fact that the ticket values are recycled only after a partition of the ticket space is all used up. Calculate the total number of balls remaining in the bins after k balls are thrown, and the value of the number of balls remaining represents the number of distinct tickets sold so far. In the worst case, all the balls get thrown into a single bin and k – c balls are discarded, but this is highly unlikely.
To solve this analytically for the case of two bins, c = N / 2. This is equivalent to considering two pairs of stores, m = 4, with an even partition of the ticket space with size N / 2 each. To consider every possible sequence of ball tosses in this setting, represent it as a binary string, in which 0 represents the left bin and 1 represents the right bin, where the jth bit of the string will represent the jth ball thrown for j from 0 to k – 1. Consider all binary strings of length k, and compute the expected value by enumerating over index i, which represents all strings with i zeros and k – i ones for all i from 0 to k.
To compute EDP[Yk}, recall the standard definition for the expected value of random variable Yk with outcome values xi, representing the total number of balls within the two bins, each with probability pi is:
To compute pi, we know that there are (![]() ) possible bit strings with i zeros and k – i ones and (
) possible bit strings with i zeros and k – i ones and (![]() ) / 2k total possible bit strings. Thus, the probability pi equals (
) / 2k total possible bit strings. Thus, the probability pi equals (![]() ) / 2k.
) / 2k.
To compute xi, the total number of balls is simply the number of balls in bin 0 plus the number of balls in bin 1. The number of balls in bin 0 (or bin 1), in the case of k balls that went to bin 0 and k – i balls that went to bin 1, is the minimum between i (or k – i) and N / 2. This reflects the discarding aspect, as a bin cannot have more than N / 2 balls. If we let EDP[Xk] denote the expected value of a ticket given k sales for the deterministic pairing scheme, we get that:
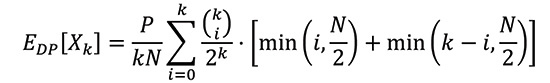
Figure 1 provides both analytic and simulation results for N = 300,000,000, an approximation to the true ticket space size, and shows analytic solutions for the central server and independent random methods and simulation results for the deterministic pairing scheme. Our analysis was only for two pairs of stores; while the technique could be generalized for more stores by considering strings with an alphabet size equal to the number of pairs (instead of binary strings), the exact formula is messy to compute and not very helpful. Instead, we simulate the expected value for the deterministic pairing scheme by randomly selecting stores uniformly and counting the number of distinct tickets that get purchased. This can be repeated many times (we ran 1,000 simulations) to average the values among all the runs and get an estimate for the total expected value of a ticket.
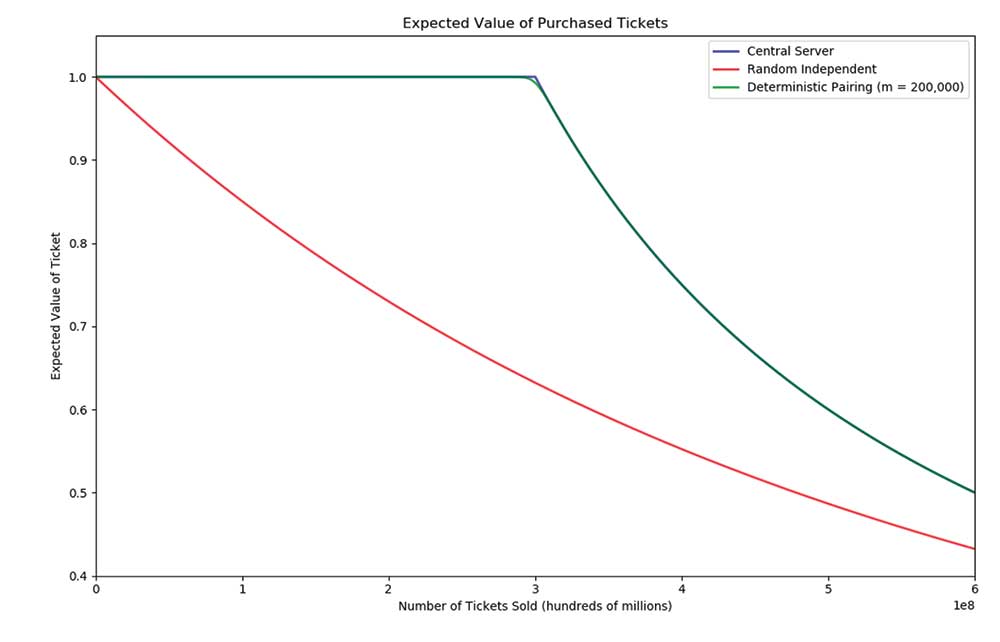
Figure 1. The expected fraction of the pool size claimed over all tickets sold under three models, for N = 300,000,000. The deterministic pairing model approaches the impractical central server model, while strictly dominating independent generation.
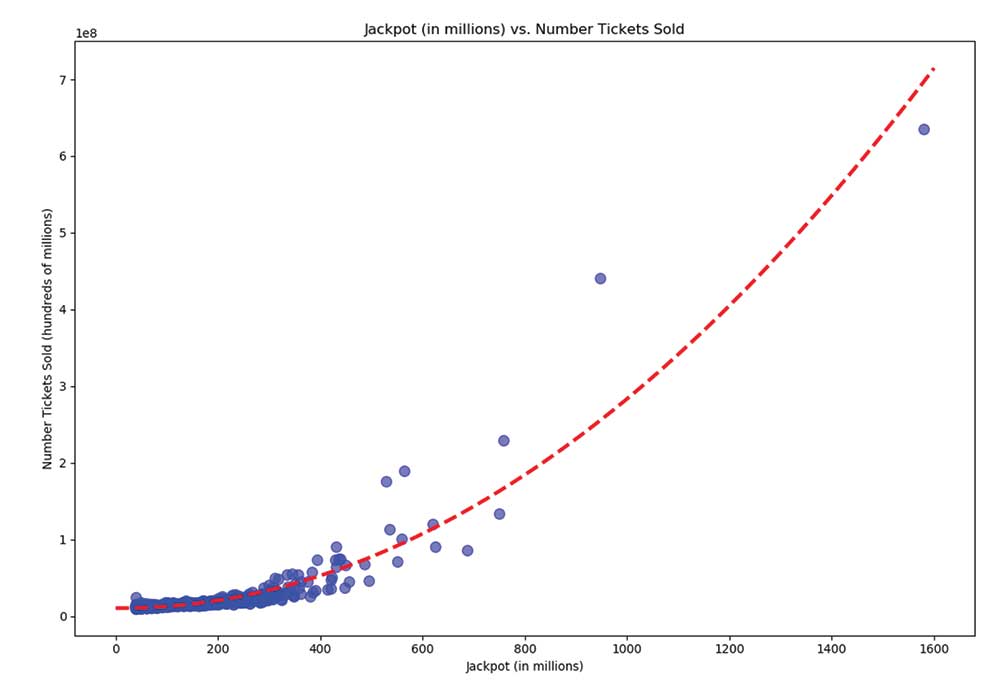
Figure 2. Number of tickets sold as a function of the jackpot.
The central server method, although impractical to implement, maximizes expected value because it guarantees that each ticket in the ticket space is sold at least once each before any combination repeats. The random independent strategy has the worst results of the three methods, because collisions arise relatively quickly. For the deterministic pairing method, Google estimates there are least 200,000 stores that sell lottery tickets, which can be used as an approximate value for m. It does essentially as well as the ideal server model, making it best among practical methods.
An interesting point is the relation between N—the ticket space size—and p—the number of pair of stores. When p = 1, the line exactly matches that of the central server. When p = N, it exactly matches the independent random generation. For values of p in between, there is an interpolation between the two curves, depending on the ratio between p and N.
When to Buy to Maximize the Expected Value of a Ticket
Now it is time to analyze at what jackpot is the expected value of a ticket maximal. To do so, first estimate the number of tickets sold for a given jackpot size by collecting data for lottery ticket sales across the United States for Powerball. Graphing the number of tickets sold as a function of the jackpot shows that the curve is approximately quadratic. Running linear regression will find the best fit quadratic formula. If T(j) is defined to be a function of the jackpot that outputs the number of tickets sold, the finding is:
T(j) ≈ 278.36j2 – 5364.95j + 10582740.74
with j measured in terms of millions of dollars.
Given this model, EIR[XT(j)]—the expected value of a ticket for a given jackpot—can be evaluated, because the expected value of a ticket can be computed for the random independent generation scheme, where k = T(j) is the number of tickets sold and N is the size of the ticket space (the size of the ticket space N is 292,201,338 for Powerball), as

Similarly, for the (ideal) central server approach, ECS[XT(j)] can be evaluated as:
The end result is presented in Figure 3. The cost of each lottery ticket is $2, so we are interested in situations when the expected value of a ticket is greater than $2. For the standard Quick Pick scheme, one can expect to see returns when the jackpot is between $775 million and $1.67 billion. A ticket provides its maximal return when the jackpot is around $1.02 billion, but as the jackpot grows larger and larger, the expected number of tickets to be sold grows quadratically, and hence, the number of collisions overwhelms the returns of the jackpot. It becomes more and more likely that the prize will have to be shared among more people.
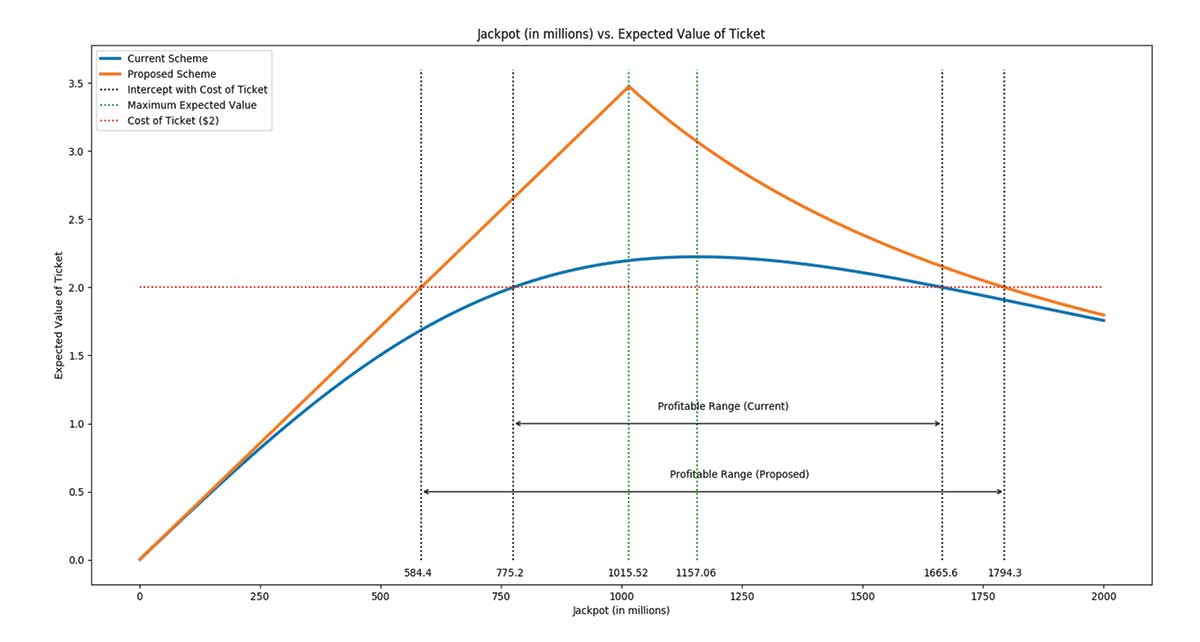
Figure 3. The expected value of a Powerball ticket under the current scheme, Quick Pick/Independent Generation (blue) and proposed Deterministic Pairing (red) sales models, assuming umber of tickets sold grows quadratically with the pool size.
Under our proposed scheme, the range of the jackpot with positive expected returns would be larger—between $584 million and $1.79 billion. As the pool size continues to increase, the expected value converges toward the standard Quick Pick method, but the expected value of our scheme is always larger than that of the standard Quick Pick method, providing greater incentives for smart customers.
Conclusion
We propose an alternative to the standard ticket generation scheme used in popular lotteries; one that generally minimizes collisions and raises the expected value of a ticket. Our deterministic pairing method only requires an agreed setup between the lottery associate and its distributors. No further communication is required during sales. Future work could involve adding some degree of communication to establish how much more this method can be improved upon. Analyzing the impact of non-uniform ticket sales among stores (some more popular than others) is another factor to consider.
What is the catch with our ticket generation procedure? How can we really increase expected value by affecting sales strategy, without any change in the cost of the lottery pool? Over the course of any single lottery, it is clear that we accomplish our goals, but there are certain subtleties in running a sequence of lotteries, where the pools increase whenever there is no winner the previous week. Reducing duplicate entries increases the likelihood that the prize will be claimed each week. Over a sequence of lotteries, our scheme will create fewer large pools resulting from long runs of unsuccessful contests. But no one likes to share, and a lucky winner would be more likely to keep the entire pool under our scheme if they cash in.
Further Reading
Barboianu, C. 2009. The mathematics of lottery: odds, combinations, systems. Lightning Source.
Flajolet, P., and Odlyzko, A.M. 1989. Random mapping statistics. New York, NY: SpringerLink.
Füredi, Z., Székely, G.J., and Zubor, Z. 1996. On the lottery problem. Journal of Combinatorial Designs 4, 5–10.
Jackpot History. 2019.
Keneally, M. 2016. How to Pick Your Powerball Lottery Numbers. ABC News.
Knuth, D.E. 1997. The Art of Computer Programming, Volume 2 (3rd Ed.): Seminumerical Algorithms. Boston, MA: Addison-Wesley Longman Publishing Co., Inc.
Lim, V., Deahl, E., Rubel, L., and Williams, S. 2015. Local Lotto. Hershey, PA: IGI Global.
Lim, V., Rubel, L., Shookhoff, L., Sullivan, M., and Williams, S. 2016. The Lottery Is a Mathematics Powerball. Mathematics Teaching in the Middle School, 21, 526-532.
Rocheleau, M. 2016. More than half of Powerball tickets sold this time will be duplicates. Boston Globe.
Wells, N. 2016. It’s not a good idea to buy Quick Pick. CNBC.
Appendix
Download a PDF of the appendix here.
About the Authors
Allen Kim is a computer science PhD student at Stony Brook University. He received his BS with a computer science major and minors in mathematics and physics from Macaulay Honors College at the City College of New York. He has interests in a wide range of topics, from algorithms to artificial intelligence and cryptography. He enjoys creative puzzles and problem-solving and has experience in competitive programming, ICPC, and mathematics.
Steven Skiena is the Distinguished Teaching Professor of Computer Science and director of the Institute for AI-Driven Discovery and Innovation at Stony Brook University. His research interests include data science, bioinformatics, and algorithms. He is the author of six books, including The Algorithm Design Manual, The Data Science Design Manual, Calculated Bets, and Who’s Bigger: Where Historical Figures Really Rank, and more than 150 technical papers. He received his PhD in computer science from the University of Illinois in 1988. He is a Fellow of the American Association for the Advancement of Science (AAAS), former Fulbright scholar, and recipient of the ONR Young Investigator Award and the IEEE Computer Science and Engineer Teaching Award.


