
There Is No Avoiding WAR

Sabermetrics, the statistical analysis of baseball, has rapidly increased in popularity over the past several decades. While quantitative measurement has been intertwined with baseball for nearly the entire history of the sport, statistics were traditionally limited to what one might see on the back of a baseball card: hits, runs, home runs, runs batted in (RBI), batting average, etc. Sabermetricians have sought to improve upon these basic measurements with more accurate methods of player assessment, such as on-base percentage (OBP), slugging percentage (SLG), and a whole assortment of acronyms describing more advanced metrics (e.g., BABIP, DIPS, FIP, VORP, WHIP). While there have been many important contributions to the field, arguably the most prominent success story in recent years has been wins above replacement (WAR).
WAR is an all-encompassing assessment of a baseball player’s contribution to his team, measured in wins added relative to a hypothetical (and often vaguely defined) “replacement player.” A replacement player is a player whose ability is high enough that he is on the fringes of the major leagues, but not so high that he remains in the major leagues. Players of this talent level are assumed to be readily available.
While predecessors of WAR (like Bill James’s Win Shares) have been around for some time, the modern incarnation of WAR may now reach a broader audience than any sabermetric stat since OBP (see Moneyball). Perhaps the most telling indication of WAR’s permeation of the baseball landscape was the announcement that WAR will appear on the back of Topps baseball cards in 2013.
The motivating question of WAR is both simple and fundamental: How many wins does each player contribute to his team beyond what his likely replacement would have contributed? At some level, the ability to accurately estimate and predict WAR is the magnum opus of sabermetrics.
Not coincidentally, the recent surge in the mainstream popularity of WAR is fueled by these two fundamental simplicities: the question WAR addresses is easy to understand and of obvious relevance and the units of the metric (wins) have inherent intuitive meaning. Thus, the interpretation of WAR is within the grasp of even the most casual baseball fan. Accordingly, sabermetrics should see WAR as one of its greatest achievements: an insightful, easily digestible metric with mainstream crossover appeal that measures the total value of a player in terms of wins.
We might interpret the pointed debate about the 2012 American League MVP vote as a watershed. Even though the sabermetric darling and undisputed WAR leader Mike Trout decisively lost the vote to Triple Crown winner Miguel Cabrera, media giants like ESPN were incapable of reporting on the story without mentioning WAR. Thus, sabermetricians succeeded in pushing WAR into the mainstream debate, to the point where millions of dollars changed hands because of arguments made by non-sabermetricians (e.g., the MVP voters) based on statistical evidence that sabermetricians created. This is a profound accomplishment that, in our opinion, is even more significant than, albeit in the same vein as, Felix Hernandez winning the 2010 AL Cy Young with only 13 wins.
However, for all the successes of WAR, we believe there are still important issues to be resolved, of which many in the general public may not be aware. Specifically, we see at least three substantial problems with the current state of WAR:
- Lack of reproducibility
- Lack of uncertainty
- Lack of a reference implementation of WAR
Estimated WAR values are often referenced in the same manner as easily computable, unambiguous statistics like batting average and earned run average (ERA). If you ask someone to calculate ERA or batting average, there is only one correct answer, and it can be calculated using a simple formula that anyone can look up. With the same data as input, everyone who computes ERA will get the same answer.
WAR, however, is different. There is no one “correct” implementation. In fact, there are many versions of WAR, including three we consider to be the most prominent: fWAR (FanGraphs), rWAR (baseball-reference), WARP (Baseball Prospectus (BP)). While all three of these metrics usually reach similar conclusions about player value, they are far from identical. Even reproducing the figures of any one implementation of WAR is problematic, if not impossible.
Our second concern is a lack of uncertainty when citing WAR, which is often cited as a definitive number. However, there is substantial uncertainty involved when trying to estimate a complicated concept such as how many wins a player contributed to a team. None of the popular implementations of WAR offer any statements of uncertainty, which we believe to be a major issue—especially as quantifying uncertainty is a responsibility at the very heart of statistics.
Finally, we note there is no reference implementation of WAR. There is no fully open-source, fully reproducible reference implementation of WAR that accounts for uncertainty. In an attempt to fill this void, we—along with Shane Jensen of the Wharton School—produced yet another version of WAR, which we refer to as openWAR. OpenWAR, implemented in an R package, is fully open source and reproducible, and our hope for the future is that it will become the reference implementation of WAR that the sabermetric community sorely needs.
Modeling Overview
Currently, all the major implementations of WAR compute measures of performance individually for different aspects of baseball and then add these results to obtain a complete measure of performance. OpenWAR, alternatively, views all aspects of performance (hitting, fielding, pitching, baserunning) as different facets of the same problem, rather than four separate problems.
The basic idea is the same: Estimate the contribution (in runs) each player makes toward batting, baserunning, fielding, and pitching; adjust for ballpark and position; and then add up each player’s contribution. Briefly, every plate appearance results in a change of the state of the game and an associated change in the value of the expected run matrix. We take the view that symmetry implies that every expected run gained by the offense is lost by the defense. Moreover, each offensive and defensive player is responsible for some share of that change in expected runs.
Thus, for each plate appearance, each of the offensive players and each of the defensive players is assigned a value for his runs above average (RAA) depending on his role, but also taking into account the situation, ballpark, batter’s defensive position, and platoon advantage. Simply summing over those RAA values for each role will yield a total RAA value for each player. Once a replacement level is defined—a non-trivial task in itself —the RAA value can then be converted to WAR. (Full modeling details can be found in our paper.) (The expected run matrix associates a run value with each of the 24 base-out combinations possible in an inning.)
Replacement Level
One of the muddier questions that must be answered to quantify WAR is how one defines a replacement level. Unfortunately, a natural definition is elusive. We view the current definition of replacement level as ad hoc and have sought to define a more principled baseline for replacement level in openWAR. Conceptually, a replacement player can be thought of as a AAAA player (i.e., better than a AAA player, but not quite as good as a bona fide major leaguer). Since there are 30 major league teams that each carry 25 players on their active rosters during the season, there are 750 major league baseball players on active rosters for the bulk of the season. (In September, active rosters may expand to as many as 40 players, although few teams carry more than 30 in practice.) This provides a natural limit to the number of major league players, and all others could thus be considered, in some sense, to be replacements.
In openWAR, we assign the top 390 position players (13 position players per team × 30 teams) and the top 360 pitchers (12 pitchers per team × 30 teams) in terms of playing time to be major league players with everyone else being considered replacement level. We argue that this naturally motivated definition of replacement level is preferable to the ad hoc definitions proposed in the current, major implementations of WAR, which appear to be primarily motivated by the desire to have a nice round number (1,000) of total WAR in the league in each season.
We can associate a replacement-level shadow with an actual player by multiplying the average performance across replacement-level players by the number of events for that actual player. The WAR accumulated by each player’s replacement-level shadow provides a meaningful baseline for comparison that is specific to that player.
Converting RAA to WAR
Finally, following a convention that 10 runs is roughly equivalent to one win, RAA values can be translated into WAR values by dividing the difference in RAA between each player and his shadow by 10. Figure 1 illustrates the relationship between a player’s WAR value, his playing time, and the amount of RAA accrued by his replacement shadow and him. Each non-gray point represents an actual baseball player and, for each of these points, there is an associated replacement shadow represented by a gray point with the same horizontal coordinate. The vertical distance between these two points is proportional to that player’s openWAR. The pink points in Figure 1 show the collection of players that have been defined as replacement-level players, and the average of these points is used to define the replacement player shadows. [Note that there are two linear patterns for replacement-level shadows—one for pitchers (closer to the x-axis) and one for position players.]
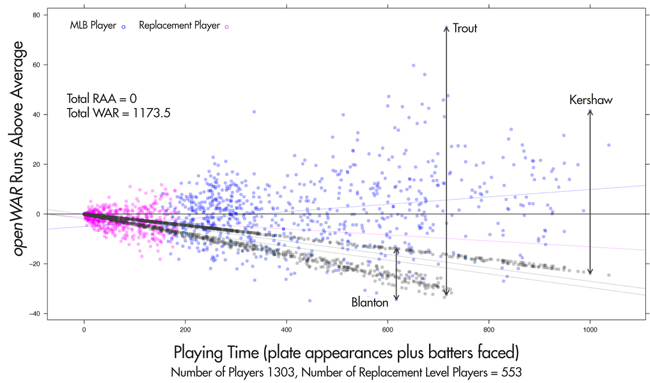
Figure 1. openWAR RAA values for 2013. Mike Trout and Clayton Kershaw were the best position player and pitcher, respectively, while Joe Blanton was the worst player.
Results
Point estimates of WAR based on openWAR are similar to those of the public implementations. In particular, openWAR figures for 2012 and 2013 cor- relate highly with both rWAR (0.88) and fWAR (0.88), although not quite as highly as those two correlate with each other (0.91). Moreover, autocorrelation of openWAR between 2012 and 2013 (0.57) is similar to that of rWAR (0.52) and fWAR (0.60).
Interval estimates for openWAR are constructed by resampling the RAA values for an entire season’s worth of data (comprising 180 thousand observations in each season). In this manner, we preserve any existing correlation structure among players, but meaningfully quantify our uncertainty about our point estimates, allowing for more nuanced conclusions. For example, Figure 2 shows the results of simulating the entire 2012 season 3,500 times. Although Trout’s point estimate for openWAR was 1.1 runs higher than Cabrera’s, Cabrera posted a higher openWAR than Trout in nearly 32% of these simulated seasons.
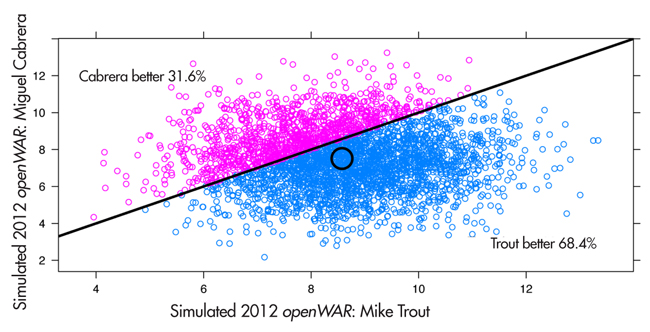
Figure 2. Joint distribution of openWAR for Mike Trout vs. Miguel Cabrera, 2012. We note that in about 68% of 3,500 simulated seasons, Trout produced a higher WAR than Cabrera.
Thus, while the results of these simulations confirm that sabermetricians were probably right to bemoan Cabrera’s MVP selection over Trout, they more importantly give us a way to talk sensibly about the likelihood that Trout was actually a better player.
Results for the top 10 players in 2013 according to both fWAR and openWAR appear in Table 1. We note that there is considerable overlap between the two lists, with six players appearing on both lists, and—perhaps most importantly—agreement that Trout played about two wins better than the next best player. Closer inspection into the components of openWAR, which are shown in Tables 2 and 3, reveals that while openWAR agrees Cabrera is the worst fielder in baseball and that Manny Machado and Carlos Gomez are among the best, the estimates of their value in terms of RAA are more modest than those made by fWAR. (Cabrera was rated as −16.8 runs above average by FanGraphs, while Machado and Gomez ranked first and fourth, respectively, at 31.2 and 24.4 RAA). Similar analysis for baserunners again shows agreement, with Jacoby Ellsbury and Elvis Andrus near the top and Victor Martinez and Cabrera near the bottom.
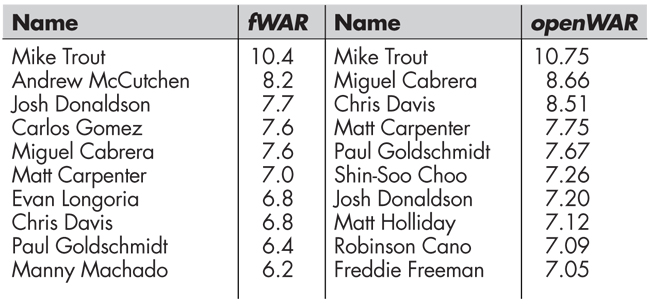
Table 1—2013 WAR Leaders, fWAR (left) and openWAR (right)
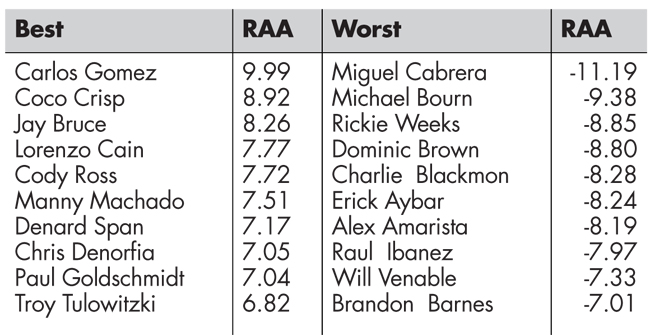
Table 2—2013 Fielding RAA Leaders
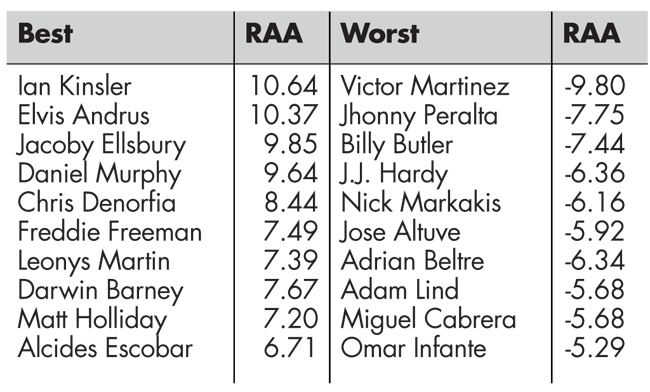
Table 3—2013 Baserunning RAA Leaders
Discussion
At this point, there are many things openWAR does not pick up on, and there are likely to be imperfections that can be ironed out. At this stage, our emphasis is not solely on accuracy (although we believe we have made reasonable modeling choices based on the data we have), but rather on reproducibility.
Our goal is to engage the sabermetric and larger statistical community in a fruitful discussion about how WAR is computed and how it should be interpreted. We’ve outlined what we believe to be major problems with the latter and put forth a proposal for the former, but it is only through a communal effort that we can solidify WAR’s place in baseball with an open, reproducible reference implementation with built-in uncertainty estimates.
Further Reading
Baumer, Benjamin S., Shane T. Jensen, and Gregory J. Matthews. 2013. openWAR: An Open Source System for Evaluating Overall Player Performance in Major League Baseball. arXiv:1312.7158.
Baumer, Benjamin S., and Gregory J. Matthews. 2013. openWAR: An Open Source System for Overall Player Performance in Major League Baseball.
About the Author
Shane Jensen is an associate professor of statistics in the Wharton School at the University of Pennsylvania, where he has been teaching since completing his PhD at Harvard University in 2004. Jensen has published more than 40 academic papers in statistical methodology for a variety of applied areas, including molecular biology, psychology, and sports. He maintains an active research program in developing sophisticated statistical models for the evaluation of player performance in baseball and hockey.


