
A Celebration of Data

This quarter’s column would more aptly be called “Taking a Chance Outside the Classroom,” since we’ll be talking about an activity that takes learning beyond the space/time/grading constraints of the usual classroom. The activity is called DataFest. DataFest supplements classroom approaches by cutting loose these constraints to allow Big Data, big team work, big creativity, and big fun!
In a nutshell, DataFest is an annual 48-hour competition in which teams of undergraduate students work to reveal insights into a rich and complex data set. The data set is kept secret until the start of the competition, so students have no means to prep. Teams compete in front of a panel of judges for prizes in categories ranging across Best Insight, Best Visualization, and Best Use of External Data.
The department of statistics at the University of California at Los Angeles (UCLA) held the first DataFest in 2011. Duke partnered in 2012. In 2013, UCLA partnered with Pomona College, the University of California at Riverside, Cal State Long Beach, and the University of Southern California, while Duke partnered with The University of North Carolina and North Carolina State. More than 150 students participated in 2013. Each year, the data and the challenge is different, but the common theme is making sense of big data—larger and more complex than what undergraduate students are used to seeing in class.
Data for the kickoff, DataFest 2011, was provided by the Los Angeles Police Department (LAPD) and included data records for every arrest in Los Angeles from 2005–2010. That’s almost 10 million police reports. Reports filed by the arresting officer include details about the suspect and the nature of the alleged crime. The LAPD had geo-tagged the reports wherever possible to indicate the location of the arrest. To bring realism, Lieutenant Thomas Zak, officer-in-charge of the LAPD Strategic Crime Analysis Section, presented the data to students and challenged teams to suggest policy changes that could improve public safety.
DataFest 2012 took students global and into the world of microfinance. Kiva.org, a nonprofit organization that brokers micro-loans internationally, provided the data. Any visitors to the website can invest small amounts of money to entrepreneurs in developing countries. Lenders can re-invest the money when the loan is repaid. Records are kept on every transaction, and Kiva.org makes these available via an API. These data were organized for students in various files: one consisting of almost 100,000 loans, another containing information on 15,000 lenders who made these loans, and yet another on Kiva’s field partners (microfinance organizations who are responsible for administering Kiva’s loans). The data and the challenge were presented by Kiva engineer Noah Balmer. The challenge was very broad: Kiva wished to know what outsiders would find interesting and useful, and so invited the teams to discover any insight or association they felt meaningful.
Dating, or more precisely online dating, was the theme of DataFest2013, with data provided by eHarmony. Vaclav Petricek, the senior data scientist at eHarmony presented the data set, which consisted of roughly one million “user-candidate” pairs as suggested by the eHarmony matching algorithm, and more than 200 variables, including information about ideal characteristics in a partner, how important these characteristics are, “words friends would use to describe you,” etc., as well as a measure of success of the suggested match: whether the matched pairs contacted each other.
Each year, the data set and the challenge are presented to the students early Friday evening, and students spend the first hours generating a research question and developing a plan of attack for the weekend. Then comes roughly 36 hours of exploring, computing, puzzle solving, learning, and much trial and error as students move down paths, putting to use what they already know and learning on the fly tools they need but don’t yet know. Students from engineering, math, computer science, statistics, and social sciences bring different strengths and toolkits. For example, a team of statistics students, Team ChexMix, explored the eHarmony data set through network analysis and found that users cluster into communities based on demographic characteristics such as education level and ethnicity (see Figure 1).

Figure 1. DataFest 2013 Duke/UNC/NCSU (top) and UCLA/Pomona/UCR/CSLB/USC (bottom)
Meanwhile, Team Statisti-nots, comprised mostly of economics students, measured the success of users in the eHarmony space with two metrics that they called active and passive conversion. They defined passive conversion as the willingness to respond to people reaching out to the user, and active conversion as the success rate of one’s own desired interactions. They found that as income increases, active conversion increases, meaning that the higher the income, the more successful the users are when contacting others. On the other hand, as income increases, passive conversion decreases, meaning that the user will be less likely to reply to those who have contacts them (see Figure 2).
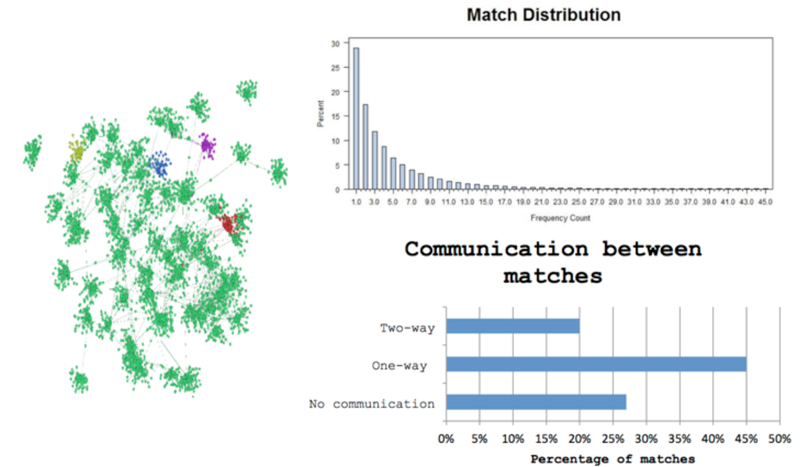
Figure 2. Network analysis of eHarmony data by Team ChexMix
Unlike grades in the classroom, prizes are for the most part out of consciousness during the competition. While prizes do provide some external motivation for students to do well, students are there because they enjoy the challenge and want to learn (and maybe also for the free food).
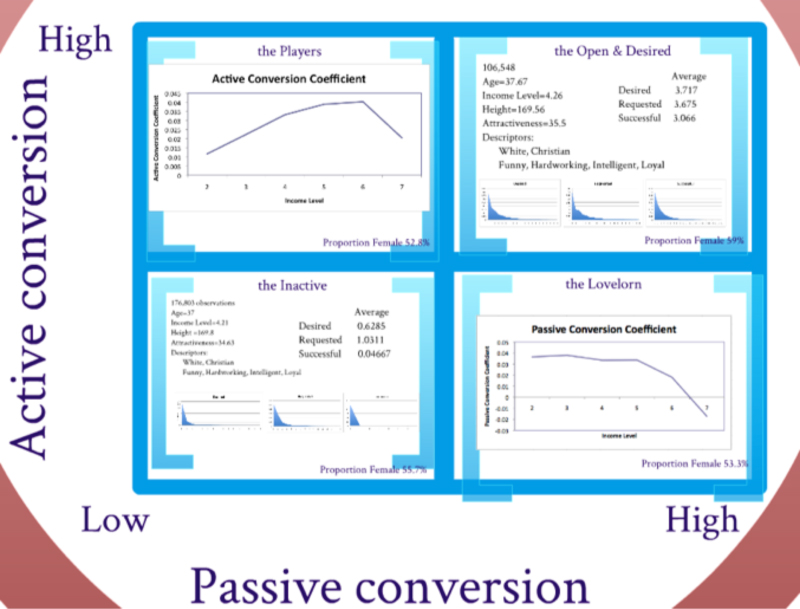
Figure 3. Active and passive conversion rates by Team Statisti-nots
DataFest allows for a unique collaboration between academics and industry and students are presented real-world data that is of current interest by a company/organization and given the relevant context. This is a great experience for students as it exposes them to the use of data outside the academic setting as well as giving them a chance to meet people who work with data in such settings. This can be supplemented by integrating DataFest within the local data analytic community. In addition to having faculty and graduate students from host universities visit the event and interact with the students, involving visitors from the local chapter of the American Statistical Association, the R Users Group, etc. provides further opportunities for networking and community building.
Aside from being fun for the students, and a good way to promote the discipline, DataFest serves multiple important curricular purposes. It brings students across levels of the curriculum together, blending first and second year students with juniors and seniors. Participation from various majors also fosters interdisciplinarity. DataFest fills gaps in the curriculum that are otherwise difficult or impossible to discern based on traditional classroom experiences and assessments. Here are a few of our observations:
- Textbook exercises provide a great deal of structure, while real-world data and real-world problemsolving does not. This leaves students vacillating early in the competition. Generating interesting questions from a large complex data set is not an easy task for students. Those that have a few statistics courses under their belt go straight into jackhammering (i.e., modeling without first taking the time to familiarize themselves with the data via visualizations or other exploratory analysis tools). The Kiva data set presented particular challenges on this front since most students were not familiar with micro lending and didn’t know where to start looking. However even when data was from a familiar topic, like dating, developing meaningful research questions was difficult for most.
- Most students are not familiar with methods for working with complex data structures, such as databases or multiway relationships between observations. For example, in the Kiva data set, each lender could contribute to multiple loans, and each loan could be funded by multiple lenders. Kiva stores these data in an XML database; however, most statistics students do not have the computational background to work with databases. In most statistics curricula, students receive data as a flat file that is cherry picked to work with a particular method. While this expedites introduction of statistical methods, given the vast amount of data generated and stored daily, statisticians must be able to work with various data structures and be able to work in teams with computer scientists. How do we make room for courses that address these issues in the current undergraduate curriculum?
- Students are quick to apply methods of traditional inference such as intervals and tests of parameters, but these tools are not the most useful for finding a model that “explains” what makes a couple a good match or evaluating the accuracy of predictions crime predictions. Classroom exercises train students for traditional inference, but in context of the types of data students are provided for DataFest, this is of little interest, while issues involving model fitting and prediction are of greater concern.
- Students wrestle with the ability to describe data that varies spatially and temporally, such as the geo-tagged and time-stamped crime and micro-lending data. Should time series and spatial analysis be part of core undergraduate statistics education?
- A successful DataFest requires some intangible features. Data should be inviting so that students can participate constructively regardless of their level or background. In addition, the event should be fun. Between sleep deprivation and trying to also not fall behind on coursework over the weekend, DataFest can be a tiring experience. Food and intermittent raffling of small prizes goes a long way in keeping spirits high over the weekend. This certainly adds to the cost of hosting the event. Soliciting sponsorship can help alleviate the financial burden of hosting the event.
- DataFest is a truly data-centric educational tool that allows students to learn by doing. It de-emphasized the search for the “right” answer hence the learning is much more concrete than in graded classroom activities. It also fosters teamwork and collaboration. So, if you are interested hosting DataFest at your institution, or would like to join one of the existing DataFests you can find more information about the events at stat.duke.edu/datafest and at datafest.stat.ucla.edu.
About the Authors
Mine Çetinkaya-Rundel is an assistant professor of the practice at Duke University. Her research interests include statistics pedagogy, spatial statistics, small-area estimation, and survey and public health data. She is a co-author of OpenIntro Statistics and a contributing member of the OpenIntro project, whose mission is to make educational products that are open-licensed, transparent, and help lower barriers to education.
Dalene Stangl is professor of the practice of statistical science and public policy and associate chair of the department of statistical science at Duke University in North Carolina. She has served in editorial positions for the Journal of the American Statistical Association, The American Statistician, and Bayesian Analysis and has co-edited two books with Donald Berry, Bayesian Biostatistics and Meta-Analysis in Medicine and Health Policy. Her primary interest is promoting Bayesian ideas in the reform of statistics education and statistical practice.


