
Police Officers Killed in the Line of Duty: A Correspondence Analysis of Circumstances and Time of Day

Police officers are the most-visible representatives of the U.S. legal system. They are close to the community and most responsible for direct intervention in cases of criminal activity. An attack against a police officer is an attack against the legal system, but the very nature of their responsibilities puts them in danger of attack. In 2019, 48 police officers were feloniously killed (FBI 2019 statistics on Law Enforcement Killed in the Line of Duty).
The data for this analysis came from the Federal Bureau of Investigation (FBI) Law Enforcement Officers Killed and Assaulted (LEOKA) program, which contains information about felonious killings of police officers in the line of duty from 1960–2017 (58 years). These reports are collected from all 50 states and entered into a national database. By collecting and analyzing this information, the FBI hopes to reduce the number of future deaths.
The purpose of this research is to determine whether certain types of police activities are more dangerous at specific times of the day. The focus is on the relationships between two variables: the time of day when officers are killed and the activity in which they were involved at the time of the fatal attack.
Data
The LEOKA database contains information about officers killed in the line of duty. Variables include gender, age, rank, height, race, years of law enforcement experience, amount of training, location of injury, etc. The database also contains information concerning the environment and circumstances surrounding an event, such as type of patrol (one- or two-person), type of weapon used, weather conditions, use of protective body armor, time of day, etc.
To minimize confounding that may result from differences in police officers’ duties, this analysis focuses only on the felonious killings of police officers with front line officer’s rank. This rank includes police officers, patrol officers, deputy sheriffs, etc.
Officers excluded from this study include fire marshals, game wardens, park rangers, conservation environment officers, wildlife officers, federal officers, etc. Since there are only a handful of female officers in the database (2.37 %), they are also excluded to make the subgroup database as homogeneous as possible. Observations with missing values were also deleted. After these exclusions, the database contained 3,216 police officers feloniously killed while on duty.
This analysis is not designed to examine changes in death rates over time, so the 58 years of data are combined into a single database. Aggregating the data in this way has several important advantages.
- First, it minimizes problems resulting from non-reporting. While some officers’ deaths may not be reported, the LEOKA database appears to be the most-complete national database of police officers’ deaths in the U.S.
- Second, aggregated data sets enlarge the database and tend to stabilize year-to-year reporting inconsistencies. True relationships are more likely to emerge from large, stable databases.
- Finally, aggregated data are more likely to provide a sufficient number of cases for the detailed analysis necessary to identify patterns and relationships.
Not all police officers die on the same day they are attacked. Table 1 shows that just over 87 percent of officers die on the day of the attack, another 6.4 percent die the next day, and the percent who die decreases with each subsequent day. The cumulative percent column shows that 95 percent of officers die within two days of their attack. The date of the attack was used for all deaths.
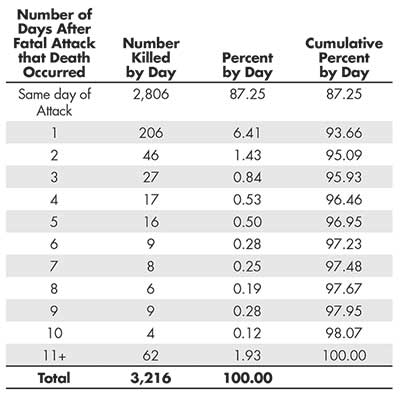
Table 1—Actual Day of Death of Police Officers Following Fatal Attacks
Measures
This study uses two variables: the activities of the police when they were feloniously killed (circumstances) and the time of day the officers were attacked.
Circumstances
This study combines all circumstances into seven major groupings. Most of the categories are self-identifying, but each includes several other categories named in the FBI police officers killed database:
1. Attempting arrest (attempting arrest, attempting other arrest)
2. Ambush (ambush, ambush-entrapment, ambush-unprovoked attack, ambush-answering call for service)
3. Crime in progress (crime in progress, burglary in progress, robbery in progress)
4. Disturbance call (disturbance call, domestic call, disturbance-civil disorder)
5. Handling prisoners (handling prisoners, transporting prisoners, custody of prisoners, mentally deranged prisoners)
6. Investigating suspicious persons (investigating suspicious persons, investigating suspicious circumstances, investigating suspicious activity)
7. Traffic enforcement (traffic pursuit, traffic stop, traffic violation, traffic stop-felony, traffic stops-unknown)
Time of day
The FBI uses a 24-hour clock to record the time of day when a police officer is attacked. For this study, the data were grouped into six four-hour time segments: midnight–4 a.m., 4 a.m.–8 a.m., 8 a.m.–noon, noon–4 p.m., 4 p.m.–8 p.m., and 8 p.m.–midnight.
Figure 1 is a circular bar chart of the percent of officers killed by time of day in two-hour time segments. This shows a pattern that might lead to a conclusion that the safest work time for police officers is early morning between 4 a.m. and 8 a.m. Interpreting this trend correctly, however, is not possible without knowing the number of all police officers on duty for each two-hour time segment. If that information were available, death rates per officers on duty could be calculated, and the bars would have more meaning.
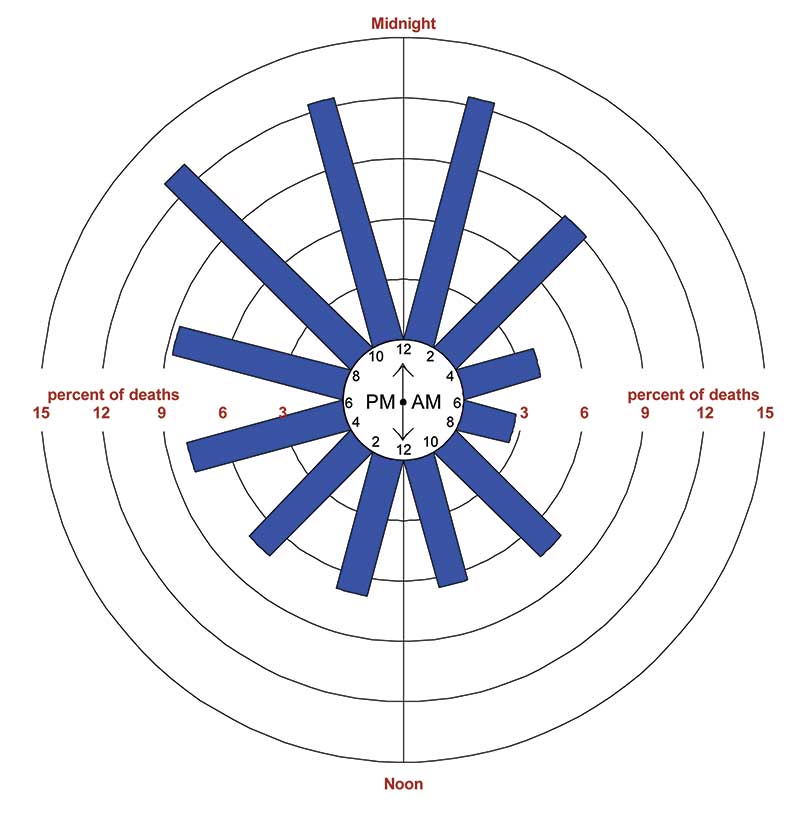
Figure 1. Circular bar chart of percent of police officers killed, displayed in two-hour time increments.
Statistical Analysis
This study uses correspondence analysis to examine relationships between the circumstances surrounding the killing of a police officer and the time of day the officer was killed. Correspondence analysis is a sophisticated multivariate method that is ideal for testing independence between categorical variables in large contingency tables. The correspondence plot allows for a visual representation of the dimensions underlying the relationships.
Similar to the factors calculated by principal component analysis used for continuous data, using correspondence analysis for categorical data calculates the row and column coordinates. However, correspondence analysis partitions the chi-square value that tests the hypothesis of independence, while principal component analysis partitions the total variance. An advantage of correspondence analysis is the indication of how variables are related, not simply whether a relationship exists.
To perform the correspondence analysis, a two-way table uses the two categorial variables (circumstance and time of day). Table 2 contains these counts from the police officers killed database. This study focuses not on frequencies but on the relationships between the two variables.
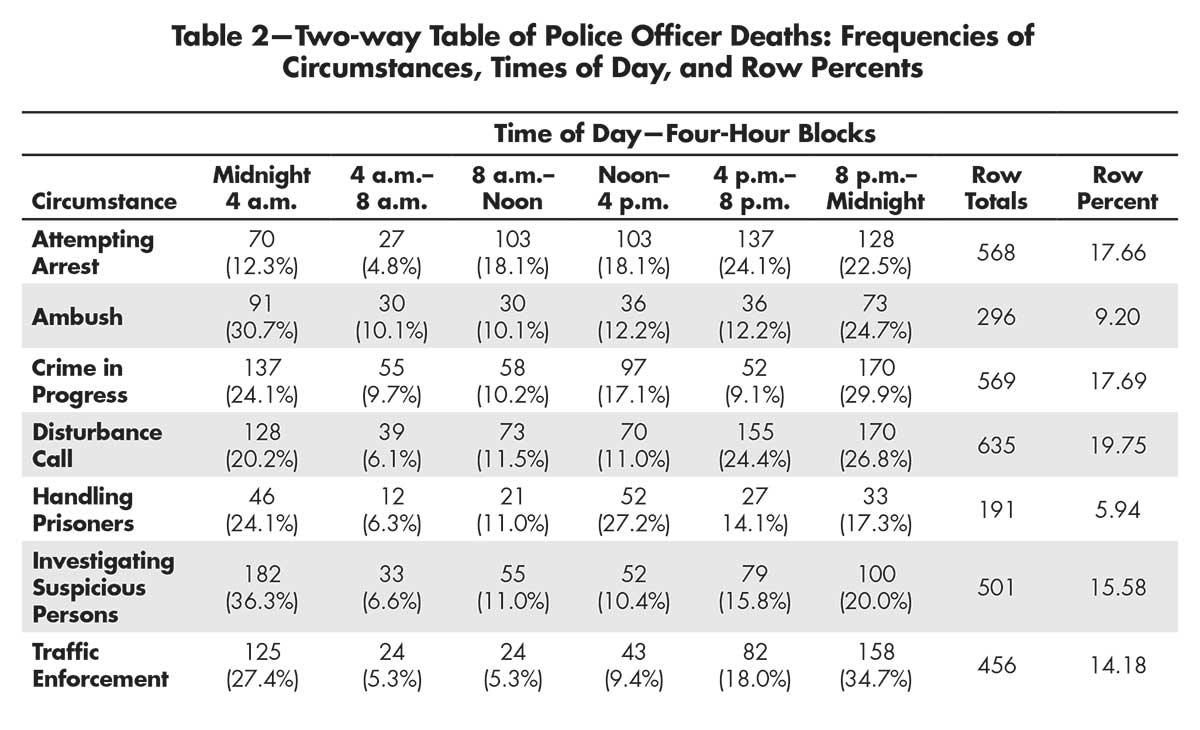
Table 2—Two-way Table of Police Officer Deaths: Frequencies of Circumstances, Times of Day, and Row Percents
The relationship between the rows and columns of Table 2 was examined by computing the Pearson’s chi-square to determine whether the hypothesis of independence should be rejected (χ2 = 274.576, df = 30, p < 0.0001). Results indicate that the circumstances at the time police officers were killed vary significantly with the time of day.
Correspondence analysis summarizes the variation of the residuals into specific dimensions (Table 3). The results of the first two dimensions account for 78.59 percent of the overall chi-square value. With more than 78 percent of the chi-square value, a two-dimensional correspondence plot is sufficient to uncover significant associations.

Table 3—Results of the Correspondence Analysis
Results
The correspondence plot (Figure 2) shows that there are clear separations among the times of day as well as among the different circumstances. Dimension 1 accounts for 62.54 percent of the chi-square value and separates 8 a.m. to 8 p.m. from 8 p.m. to 8 a.m. Dimension 2 accounts for 32.66 percent of the chi-square value and separates 4 p.m. to 4 a.m. from 4 a.m. to 4 p.m.
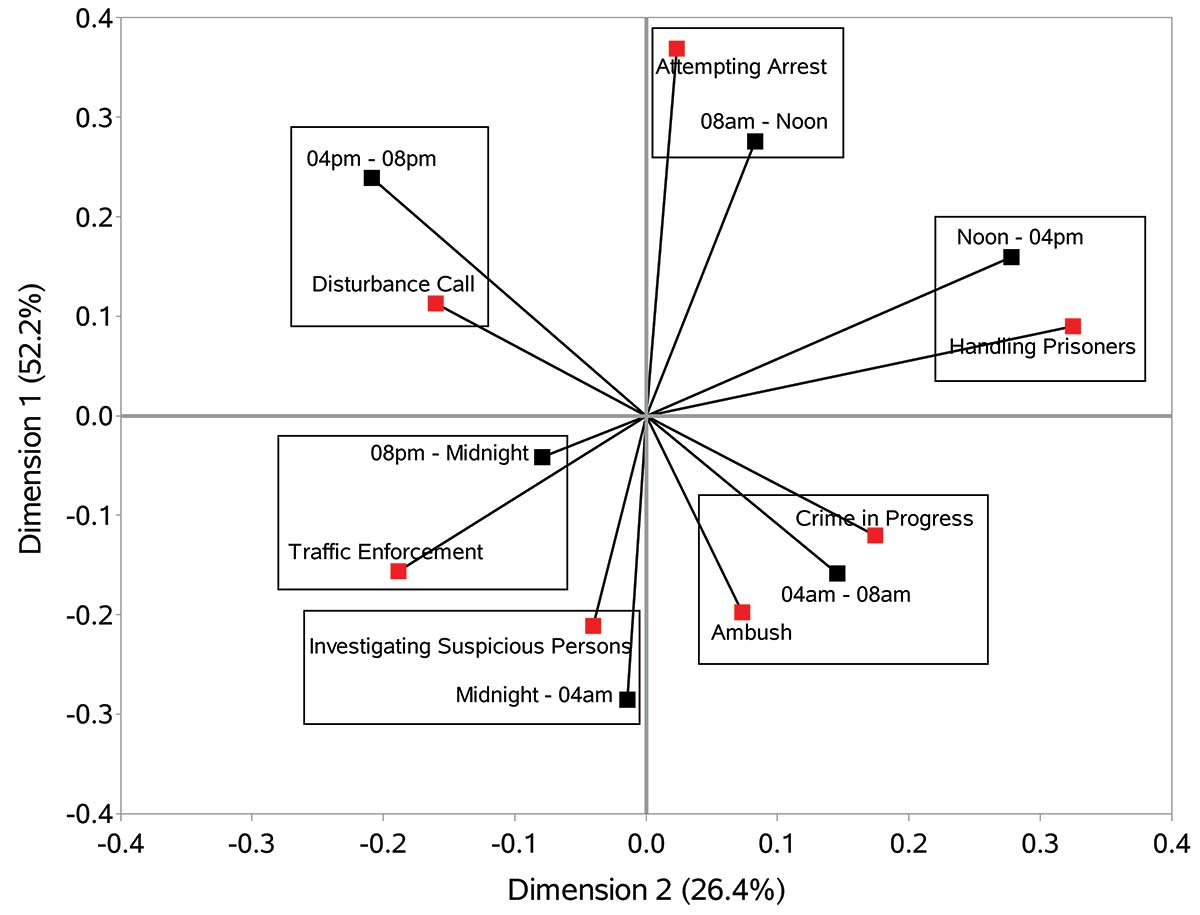
Figure 2. Plot of first two dimensions of correspondence analysis with frames showing which circumstance and times of day are most associated.
Figure 2 also shows the circumstances associated with each time of day. Rows and columns that have similar profiles will plot close to each other and fall in the same direction away from the point of origin.
The vector lines from the origin correlate the most when the angles are small. The larger the angle between the vectors, the smaller the correlation.
An angle of 90 degrees has 0 correlation. For example, attempting arrest is separated from handling prisoners by almost 90 degrees, indicating that those circumstances are nearly uncorrelated. Angles greater than 90 degrees are negatively correlated. Frames have been added to Figure 2 to show which circumstances and times of day are most associated.
Crime in Progress and Ambush show a relatively close correlation, and both are associated with the 4 a.m. to 8 a.m. time period. One possible explanation for this relationship is that both circumstances can occur in the same incident. When police respond to a crime-in-progress call, the suspect is usually still on the scene. The suspect may kill the officer impulsively or during an arrest, or may hide and ambush the police when they arrive or during their investigation.
Discussion
Although all circumstances occur in all of the time groups, correspondence analysis identifies the circumstance most associated with a particular timespan. Figure 3 summarizes the circumstance and time of day on a 24-hour circular chart.
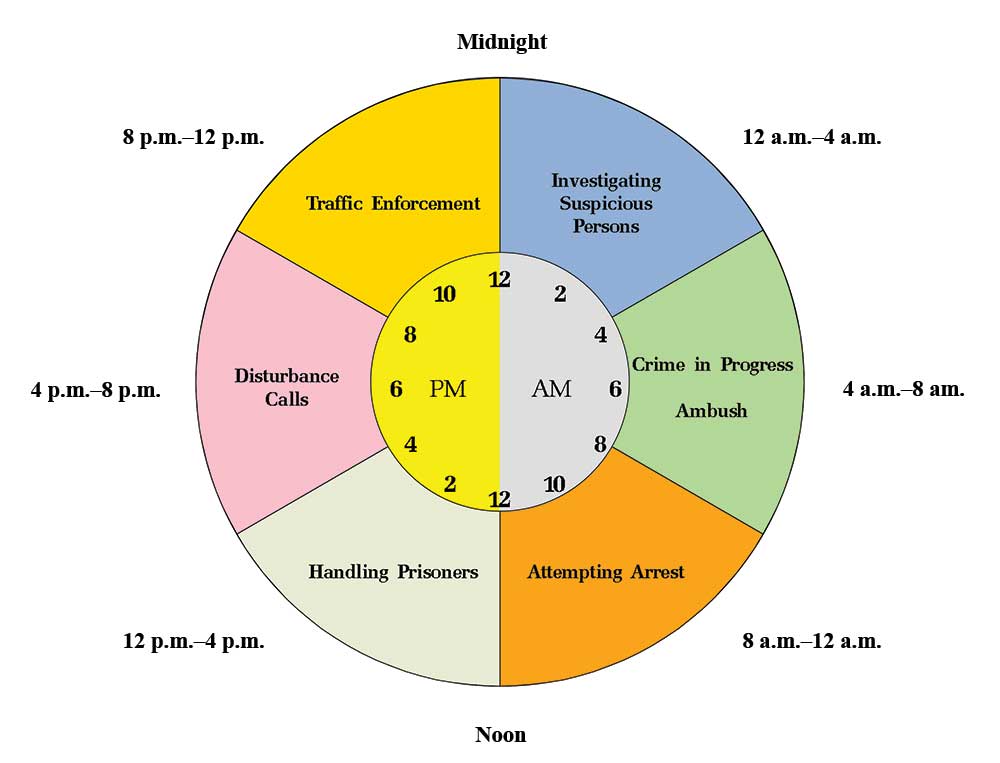
Figure 3. Summary of the circumstances and times of day on 24-hour circular chart.
Investigating Suspicious Persons/Midnight–4 a.m.: Suspicious people may often be identified by their behavior. They may exhibit nervousness or signs of mental discomfort; be ill-at-ease or sweating; or show an unusual interest in a building or facility. They may also wear clothing that is oversized or loose-fitting. When suspicious activities occur after midnight, investigating such incidents may pose a greater danger for police officers than at other times.
Crime in Progress/4 a.m.–8 a.m.: When the police receive a call that a crime is in progress, officers are sent to the scene. Crime-in-progress calls are infrequent, but they are much more dangerous than “see the lady” calls because the suspect is still on the scene. The officers may know very little about the suspect(s) or whether weapons are present. Danger is magnified when these calls occur very late at night.
Ambush/4 a.m.–8 a.m.: An ambush on a police officer is a surprise attack by a person or people lying in wait, possibly in a concealed position. This can happen when the officer is not engaged in police activity and the attack is unprovoked, or when the officer is investigating a suspicious person or activity. Ambush danger is heightened during the early morning hours when visibility is low.
Attempting Arrest/8 a.m.–12 noon: Many arrests are made without a warrant when a crime is committed in an officer’s presence or when the officer has probable cause to believe that a crime has been committed. However, officers find it wise to seek an arrest warrant when possible. Most arrest warrants are handled during day-shift hours and may be scheduled in the morning when the location of the suspect is known. When a police officer attempts an arrest, there is always the danger that the suspect will resist.
Handling Prisoners/12 noon–4 p.m.: Handling prisoners occurs after making an arrest, when transporting prisoners from the jail to court for arraignment or trial, while moving sick or injured prisoners to a medical facility, etc. These types of moves happen many times a day and can become routine. Unfortunately, they may also provide a non-incarcerated prisoner the opportunity to take advantage of the accompanying officer(s). This can put the officer in extreme danger. Most handling activities occur during regular work hours.
Disturbance Calls/4 p.m.–8 p.m.: According to Department of Justice data, disturbance calls are the most-frequent and most-dangerous calls for responding officers. Domestic violence calls can be particularly volatile and dangerous. Anyone who is present at such a scene can pose a threat to responders. The time of day for disturbance calls corresponds with people getting off work and families coming together for the evening.
Traffic Enforcement/8 p.m.–12 midnight: Traffic enforcement is a risky and complex duty. In many cases, a traffic stop is the only contact citizens will have with the police. A number of threatening elements can arise in a traffic stop, and it is difficult for an officer to mitigate all of them.
People become agitated or nervous when they are pulled over by the police. With emotions running high, traffic stops can be very dangerous for the officers, who usually do not know who is inside as they approach a vehicle.
Traffic pursuits are so inherently dangerous that some police departments have issued a “no pursuit” policy. Along with high rates of speed, other factors that make traffic pursuits extremely dangerous include poor weather conditions, concern for safety, being aware of other officers engaged in the pursuit, etc. These issues are compounded when traffic enforcement occurs at night and visibility is reduced.
The correspondence analysis clearly identifies the circumstances that are associated with the time of day that officers are most often killed feloniously in the line of duty. One limitation of this study is the lack of ability to calculate a death rate for each circumstance within its associated time of day because the total number of officers on duty is not included in the Police Officers Killed database. For example, ambush is most associated with the 4 a.m.–8 a.m. time period, but it is not known whether this association also indicates a greater risk compared to ambushes in other time periods.
Conclusion
Police officers constantly face the unknown and the unpredictable. This uncertainty makes policing a dangerous profession. The phrase “business as usual” does not apply to police work. This research can be of significant help to police officers who, with very little information, must make split-second decisions about situations and circumstances that threaten their safety. By using correspondence analysis, this study reveals associations between particular police activities and the times of day when officers are killed. It is hoped that these outcomes further the understanding and ability to address this most-difficult problem.
Further Reading
Allen, T. and Buckner, G. 1997. A graphical approach to analyzing relationships between offenders and victims using supplementary homicide reports. Homicide Studies 1(2):129–140.
Allen, T., Thom, A., and Buckner, G. 2010. Infant Homicides: An Examination Using Multiple Correspondence Analysis. CHANCE 23(4):29–34.
Federal Bureau of Investigation (1960–2017). Law Enforcement Officers Killed and Assaulted (LEOKA) Program. Crime Statistics Management Unit FBI, CJIS Division. Unpublished data.
Greenacre, M.J. 1993. Correspondence Analysis in Practice. New York: Academic Press.
Greenacre, M.J., and Blasius, J. 1994. Correspondence Analysis in the Social Sciences. New York: Academic Press.
About the Author
Terry Allen is an adjunct assistant professor at Weber State University, where he teaches courses in statistics, research methods, deviant behavior and social control, and criminology. He has been a research analyst with the Utah Department of Public Safety and the Utah Attorney General’s Office; and is the former director of the Utah Medicaid Fraud Statistical Unit. He has an MS degree in statistics and a PhD in sociology. His research focus is mathematical criminology.


