
Re-Reading Deming’s 14 Points in the Era of Data Science: 14 Questions for Vibrant Management of Statistical Information Systems

Note: This article is based on the Deming Lecture given by the author at JSM 2018. It has been edited for CHANCE style and space considerations. The recording is available at YouTube (bit.ly/3lBSuyQ). In addition, see https://chance.amstat.org/?p=16200 for additional supplementary questions related to statistical information production systems.
Learning from the Past for Modernized Statistical Information Production
We are working in an era of vibrant development and intellectual ferment in statistics and data science. Of special note are the rapidly changing capabilities and environment for the production and use of statistical information managed on a public-stewardship basis. These changes present extraordinary opportunities—and challenges—in the development and management of the resulting statistical systems.
As we explore these opportunities and challenges, it is important to understand as much as possible about the emerging environment, from many different perspectives. Some of those perspectives center on specific frontiers (bit.ly/3S1lbRQ) of methodology, technology, and empirical results, while other perspectives draw on conceptual frameworks and insights developed from a rich ecosystem of previous experiences.
To that end, this article reconsiders the “14 Points” on management that were developed by W. Edwards Deming and suggests that these points reflect fundamental concepts and principles that can offer important insights for the statistical community as it responds to these opportunities and challenges related to improvement of the quality, integrity, and societal value of statistical information.
W. Edwards Deming (1900–1993) and His 14 Points on Management
During the latter part of the 20th century, W. Edwards Deming was broadly recognized as a leading figure in the application of statistical methods to the measurement and management of quality. He described his approach (bit.ly/3lBSuyQ) as centered on:
“work that offers opportunity to create new statistical methods, or to use existing methods … to improve … research; or to acquire new knowledge …; or to improve efficiency, uniformity, quality service, and performance of product; or to achieve smoother operation and more effective administration and management in industry and government.”
In his landmark 1986 book, Out of the Crisis, Deming elaborated on some parts of his approach through a succinct list of “14 Points for Management.” In re-reading those materials, two features seem especially striking.
First, Deming’s 14 Points reflect a profoundly humane and nuanced perspective on the management of large and complex organizations, and related controversies (see Supplemental Material) regarding standardization and regimentation of production processes and work assignments, viewed through the lens of mid-20th-century statistical concepts and practice, and considered largely (but not entirely) in the context of large-scale manufacturing of standardized products. Of special note are the concepts of statistical variability, statistical control, and practical improvements in the underlying systems; the complex interface between those concepts and practical management; and the fundamental importance of the human element throughout the work environment. These points, and related discussion, naturally do not cover all aspects of organizational management, but do provide many thoughtful and provocative insights.
Second, his expository style incorporates a fascinating mixture of very broad generalities (e.g., the emphasis on continuous improvement in Point 5, and on leadership in Point 7) and rather specific conclusions (e.g., objections to inspection in Point 3, and to numerical quotas in Point 11). However, reading past those stylistic features reveals that these 14 points, when taken as a whole, touch on a substantial body of underlying issues that warrant careful consideration in a wide range of management settings that require realistic approaches to multiple dimensions of uncertainty and constraints, and related trade-offs.
The remainder of this article explores the application of these ideas to systems and organizations designed for one area of special interest to the statistical and data science community: the production and dissemination of high-quality public-stewardship statistical information.
We begin with brief schematic descriptions of some features of these systems. Those descriptions lead to a list of 14 general questions that frame core issues underlying Deming’s “14 Points.” These issues are in the form of questions to emphasize that related practical decisions and actions generally are contingent on important design and environmental factors, so they do not have “one size fits all” definitive answers and thus, often require in-depth methodological and empirical research.
In parallel with Deming’s mixture of general statements and specific conclusions, the questions in the printed version of this article center on fairly general concepts. The additional online material complements these 14 general questions with several sub-questions focused on specific aspects of statistical information production.
Many of these sub-questions align with particular statistical and data science features of the above-mentioned schematic models, and thus reinforce the contingent nature of practical design and operational decisions, as well as the resulting importance of directly relevant methodological and empirical research from a system perspective.
We hope that this overview encourages expansion of research in these areas.
Design and Management of Statistical Information Systems in Noisy Environments
Statistical Information Products and Production Systems
Practical discussion and extension of Deming’s 14 Points, and related concepts, require some amount of structure specific to the area of application. For work with statistical information production, principal interest may focus on stakeholders and their information needs, data sources, relevant methodology and technology, and the changing environment in all these areas.
Historically, statistical information production systems often focused on relatively simple estimands (e.g., means, totals, and ratios; and related tables, graphs, and maps, for large population aggregates). They also generally used sample surveys as their predominant data sources, as reflected in the textbooks by Cochran, Fuller, and Lohr (see Further Reading).
Stakeholder expectations about performance usually included multiple dimensions of quality (see sidebar), especially relevance, accuracy, comparability, temporal and cross-sectional granularity, punctuality, interpretability, and accessibility. Operations also required careful attention to constraints related to cost controls, minimization of risk, and compliance with legal and regulatory requirements, most notably for protection against unauthorized disclosure of respondent data.
However, in recent years (https://hdsr.mitpress.mit.edu/pub/vb6hwxez/release/5; https://hdsr.mitpress.mit.edu/pub/w8l955ol/release/3?; https://doi.org/10.1093/jssam/smv035), the operating environment has experienced notable changes. Stakeholder groups have become more heterogeneous and have expanded (https://nap.nationalacademies.org/catalog/24893/federal-statistics-multiple-data-sources-and-privacy-protection-next-steps) their expectations about the scale and scope of information products, as well as standards for data quality and privacy protection. Statistical organizations also have expanded opportunities for real-time access to, and integration of, multiple data sources beyond surveys (e.g., administrative records, as well as data from web-scraping and sensors).
Rapid developments in methodology and technology also can help address those changing needs and opportunities. Four illustrative examples involve supplementation of sample surveys with administrative records; re-design of statistical production to include predominant use of administrative records or other non-survey data sources, with surveys used as needed for supplementation; extensions of customary multiple-frame methodology to include both sample surveys and non-survey data sources; and small domain estimation (bit.ly/3xpO3d3).
Schematic Models for Quality, Risk, and Cost, and Their Impact on Stakeholder Value
Practical and highly creative responses to this changing environment require in-depth technical and managerial work. However, in thinking about those responses, it can be useful to start with broad concepts captured in relatively simple schematic models (https://doi.org/10.1162/99608f92.1cfad278). For the current discussion, these models use a “performance profile” vector P = (Q,R,C) that describes the overall properties of a given system for production of statistical information, including sub-vectors for quality (Q), risk (R), and cost (C).
Thus, for a system intended to produce estimates of a parameter vector θ, we can consider a schematic model:
Pθ (X,Z; γ) = g(X,Z; γ) + eP (1)
where g(∙) is a function of nominally known form; X is a vector that summarizes all applicable design decisions; Z is a vector that describes the relevant environmental factors; eP is an error term with mean zero and distribution function that may depend on X and Z; and γ is a parameter vector both for the mean function g(X,Z; γ) and for the distribution of eP.
An expansive definition of “design” includes the full suite of all decisions related to identification of priorities among stakeholder information needs; identification of target estimands for information production; selection of data sources; intended channels for distribution of aggregate estimates and microdata; and relevant decisions about methodology, technology, and management actions. Consequently, it can be useful to partition the design vector into sub-vectors
X = (XStakeholders, XEstimands, XSources, XDissemination, XMethodology, XTechnology, XManagement)
Similarly, the vector Z of environmental factors may be partitioned as needed. These include societal conditions related to willingness to participate in a survey or consent to record linkage; stakeholder expectations related to trade-offs between data quality and privacy protection; and availability of personnel with a given set of skills at specified wage rates and terms of employment. Many details of design and environmental factors are discussed in broad-based publications (bit.ly/3S0Gcfw), as well as many government agency-specific documents (bit.ly/3k1iDXu).
In addition, a related vector Vθ represents the multiple dimensions of value delivered to stakeholders by production and distribution of estimates of θ using a system with properties P
Vθ(P,X,Z; α) = h(P,X,Z; α) + eV (2)
where h(∙) is a function of nominally known form; eV is an error term with mean zero and distribution function that may depend on P, X, and Z; and α is a parameter vector for both the mean function h(P,X,Z; α) and the distribution of eV.
Models (1) and (2) provide a general conceptual framework through which we can discuss variability in, and potential control and improvement of, the processes for production, dissemination, and use of statistical information. In some cases, we may be able to carry out rigorous characterization, measurement and modeling of some features of P, V, X and Z for models (1)-(2), as reflected in some of the sub-questions listed below; and in other cases, rigorous quantitative analysis may be problematic, and interpretation of models (1)-(2) should be viewed largely in broad schematic terms.
Depending on model features, the variability of the performance profile P and the stakeholder value vector V may be attributable in varying degrees to design decisions on, or limitations in control over, the nominal design vectors X; the environmental factors Z; and the error terms eP and eV . In addition, model features may offer insights about the extent to which decisions about certain design settings may require conditional approaches.
In a very simplified, idealized case, the performance profile function P would be univariate; one would know the function of g(∙), as well as the parameter γ and the environmental vector Z; and the error term eP would be small. In that reductionist setting, selection of a design X to optimize the performance profile P would be relatively simple conceptually, in keeping with Figure 1. Similar comments would apply to optimization of a univariate value function V with additional requirements of known Z, h(∙)and α, and small eV.
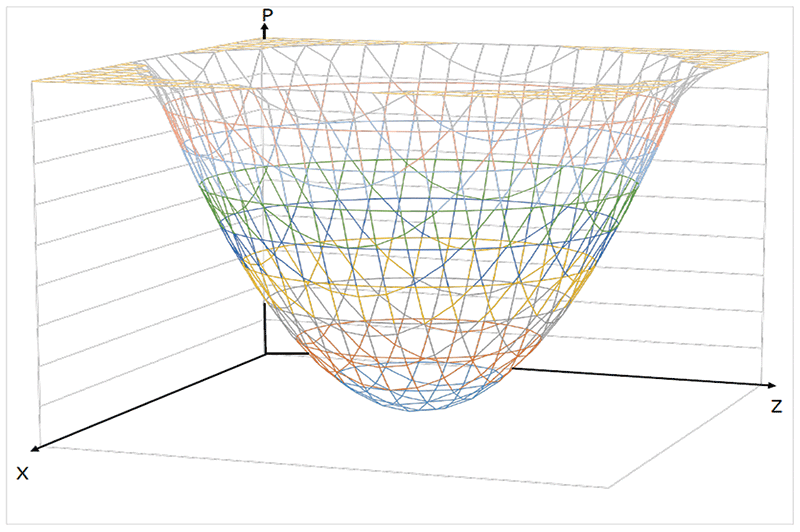
Figure 1. Idealized Schematic Model for Univariate Performance Profile P as a Function of Design Features X and Environmental Factors Z. For this idealized case with univariate P, known model functional form, and known parameters, one can consider selection of X to optimize P, conditional on specified Z; and can evaluate the stability of P in the presence of variable Z. Decisions about the preferred design setting X become more complicated in the presence of multivariate P and uncertainties about Z, model features, or constraints on X.
However, most practical cases of large-scale production of statistical information involve performance profiles P and stakeholder value functions V that are relatively high-dimensional. We may have limited information about the current state and prospective dynamics of the environmental vector Z, and the objective functions and their parameters may not be well-known. The error terms may be nontrivial, and the design vector X may have important constraints that are themselves subject to substantial uncertainty. Consequently, practical design decisions often require navigation of complex trade-offs, constraints, and uncertainties.
14 Questions for Modernized Statistical Information Production Systems
Practical navigation of those issues will require insights from many different technical and managerial perspectives. One such perspective emerges by connecting Deming’s 14 Points with a corresponding set of 14 broad managerial questions (Box 2), and then considering related issues specifically tied to statistical information production systems and the schematic models (1)-(2).
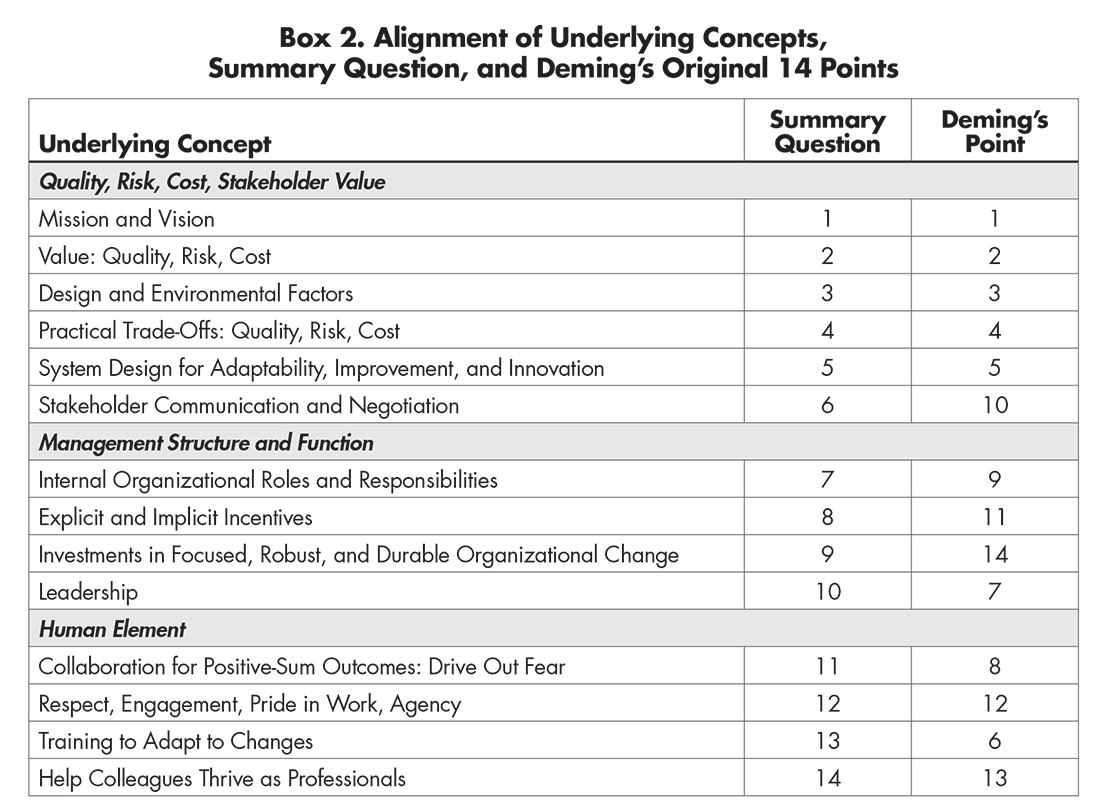
Questions 1–6: Quality, Risk, Cost, and Stakeholder Value, and Their Connections with Statistical Design and Operating Environments
Question 1: Clear understanding of the organization’s mission and vision. Who are the primary stakeholders served by our organization; what are the stakeholder needs that we intend to address, and what are the durable guiding principles for meeting those needs?
For statistical information organizations, special interest might center on the highest-priority needs for statistical information as identified by their principal stakeholders; the specific information products and services, and related adaptable institutional capabilities, that may meet those needs; established legislation, regulations, policies, and market forces that can be important for responses to identified stakeholder priorities; and consistency with overarching societal norms, such as fundamental respect for the human condition, as well as individual, institutional, and scientific integrity.
Question 2: Linkage of stakeholder value with quality, risk, and cost. To what extent, and in what ways, can we characterize, measure, model, and control stakeholder value and its linkage with realistic measures of quality, risk, and cost?
In the context of providing statistical information, this might involve understanding both the use value and option value of the principal statistical products and production systems as defined by stakeholder information needs, performance profiles, design features, and environmental conditions.
Question 3: Models that can connect quality, risk, and cost with underlying design and environmental factors. What are practical ways in which we can characterize, measure, model, and control systems that link quality, risk, and cost measures with design features X and environmental factors Z?
This can help the statistical organization in its efforts to provide the best possible statistical information on a sustainable and cost-effective basis, anchored in the results from Questions 1 and 2, and to follow the principles of transparency, reproducibility, and replicability.
Question 4: Build on the modeling framework of Question 3 to identify practical insights and guidance on trade-offs. What are practical ways we can use modeling results to explore and manage trade-offs among multiple dimensions of quality, risk, cost, and stakeholder value?
Of special interest for statistical information organizations may be the exploration of these issues through concrete use cases, accompanied by careful attention to the interpretability and practical impact of modeling results, constraints, threshold phenomena, and related measures of uncertainty.
Question 5: Design of systems to enhance adaptability and innovation. What are the practical ways in which an organization can design its systems to be reasonably robust and adaptable in light of changing environmental factors that can have important effects on value, quality, risk, and cost profiles, and how can organizations make major innovations in product lines and production processes when necessary?
In keeping with Deming’s Point 5 about continuous improvement, statistical information organizations may have special interest in realistic methods to adapt production systems to address improved information on model 1 or on the environmental conditions Z; address incremental changes in Z (e.g., willingness of sample units to provide survey responses and consent to link responses with administrative records, or the availability, quality, and cost of non-survey data); and use previously developed information on models 1 and 2 to offer insights into options for fundamentally new information products and production systems.
Question 6: Communication about quality, risk, cost, value, and changes therein, in forms that are clear, realistic, and credible for internal and external stakeholders. What are realistic approaches for clear, responsible, and credible communication and negotiation with all relevant stakeholders (both internal and external) regarding important features of, and decisions about, quality, risk, cost, and stakeholder value, and related changes?
These approaches may include numerical, graphical, and narrative ways to convey overall patterns of statistical information production system performance. Examples include population coverage rates of, and operational definitions of variables in, administrative and commercial-source data; measurement error; incomplete-data and record-linkage issues; lack of fit in models for imputation or small domain estimation; issues associated with relevance, comparability, and granularity; disclosure risks; and fixed and variable components of costs.
In keeping with Deming’s Point 10, “Eliminate slogans, exhortations, and targets…,” which focused on internal management, statistical information organizations can consider using conceptual and empirical results from models 1 and 2 to communicate ambitious goals, plans, and accomplishments in ways that will resonate and have a high degree of credibility with both internal and external stakeholders, and foster constructive engagement by all participants in understanding and addressing the natural limitations of those goals, plans, and accomplishments.
Questions 7–10: Management Structure and Function
Question 7: Internal organizational roles and responsibilities. What organizational structures and allocation of resources, along with decision-making authority and responsibility, will enhance timely, efficient, and responsible decision-making and organizational control?
Per Deming’s Point 9, “Break down barriers…,” statistical information organizations can consider specific ways in which targeted modifications of organizational barriers, and enhancement of formal and informal networks, can improve timely information flow and organizational control, and support needed cost-effective adaptations in the design X, thereby helping to improve the overall performance profile P and trade-offs therein. Prospective benefits and limitations of different options for management structure and function may differ for statistical organizations that do most of their data capture and production work through, respectively, internal groups or external contracts.
Question 8: Explicit and implicit incentives for internal and external stakeholders. How do we ensure that our explicit and implicit incentives and related management processes are consistent with long-term success in meeting the organization’s goals and in reinforcing expectations of individual, institutional, and scientific integrity?
For statistical information organizations, this may include incentives for internal stakeholders to engage fully with the technical and management goals and processes considered in these 14 questions. This also may include incentives for external data sources to provide data and metadata in timely and cost-effective forms, as well as for external data users to engage constructively with the statistical organization on priorities for data products and quality characteristics, curation of data and software, discoverability and accessibility, and compliance with requirements for data protection.
Question 9: Investments in focused, robust, and durable organizational change. What are realistic ways in which the organization can efficiently allocate the full suite of resources needed to foster carefully focused, robust, and durable organizational change, including changes in target markets and products, and in technical and managerial processes?
For statistical organizations, special interest may center on changes intended to support the development of fundamentally new information products and services and dissemination capabilities and to improve current products and processes. Prospective changes may include the full range of initial research; development of prototypes and pilot projects; transition to full-scale production; and related decisions about resource allocation, mid-course adjustments, or project termination.
Question 10: Practical definitions of managerial and technical leadership. What characteristics are most important for managerial and technical leadership within the organization?
For statistical information organizations, these characteristics may include the leaders having a clear understanding of, and commitment to, the fully integrated technical, managerial, and societal dimensions of the landscape defined by models 1 and 2; recognition of the strengths and natural limitations of quantitative and qualitative information related to these schematic models; strong capabilities for practical navigation of that landscape; and fundamental commitment (bit.ly/40XcvA8) to individual, institutional, and scientific integrity.
Those skills can help leaders foster shared goals aligned with the organization’s strategic vision—and to implement that vision, integrating insights from data scientists; statisticians; methodologists; computer scientists; subject matter experts; and specialists in legal, regulatory, and management areas.
Questions 11–14: The Human Element
Question 11: Fostering a culture of collaboration focused on positive-sum outcomes. What are some practical steps to focus the organization on collaborative system-design and management approaches for positive-sum outcomes, ensuring robustness against natural human limitations and environmental factors?
For statistical organizations, this may include collaboration to integrate insights from various professions (e.g., data scientists; statisticians; methodologists; subject matter experts; and specialists in legal, regulatory, and management areas). This can ensure that discussions from these perspectives are anchored in a shared commitment to improve outcomes as reflected in models 1 and 2. This may involve collaboration on a range of short-, medium-, and long-term activities, including needed responses to time-sensitive issues, deeper root-cause-analyses of those issues, and use of those root-cause analyses to produce durable improvements for the full system reflected in 1 and 2.
In addition, enhancing a culture of collaboration in statistical organizations can require long learning curves and deep networks of engagement among colleagues in all the above-mentioned areas and can be especially challenging for organizations with hybrid (telework/in-person work) environments and colleagues with patterns of relatively frequent changes in employment.
Question 12: Addressing barriers to constructive, respectful, and enthusiastic engagement. What practical steps can we take within the organization to support constructive, respectful, and enthusiastic engagement that is essential to professional satisfaction?
Per Deming’s Point 12, “Remove barriers to pride of workmanship,” practical steps for statistical organizations may include exploration of realistic ways in which to evaluate the consistency of models 1 and 2 with the norms and expectations of the principal professions in the organization; identify and address features of institutional culture and practice that might be inconsistent with those norms and expectations; and engage constructively with responsible professional dissent.
Of special interest may be issues that arise from variable priorities in responding to heterogeneous statistical information needs of stakeholder groups and different responses to uncertainties, risks, and constraints encountered in planning and operations. Also noteworthy are variability in the depth and rigor with which a given set of challenges is addressed; different expectations regarding the scope and pace of adoption of cutting-edge methodology and technology; and related areas of internal and external communication.
Question 13: Training to adapt to changes. What are realistic approaches to training colleagues in new areas of technical and managerial practice, especially in rapidly changing areas, thus enhancing practical integration of new methods with substantive knowledge and legacy operations?
For statistical organizations, some especially notable cases may include training in data science and computer science to help mid-career methodologists and statisticians strengthen their skills in using multiple and alternative data sources. This training would build on their existing expertise in sample design and in weighting, variance estimation, instrument design, and analysis of cognitive and social processes that affect interviewer actions, respondent recall, and reporting. In some cases, training in legal, regulatory, and project management areas can help statisticians, data scientists, methodologists, computer scientists, and subject-matter experts engage constructively with administrative constraints and uncertainties, as well as related unfunded mandates.
Question 14: Help colleagues thrive as professionals. What practical steps can the organization take to help all colleagues thrive as professionals?
Groundbreaking work to address the goals summarized in questions 1–13 may require statistical organizations to empower colleagues for highly creative exploration of a wide range of technical and managerial options, within the context of realistic constraints and general guidelines from senior management, and to support those efforts with a reasonable level of resources, as well as with appropriate, constructive, and timely feedback loops calibrated with models 1 and 2.
Closing Remarks
In summary, the concepts underlying Deming’s 14 Points can provide a useful lens for considering a wide range of management opportunities and challenges that arise in many complex organizations, especially those that produce or use statistical information. These 14 general questions are aligned with Deming’s original points and provide related comments about the design, development, testing, implementation, operations, and continuous improvement of large-scale statistical information systems. The supplementary material elaborates on these ideas through additional sub-questions. Exploring both the general and the detailed sub-questions may help foster vibrant and creative responses to the ongoing expansion of stakeholder needs for high-quality statistical information, and complementary responses to highly dynamic developments in the scale, scope, and features of data sources, methodology, and technology to meet those needs.
Further Reading
Brackstone, Gordon. 1999. Managing Data Quality in a Statistical Agency. Survey Methodology 25:139–149.
Cochran, W. G. Sampling Techniques, Third Edition. New York: Wiley.
Deming, W. Edwards. 1944. On Errors in Surveys. American Sociological Review 9:359–369.
Deming, W. Edwards. 1986. Out of the Crisis. Cambridge, MA: MIT Press.
Lohr, Sharon L. 2022. Sampling: Design and Analysis, Third Edition. Abingdon, England/New York: Routledge & CRC Press.
Rao, J. N. K., and Molina, E. 2015. Small Area Estimation, Second Edition. New York: Wiley.
About the Author
John L. Eltinge received a PhD from the Department of Statistics at Iowa State University and currently is the assistant director for research and methodology at the U.S. Census Bureau. The views expressed in this paper are those of the author and do not represent the policies of the U.S. Census Bureau.
Very good article, my appreciation, it allowed me to remember something so basic that I lived 31 years ago with this fascinating Japanese culture during the startup of a NISSAN assembly plant in Aguascalientes Mexico.
EDWARD DEMING the Father of Modern Quality understood Japanese organizations and their people through training in data analysis to generate statistical process control and improvement.
DEMING great vision and leadership that allowed him to identify and apply these 14 points to get out of the Japanese economic crisis as a result of losing in WWII and take them in subsequent decades to take leadership in industrial sectors and become the G2-G4 economy in the world, product of its continuous improvement (KAIZEN) in sectors such as Steel, Electronics and Automotive, Robotics, Nanotechnology and even ANIME.
The Deming Prize in Japan is a well-deserved recognition of EDWARD DEMING.
Today this knowledge and soft skills derived from it are essential to manage an organization and lead it to sustainability.