
Adapting Statistical Science for a Fast-Changing Climate
Carbon is the fourth-most abundant element in the universe. The Earth’s carbon cycle is a closed system, with carbon moving in and out of different “pools.” Carbon causes no harm while it stays in the ground (terrestrial pool), but once extracted and burned as a fossil fuel, it is released into the atmosphere (atmospheric pool), where it bonds with oxygen and becomes a greenhouse gas.
Carbon dioxide (CO2) is an odorless, tasteless, and invisible gas; nevertheless, it can be measured from in situ flasks or remote sensing instruments on planes and satellites, in units of parts per million (ppm) molecules in the atmosphere. Currently, the CO2 concentration in Earth’s atmosphere is about 420 ppm, which may not seem like a lot, but the last time it was at that level is estimated to be 3.6 million years ago, during the middle Pliocene period. We are just 200 years into the Anthropocene period (judged to have started at the beginning of the Industrial Revolution) and have already seen an unprecedented 50% increase of atmospheric CO2 concentration.
The Earth system has “cycles” (e.g., carbon, water, nitrogen) that are in motion. The complexities of the carbon cycle are illustrated in a figure from a 2013 United Nations Intergovernmental Panel on Climate Change (IPCC) report (see Figure 6.1 in https://www.ipcc.ch/report/ar5/wg1/carbon-and-other-biogeochemical-cycles), reproduced here.
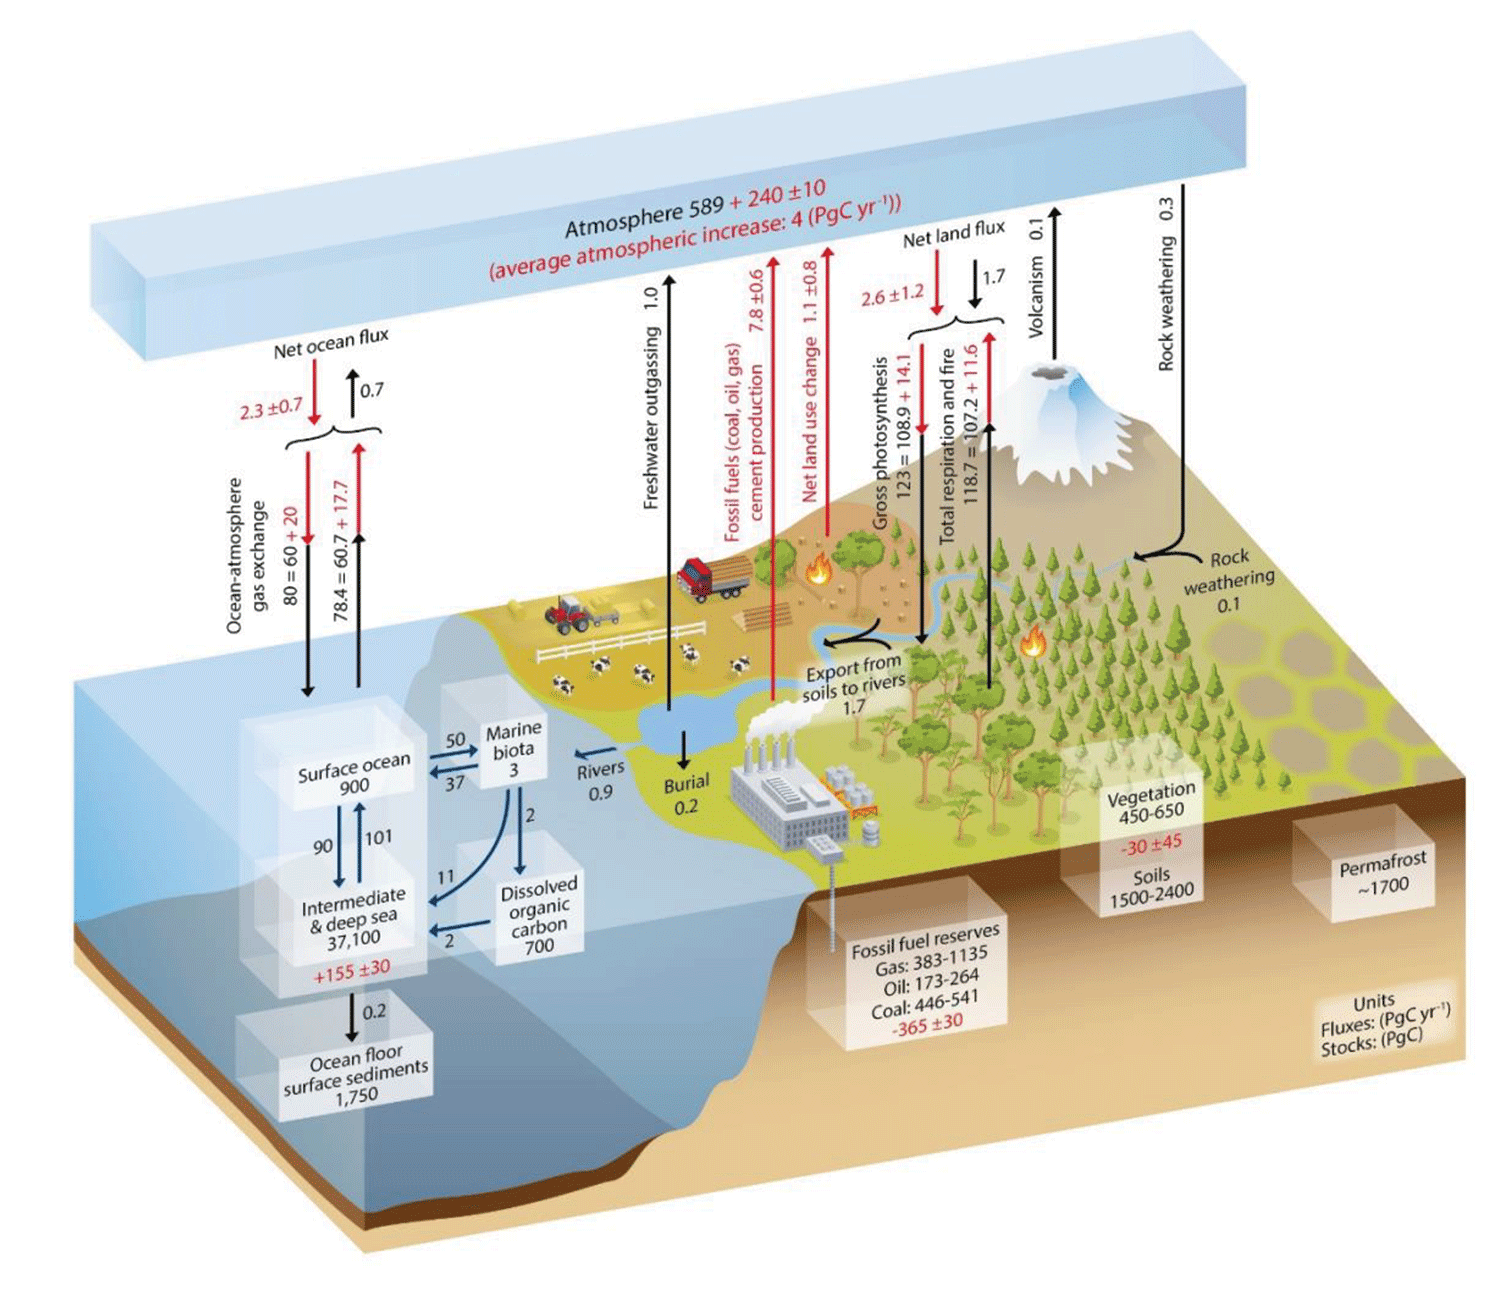
Figure 6.1 from Ciais, P., C. Sabine, G. Bala, L. Bopp, V. Brovkin, J. Canadell, A. Chhabra, R. DeFries, J. Galloway, M. Heimann, C. Jones, C. Le Quéré, R.B. Myneni, S. Piao and P. Thornton, 2013: Carbon and Other Biogeochemical Cycles. In: Climate Change 2013: The Physical Science Basis. Contribution of Working Group I to the Fifth Assessment Report of the Intergovernmental Panel on Climate Change [Stocker, T.F., D. Qin, G.-K. Plattner, M. Tignor, S.K. Allen, J. Boschung, A. Nauels, Y. Xia, V. Bex, and P.M. Midgley (eds.)]. Cambridge University Press, Cambridge, United Kingdom and New York, NY, USA, pp. 465–570, doi:10.1017/CBO9781107415324.015.
Source: IPCC 2013, Working Group I, Ch. 6, Fig. 6.1 (see Further Reading). Reprinted with permission from IPCC.
In pre-industrial times, there was balance in the carbon cycle: About as much carbon was being removed from the atmosphere as was being added. However, in this century, the net increase of atmospheric CO2 has been about 4 gigatonnes (Gt) per year (and growing), which is huge—it represents about half of what was produced by human activity during the year. This excess CO2 is transported around the planet by weather systems, mixes within just months, and adds to an ever-increasing background level. The rate of increase is increasing too; over the last 20 years, increases have gone from about 2 ppm per year to 2.5–3 ppm per year.
How can we reverse the rate of increase and lower the level? “Net zero by 2050” attempts to drop the rate of increase to 0 ppm per year, but that does not address the high level already in place. Global heating is baked in until CO2 can be extracted from the atmosphere. The world is currently relying on natural processes to hold back the CO2 flood, but of 100 CO2 molecules emitted today, as many as 50 remain in the atmosphere over time scales of centuries to millennia.
Global atmospheric CO2 and global near-surface temperatures are in a very close dance, best explained through their incremental effects. When CO2 leads upward this year, temperatures will follow about a decade later. The climate anomalies being seen this year may be due to natural variation or attributable to the anthropogenic indulgences of 10 years earlier.
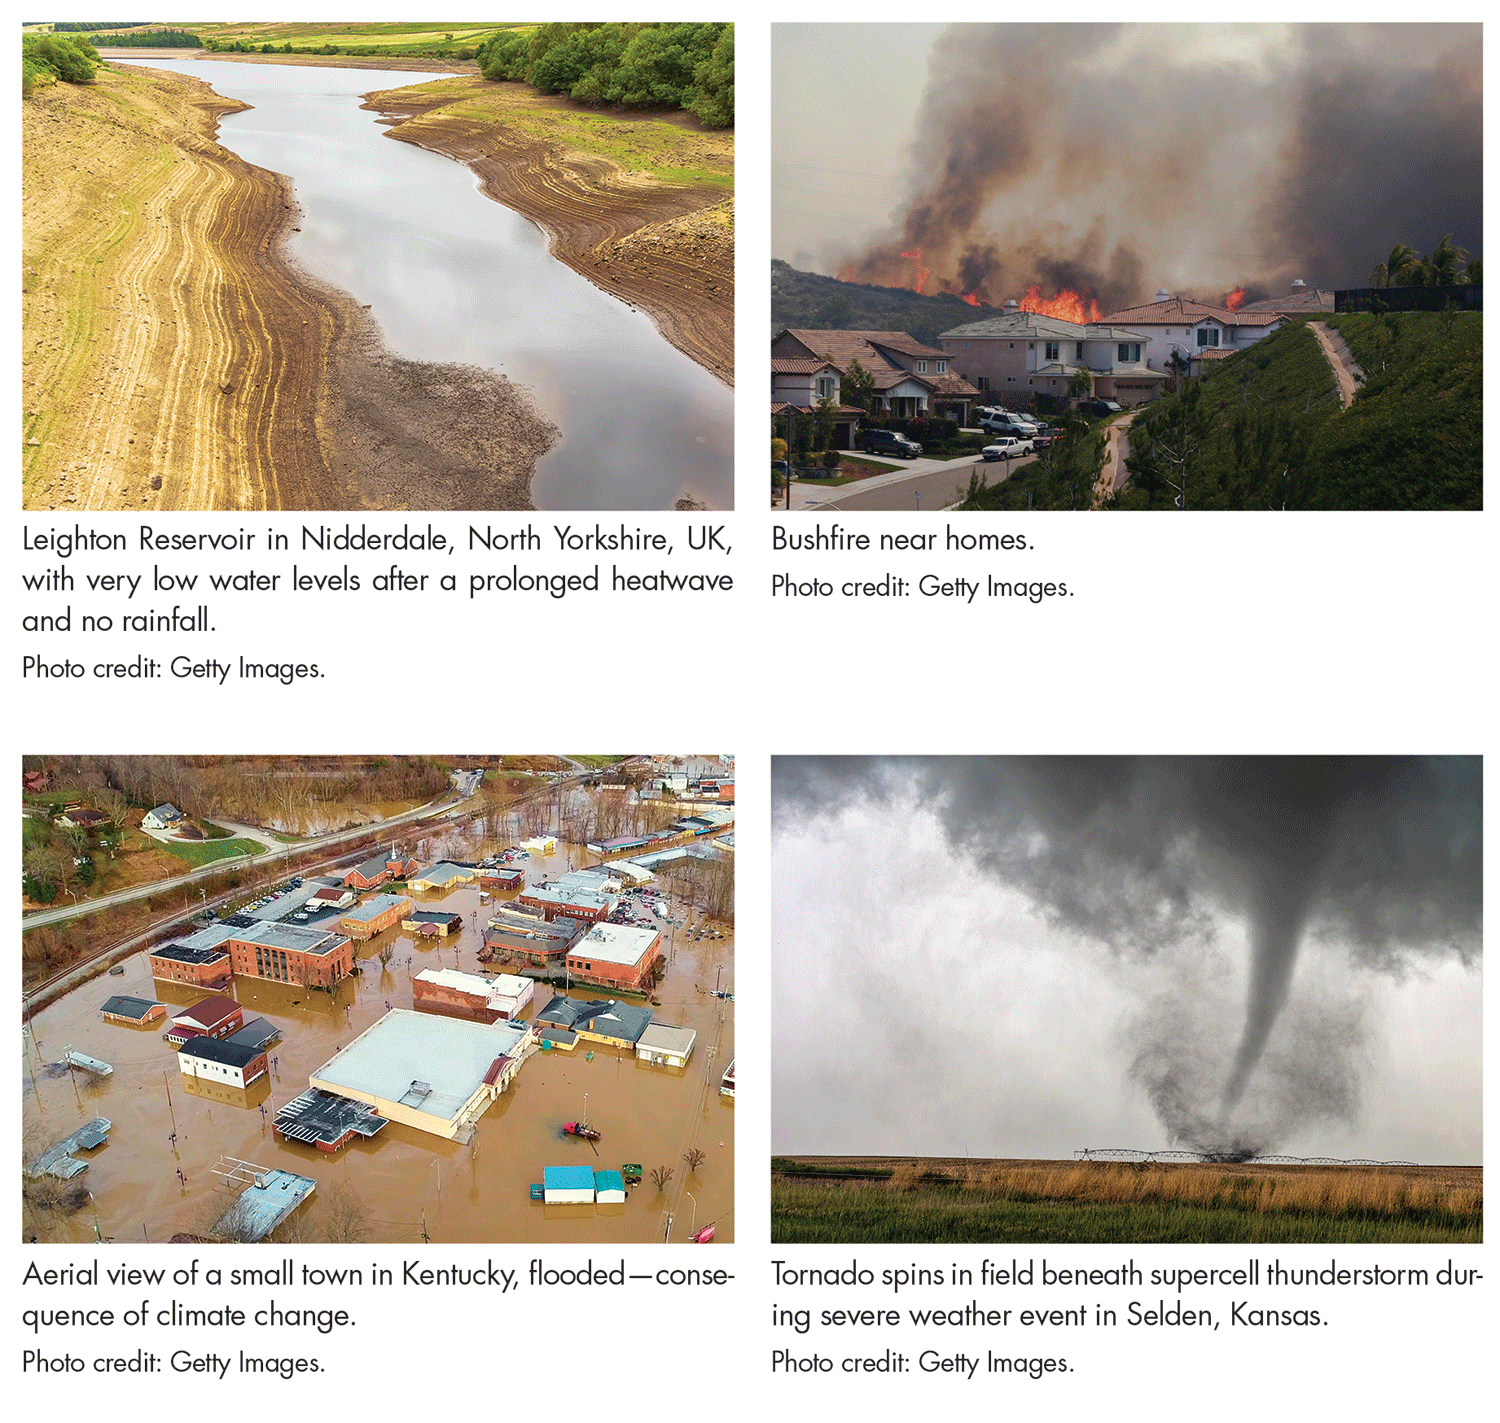
When many more extreme anomalies are observed in a short amount of time than expected from natural variation, statistical methodology can be used to attribute them to human-induced change. Droughts, bushfires, floods, and tornadoes illustrated here are becoming all too familiar and more extreme in intensity.
Five years ago, scientists would describe climate as being like your personality and weather as being like your mood. Now it appears that climate has a “Mr. Hyde” side to its personality and its weather can be volatile and deadly.
In this written version of my November 2022 presentation at the American Statistical Association’s IDEA Forum, my message is that many species on the planet are rather slow-adapting organisms (including Homo sapiens). Superimposing this with a comparatively fast-changing environment can have dire consequences for Earth and all who travel in her. We are moving from a mitigation paradigm to an adaptation paradigm as it becomes clear that our “built Earth” was built for a different climate.
Mitigation and Adaptation to Outrace a Fast-changing Climate
“If you can’t measure it, then you can’t manage it” is a principle that addresses what society must do when faced with mitigation or adaptation decisions: Measure—but not just any measurement will do. The measurement process (how much, where, and when), which comes from scientific knowledge (why), can in turn be used to improve that knowledge. Bayesian learning is a way to move from prior knowledge to posterior knowledge by incorporating the measurements into a hierarchical statistical model of the hidden scientific processes (“unknowns”) and applying Bayes’ Rule.
Bayes’ Rule updates prior scientific knowledge, here written as the probability distribution [unknowns]. It uses this prior distribution and the measurement probability model—[measurements | unknowns]—to obtain the posterior distribution—[unknowns | measurements]; the formula for Bayes’ Rule is in the side-bar. Importantly, the uncertainties in both scientific knowledge and measurement errors are captured through conditional-probability distributions. How can this help society make decisions about mitigation and adaptation?
The knowledge pyramid is an abstraction of the levels needed. The peak of the knowledge pyramid is where decisions are made, and statistical science has traditionally been involved at lower levels: At the base of the pyramid are measurements (think exploratory data analysis); at the next level up is information obtained by exploring the measurements for structure (think summary statistics). The information is then converted into knowledge at the next level by modeling the uncertainty/variability and inferring the etiology of the phenomenon (think inference). Finally, at the peak, decisions are made.
Uncertainty quantification should be involved at all levels, and the consequences of ignoring it in environmental problems can be serious. Decision-makers cannot keep communities safe “on average,” but they should consider the distribution and degree of loss from a mitigation or an adaptation decision.
More attention should also be given to the foundations of the knowledge pyramid. Underneath “measurements,” a design level should be recognized that provides support to the levels above. A strong design is needed before measurements are taken, and this will depend on prior scientific knowledge or will need an investment in a pilot study to inform the prior knowledge. That study could be done on a “digital twin,” built from code by scientists and software engineers to act like the physical world. Observational studies based on “found” measurements have value but are not able to provide the type of causal link available from a scientific study.
In the previous century, statistical science concentrated on the measurement process. In this new century, uncertainty in the scientific process has been recognized, and statistical scientists have developed incredible skill in developing physical-statistical models that are flexible and complex, yet computationally feasible. More recently, machine- and deep-learning methodologies have made a huge impact on predictive inference but have eschewed uncertainty modeling for computability; the importance of both is seen in an area known as statistical deep learning.
yyyyy-Statistical Models
The last 10–15 years have seen statistical scientists involved in substantial collaborations with climate scientists and meteorologists to measure, summarize, and infer various aspects of climate change. Temperature is but one dimension; precipitation, humidity, air pressure, and so forth are all part of the big picture, both near Earth’s surface and in different parts of the atmosphere.
There are spatial, temporal, and multivariate relationships to exploit, not only physical ones but statistical ones as well. The hierarchical statistical model presented in the previous section shows how the two may be bound together through conditional-probability models of the inherent uncertainty in models and in measurements, leading to the paradigm of a “physical-statistical” model.
In climate science, there are highly complex, challenging, and fascinating problems where the answers are not only important for characterizing the where/when/how much/why of climate change, but also for designing mitigation strategies (e.g., planting more trees) or adaptation strategies (e.g., stratospheric aerosol scattering). Possible mitigation decisions should be weighed against each other using notions from decision theory and its applications.
For example, the agriculture sector is now at a stage where doing nothing in the face of climate change (a decision that is easy to make but has consequences, like any other decision) can lead to costs that are a factor of three to four times more than the cost of mitigation.
Clearly, the so-called “climate problem” has many faces, because weather’s moods are such an important part of our environment. There is a need for uncertainty modeling in all these, hence we can imagine yyyyy-statistical modeling, where “yyyyy” could be any one of meteorological, ecological, engineering, defense, agricultural, hydrological, financial, medical, sociological, and so forth.
It is important to be able to understand the effect of climate change on weather, biodiversity, energy/construction/infrastructure, national defense, food security, water, wealth distribution, physical/mental health and—importantly—their interactions. Hierarchical conditional-probability modeling of these large interacting systems allows information to be passed from one to another through causal networks.
In 2021, before the Conference of the Parties 26 (COP26) met in Glasgow, the Royal Society (UK) developed a series of 12 Briefings under the heading “Climate Change: Science and Solutions” that addressed a variety of aspects of climate change, including some discussed here.
A 2022 report from the IPCC also addressed impacts, and a further example is the Lancet Countdown that is making global annual assessments of health and climate change through to 2030 (see Further Reading).
Conclusions
Juggling with the carbon cycle is a high-risk act that trades off economic well-being, jobs, and growth (and the fossil fuels that power them) with global heating of the planet. Making this trade-off requires a decision space with costs and benefits specified. It also requires a careful characterization of the scientific models, measurement models, and parameters guiding them, and quantifying their uncertainties.
Statistical science shows how to combine the scientific and measurement uncertainties into an integrative, hierarchical, geophysical/ecological/engineering/agricultural/hydrological/financial/sociological-statistical model. It maps the path from design to measurements to information to knowledge to decisions, using a conditional-probability structure to quantify the uncertainty in the knowledge attained and make wise decisions based on that knowledge.
The devastation of Australia’s “black” spring–summer bushfires of 2019–2020 is but one of many illustrations of the enormous cost, ecological as well as financial, of taking little or no action. The planet is overheating, and what this generation does or does not do now will deeply affect our children’s generation and those that follow.
Further Reading
Cressie, N. 2022. Decisions, decisions, decisions in an uncertain environment. Environmetrics, e2767.
Lancet Countdown. https://www.lancetcountdown.org, accessed December 2022.
Royal Society. 2021. Climate Change: Science and Solutions, accessed December 2022.
Wikle, C.K., and Zammit-Mangion, A. 2023. Statistical deep learning for spatial and spatio-temporal data. Annual Review of Statistics and Its Application, 10:19.1–19.24. https://doi.org/10.1146/annurev-statistics-033021-112628.
Working Group I. 2013. Climate Change 2013: The Physical Science Basis. Contribution of Working Group I to the Fifth Assessment Report of the Intergovernmental Panel on Climate Change. Eds. T. F. Stocker, D. Qin, G.-K. Plattner, M. Tignor, S. K. Allen, J. Boschung, A. Nauels, Y. Xia, V. Bex, and P. M. Midgley. Cambridge, UK: Cambridge University Press.
Working Group II. 2022. Climate Change 2022: Impacts, Adaptation and Vulnerability. Contribution of Working Group II to the Sixth Assessment Report of the Intergovernmental Panel on Climate Change. H. O. Pörtner, D. C. Roberts, M. Tignor, E. S. Poloczanska, K. Mintenbeck, A. Alegría, M. Craig, S. Langsdorf, S. Löschke, V. Möller, A. Okem, and B. Rama (eds.). Cambridge, UK: Cambridge University Press.
About the Author
Noel Cressie is director of the Centre for Environmental Informatics in the National Institute for Applied Statistics Research Australia (NIASRA), a chief investigator in Securing Antarctica’s Environmental Future, and Distinguished Professor in the School of Mathematics and Applied Statistics at the University of Wollongong, Australia. He is also an adjunct professor in the Department of Statistics at the University of Missouri and affiliate at NASA’s Jet Propulsion Laboratory. He is the author and co-author of four books, three of them about spatial and spatio-temporal statistics, and of more than 300 peer-reviewed publications. His recent research involves hunting for atmospheric-carbon-dioxide sources around the world and focusing on Antarctica’s environmental future. Cressie is a Fellow of the Australian Academy of Science, Royal Society of New South Wales, and a number of other learned societies.


