
Approaches to a Dilemma During the Pandemic: Sequential Successes and Simultaneous Successes

Since the breakout of the COVID-19 pandemic, state and local governments have adjusted their decisions and policies to balance public health measures and economic measures. Many states put stay-at-home orders in place to control the spread of the virus, and economic measures fluctuated substantially. According to the U.S. Bureau of Economic Analysis, the gross domestic product dropped about 5% in the first quarter of 2020 when the pandemic started, dropped another 30% in the second quarter of 2020 when stay-at-home orders went into effect, increased about 35% in the third quarter of 2020 when stay-at-home orders were lifted—and then the second wave of the pandemic hit the nation.
Nearly 700,000 Americans have died attributed to COVID-19 since January 2020. This number is approximately the size of the District of Columbia, and the count will increase for a while. Since then, governments have avoided a complete lockdown, and economic measures have been recovering gradually. The country is now paying the price by experiencing another wave due to the Delta and Omicron variants.
When decision-makers try to solve public health and economy problems simultaneously during a pandemic, it is a dilemma. According to the Cambridge Dictionary, the word “dilemma” is defined as a situation in which a difficult choice has to be made between two different things one could do. As a solution to the dilemma during the pandemic, some decision-makers have put two or more options on the table and avoided an extreme option by choosing a compromise between public health and the economy. Is this a plausible approach to solving the dilemma?
A dilemma can be viewed from a probabilistic perspective. Suppose there are two outcomes of interest, where the probability of success of one outcome is increasing with respect to the level of restriction and of the other outcome is decreasing. It is difficult to clearly define the success of public health (controlling the spread of virus) and the success of economy (particularly for those who are negatively affected by the pandemic). The authors rely on readers’ abstract thinking on the definitions of the two successes.
For the purpose of conciseness, the following notations can be defined. The level of restriction is denoted by x, which takes a value between zero (0) and one (1). Decision-makers have sought an optimal decision for x, where x = 0 implies no restrictions at all and x = 1 implies a complete lockdown; x = 0.5 can be imagined as some level of restriction that the probability of success of public health and the probability of success of the economy are near 0.5.
The probability of success of public health is denoted by p1, the probability of success of economy given the success of public health is denoted by p2|1, and the probability of success of economy given the failure of public health is denoted by p2|0. The following can be assumed:
(1) p1 increases as x increases.
(2) p2|1 and p2|0 decrease as x increases.
(3) p1 is close to 0 and both p2|1 and p2|0 are close to 1 when x is near 0.
(4) p1 is close to 1 and both p2|1 and p2|0 are close to 0 when x is near 1.
(5) p2|0 < p2|1 for any decision x.
As a hypothetical scenario, fix p1 = 0.05, p2|1 = 0.95, and p2|0 = 0.9 at x = 0 (no restrictions) and p1 = 0.95, p2|1 = 0.05, and p2|0 = 0.01 at x = 1 (complete lockdown). These arbitrary conditions satisfy assumptions (3), (4), and (5). To respect assumptions (1), (2), and (5) in an efficient manner, consider simple logistic models for each probability p1, p2|1, and p2|0 as functions of x.
For instance, the probability of success of public health is
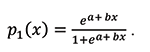
The values of the two unknowns (parameters) a and b associated with p1 can be found by the two fixed conditions p1(0) = 0.05 and p1(1) = 0.95; readers can test this with their own quiz (answer key: a = –2.9444, b = 5.8889). After finding the values of a and b, p1 can be drawn as a function of x (the solid curve on the left panel of Figure 1).
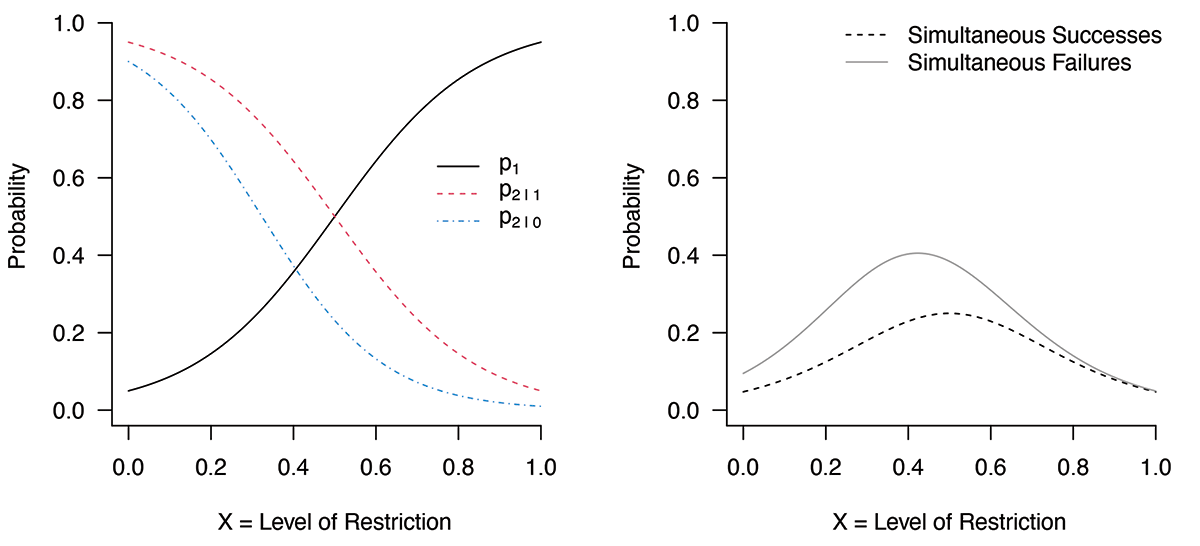
Figure 1. Under specified assumptions (p1 = 0.05, p2|1 = 0.95, and p2|0 = 0.9 at x = 0 (no restrictions) and p1 = 0.95, p2|1 = 0.05, and p2|0 = 0.01 at x = 1), left panel shows probability of success in public health (p1); conditional probability of success in the economy, given success in public health (p2|1); and conditional probability of success in economy given failure in public health (p2|0) as a function of level of restriction (x). Using the multiplication rule, right panel shows probability of simultaneous successes in public health and economy (dotted curve) and probability of simultaneous failures (solid curve).
Similarly, the conditions will allow drawing the curves p2|1(x) and p2|0(x). According to the multiplication rule, the probability of simultaneous successes of public health and economy is p2|1(x) p1(x), and this curve can be drawn as a function of x (the dashed curve on the right panel of Figure 1). Using the multiplication rule, the probability of simultaneous failure is p2|0(x) [1 – p1(x)] (the solid curve on the right panel of Figure 1).
The world is more complicated than the simple logistic models, and the fixed values are arbitrary, but the observed curves do not deviate too much from common sense. Various scenarios under the logistic models can be seen by changing the six probabilities at x = 0 and x = 1 while respecting the five assumptions. Most scenarios showed similar patterns with two messages:
(1) The simultaneous failures may be more likely than the simultaneous successes when a compromising decision, such as x near 0.5, is taken.
(2) Even if there is a compromising decision saying the simultaneous successes are more likely than the simultaneous failures, the decision is near the point that maximizes the probability of simultaneous failures (Figure 2).
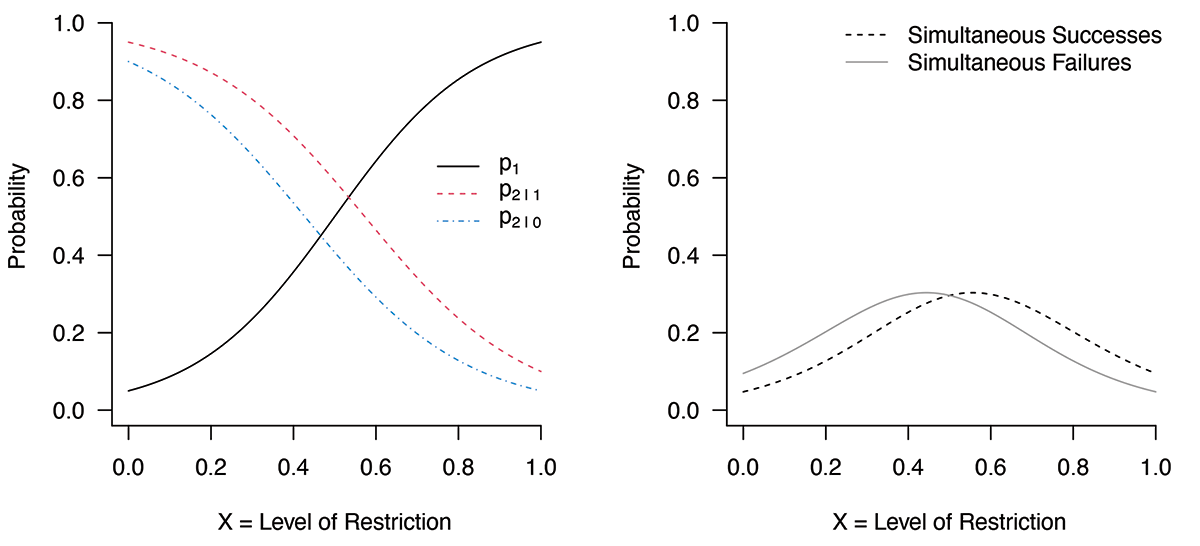
Figure 2. Probability curves of simultaneous successes and of simultaneous failures look similar in right panel by changing values from p2|1 = 0.05 and p2|0 = 0.01 to p2|1 = 0.1 and p2|0 = 0.05, respectively, at x = 1. These are more optimistic assumptions for economics during a lockdown when compared to Figure 1.
Other regression models, such as the prohibit model and the complementary-log-log model, can demonstrate similar patterns.
If decision-makers noticed the risk of a decision near x = 0.5, they would probably want to seek sequential successes (solve one issue at a time) rather than simultaneous successes (solve two issues together). Lost lives of loved ones are irreversible, but an economic crisis is reversible if low-income populations are adequately supported. It is not difficult to decide which problem should be solved first, and that is why many states issued stay-at-home orders early in the pandemic.
How the virus spread is now better understood, and decision-makers seek solutions other than a lockdown. The patience and emotion of the general public have been exhausted, and state and local governments want to pursue the simultaneous successes by finding a risky balancing point. Therefore, a critical question is whether there is a scenario where the simultaneous successes are more likely than the simultaneous failures at a mild level of restriction. Yes, part of assumption (3) is broken. Figure 3 can be obtained by changing the value of p1 from 0.05 to 0.25 at x = 0, while holding all other conditions in Figure 1 constant. If citizens act responsibly and collectively under a relatively mild level of restrictions, p1 at low values of x can be lifted and the probability of the simultaneous successes can be increased, as shown in Figure 3.
Figure 3. The probability curve of simultaneous successes can be above the probability curve of simultaneous failures in right panel by changing value of p1 from 0.05 to 0.25 at x = 0 in left panel while holding all other specifications constant—a more optimistic assumption for public health at a mild level of restrictions when compared to Figure 1.
One group of people favors x < 0.5 (more freedom) and another group favors x > 0.5 (more restrictions and enforcements). Current public health guidelines and policies tend to compromise between the two perspectives. Social distancing, mask mandates, vaccination policies, and restrictions on large gatherings have been some decisions between no restrictions and complete lockdown. Recently, mask mandates have had an impact on daily lives and have been controversial.
The effect of any policy comes from actions, not from the policy itself. Figure 4 demonstrates the state-level relationship among mask mandates (as of July 27, 2021), public behaviors toward wearing masks (as of July 27, 2021), and the impact of the Delta variant (from August 10–September 20, 2021). The data were combined from multiple online sources for each variable: Ballotpedia, the Delphi Group at Carnegie Mellon University, and the COVID Data Tracker at the Centers for Disease Control and Prevention.
It appears that citizens reacted to state mask mandates, and states with higher percentages of people wearing masks were affected less during the peak of the Delta variant. In Figure 4, the regression lines have negative slopes and are nearly parallel between states with mask mandates and states without such mandates. State mandates have an impact on citizens’ behaviors, and citizens are the ones who can finish this battle. The regression result seems to provide evidence that public behaviors are effective whether or not mask-wearing is mandated by states.
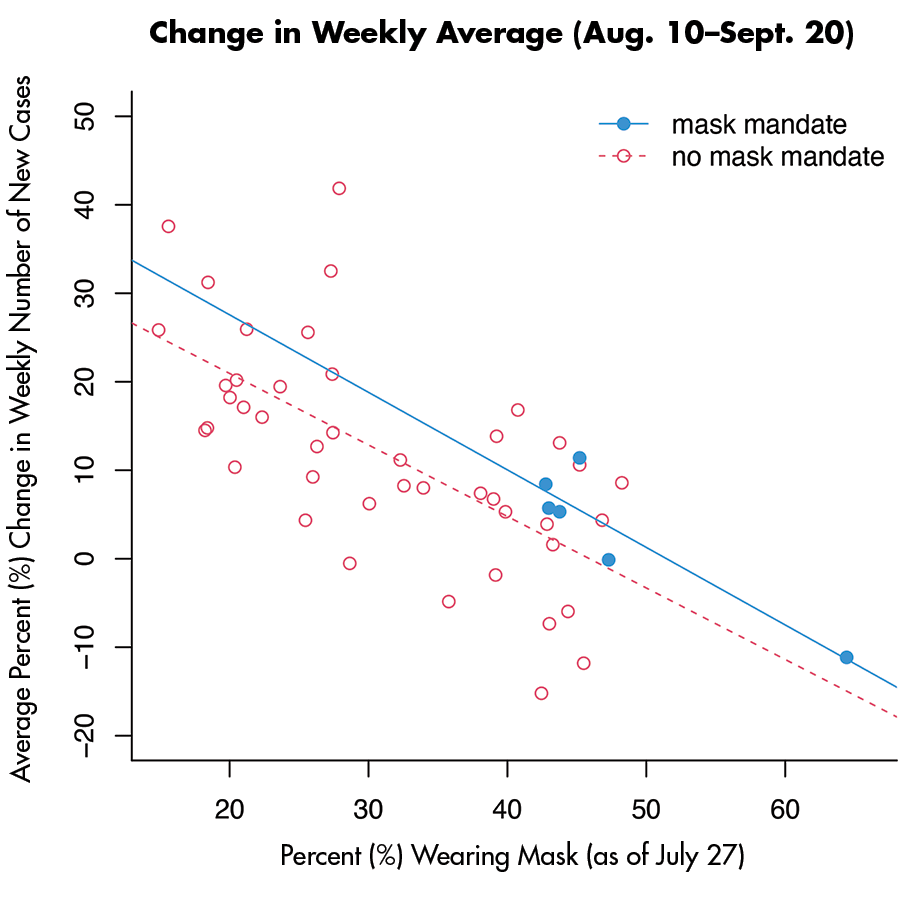
Figure 4. The y-axis is the weekly percent change in new cases, and the x-axis is the estimated percent of citizens wearing masks in the United States. Solid dots indicate states with mask mandates; open dots indicate states without mask mandates. Data points include the District of Columbia and exclude Alaska and Hawaii.
Recalling Figure 3, governments assign an appropriate value of x to protect both businesses and public health, and individual citizens are the key to lifting p1 high enough to increase the probability of the simultaneous successes.
About the Authors
Steven Kim is an associate professor in the Department of Mathematics at California State University, Monterey Bay. He teaches statistics courses for undergraduate students, including introductory statistics, generalized linear model, statistical theory, data simulation, and Bayesian inference. He studies dose-response modeling and experimental designs applied to clinical trials and toxicology, and collaborates with researchers in areas such as agricultural sciences, people analytics, environmental studies, kinesiology, and nursing. He also serves local communities through statistical consulting.
Joonghak Lee is an assistant professor in the College of Business at Gachon University. He is a PhD candidate in the Henley Business School at the University of Reading and earned a doctoral degree from Dongguk University, where he majored in management. His research areas include people analytics, international human resource management, diversity management, and personal selection. He has served many roles in multinational corporations such as the Lotte Academy, Samsung Tesco, UN Foundation, PepsiCo, and Japan Airlines.


