
Lessons from Applying the Community Rapid Assessment Method to COVID-19 Protective Measures in Three Countries

The COVID-19 pandemic has presented both challenge and opportunity, necessitating the use of various tools and approaches to understand how the virus is affecting children and their families all over the world. Effective management of the pandemic relies heavily on individual and community behaviors and norms. Understanding how key protective behaviors (e.g., physical distancing and the use of masks and handwashing) differ among population groups, how they change over time and in response to which drivers and barriers, as well as understanding the needs of affected communities, is crucial in designing an effective response and requires capturing timely community-sourced data at multiple time points.
The UNICEF Evaluation Office, in collaboration with the Communications for Development (C4D) section of the Program Division and the Harvard Humanitarian Initiative, developed the Community Rapid Assessment (CRA) exercise to measure the protective practices, health-seeking behaviors, coping strategies, and emerging needs of individuals and households in relation to COVID-19. The primary objective was to provide country offices with valuable data to strengthen the evidence base and inform country-level programming in response to the pandemic. The CRA is also intended to contribute to the methods that can be deployed in evaluative designs other than emergencies and pandemics. The design of the CRA provides some lessons learned based on a preliminary statistical analysis of data collected with this instrument.
Conceptual Design of the UNICEF Community Rapid Assessment
The CRA is based upon two main pillars: 1) cellphone technology to collect information and 2) questionnaires based on an advanced behavioral model.
The use of mobile technology as a research instrument is in its infancy; however, many studies have demonstrated its value in collecting short population-based surveys. The COVID-19 pandemic highlighted the potential for using mobile phone data to monitor community responses remotely during the outbreak. Mobile phone data have been proposed as a method to monitor the rate of disease transmission, track community behaviors, and support contact tracing efforts in the early phase of a disease outbreak.
Another potential application of mobile phone data is for monitoring and providing real-time population information to assess the potential drivers of disease spread, adoption of protective behaviors, and vaccine uptake. However, only a few studies have investigated the use of mobile phones as a data collection tool in low-income countries. While these data may be an important part of COVID-19 response, their use must be considered alongside a careful understanding of the behaviors and populations they capture.
Mobile phones can provide high-quality, community-sourced data to inform country-level COVID-19 program and policy decisions. This methodology can also provide remote access to hard-to-reach populations to better understand COVID-19 trends throughout a larger geographic area. Short phone surveys can collect data that elucidate key drivers of behaviors, demographic profiles of at-risk populations, and responses to policy measures. In the long term, mobile telephone data can also facilitate observation of changes over time.
Behavioral Drivers Model
The overall conceptual approach of the CRA draws upon the Behavioral Drivers Model (BDM) (Figure 1), which is a framework for analyzing the drivers of certain practices or behaviors in a given context. The BDM aims to help practitioners move beyond identifying what people are doing—the typical focus of a Knowledge, Attitudes, and Practices (KAP) study—to a deeper understanding of why people do what they do in each context to inform program design.
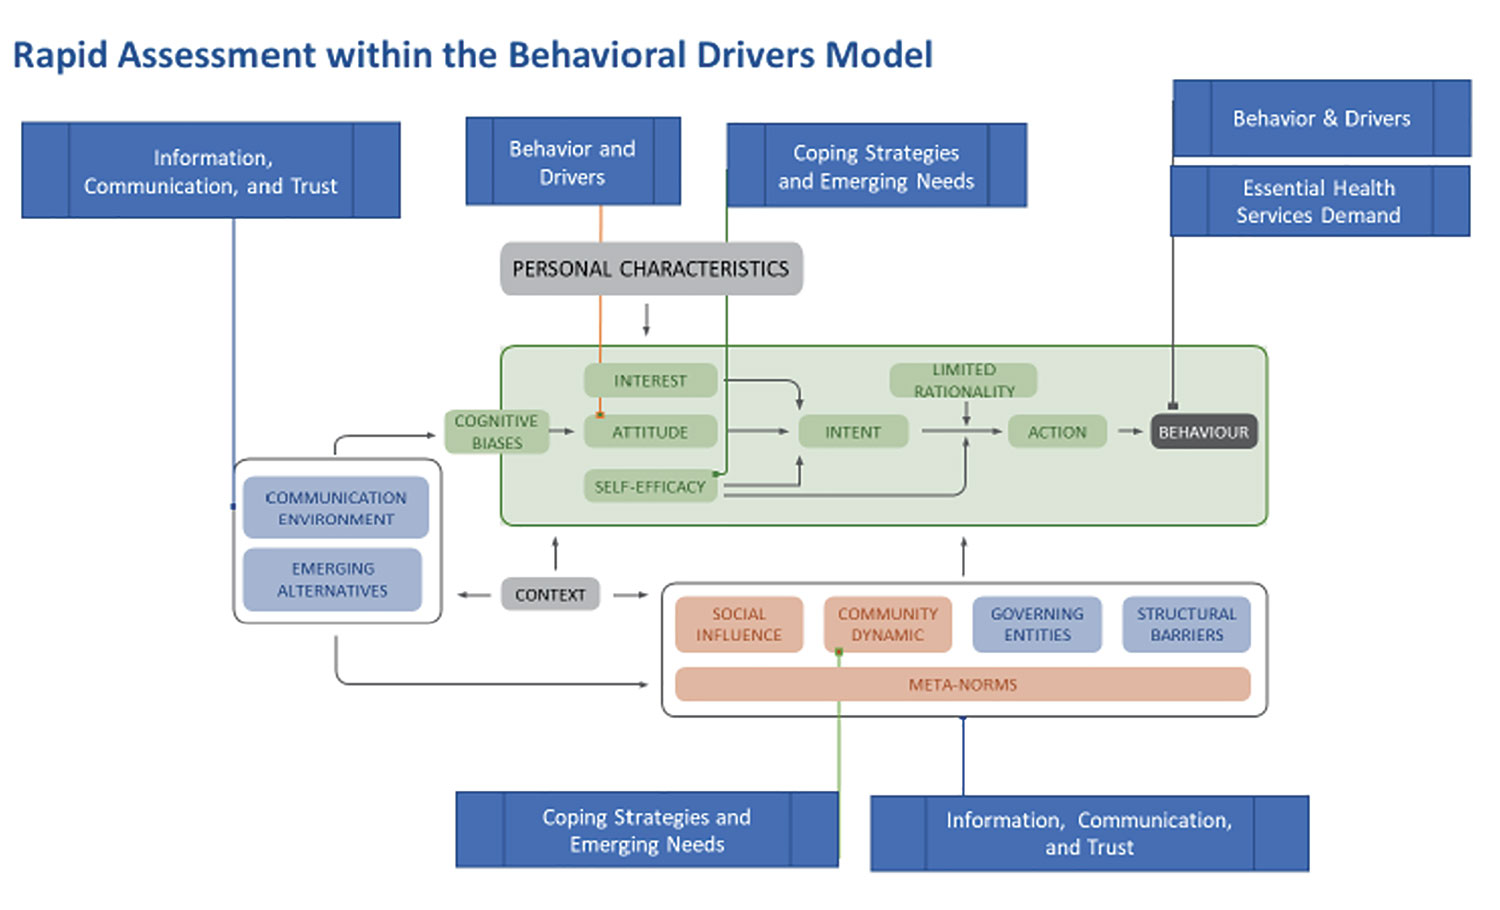
Figure 1. Rapid assessment components of UNICEF Behavioral Drivers Model.
Drawing on this analytical framework, the CRA explores key issues such as prevalence of protective behaviors and barriers to adopting them; perceptions about risk; trust in institutions, community groups, and information channels; and coping strategies and emerging needs in relation to COVID-19, among others. Demographic variables include age, gender, rural/urban, and education, to test possible relationships between these variables and behaviors.
Survey Methodology
The original CRA design used a nationally representative approach to draft longitudinal cross-sectional samples in 12 countries in Eastern and Southern Africa and in South Asia (Table 1). The general CRA design followed a simple random sampling approach using a minimum of 1,000 respondents per participating country. Viamo, a third-party data research firm, carried out the surveys using mobile phones. A few selected countries required alternative designs that included in-person surveys or random-digit dialing (RDD) through a different provider. The alternative designs were implemented where regional representativeness required a larger sample, a different research design was in place before the CRA deployment, or a mobile phone survey was not feasible.
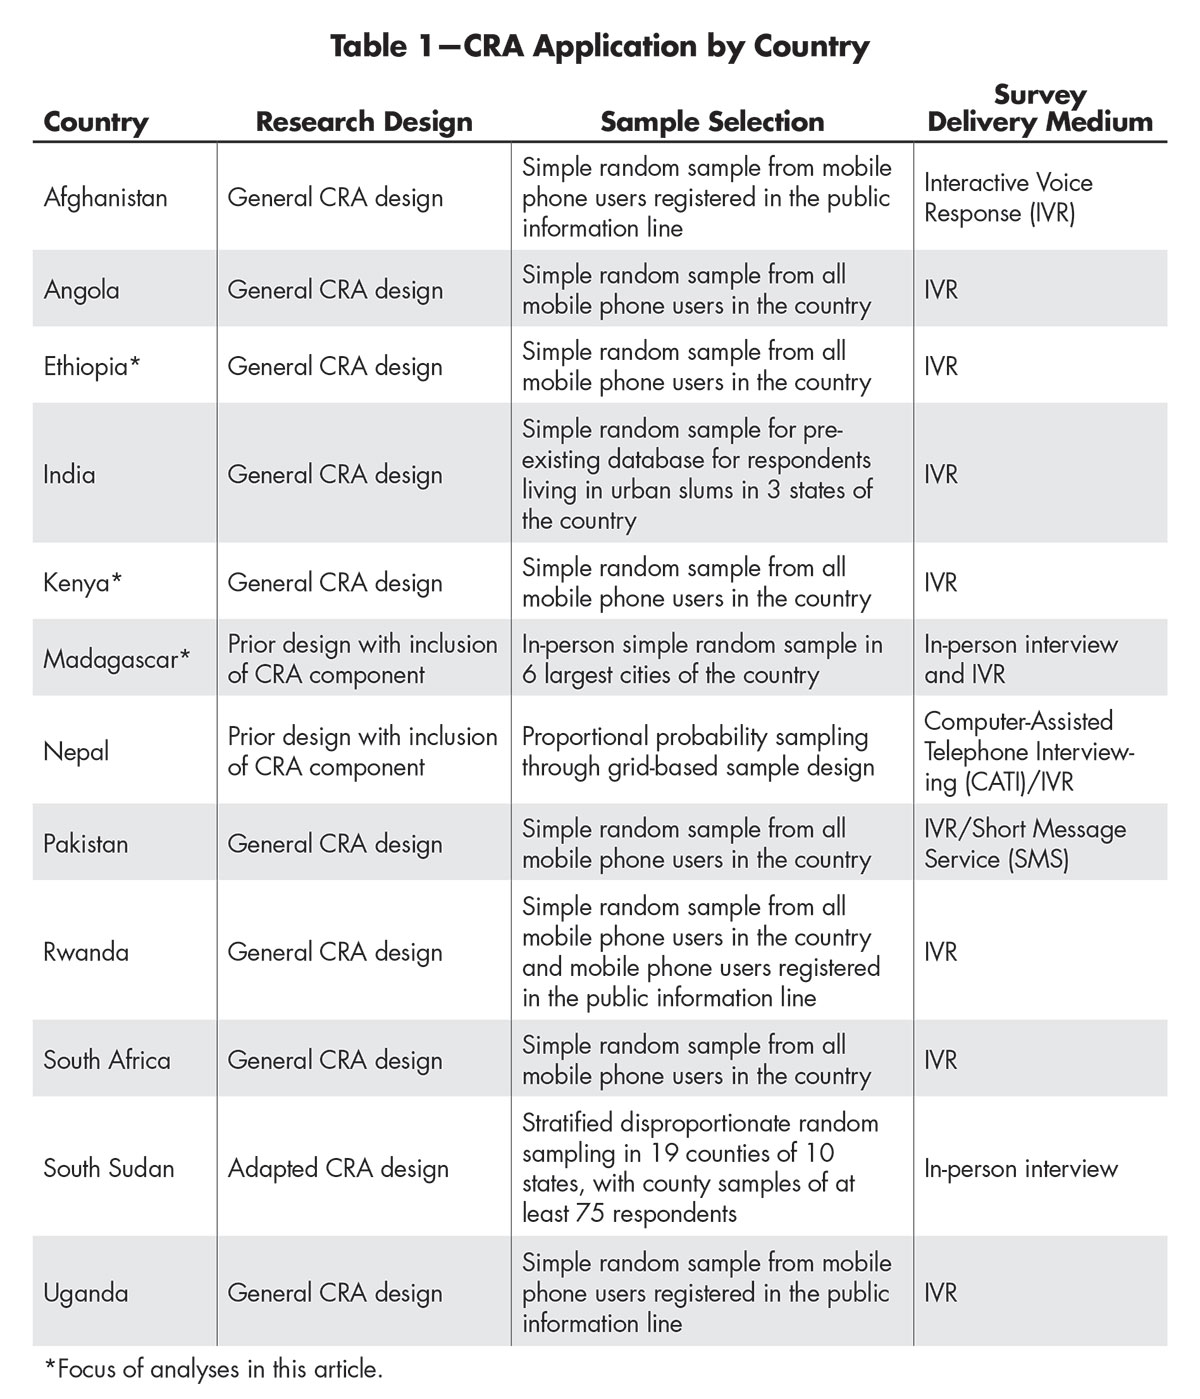
Table 1—CRA Application by Country
The survey included a battery of 14 to 24 questions, mostly drawn from well-established questionnaires, and included selected demographic variables (gender, age, urban/rural setting, and education level). The CRA questionnaire design allowed for country adaptation of the questions to ensure relevance in a variety of country contexts. Only respondents aged 18 years or older were included in the study. The survey results were weighted using a simplified approach that accounted for the probability of selection of the respondent and mobile phone penetration rates. Calibration using post-stratification and trimming was based on nationally representative surveys like national Censuses or Demographic Health Survey.
Analysis and Results
CRA data were collected and analyzed from three countries: Ethiopia, Kenya, and Madagascar. For all three countries, two surveys were conducted at different points in time. The data sets are referred to as Round 1 or Round 2, based on the time of data collection.
Since a key goal of the CRA is to provide actionable information in a timely manner, three phases of analyses were established. The initial phase consisted of descriptive analyses that provided quick-turn products for each round of data collection in an individual country. This phase relied on a combination of well-defined products, such as PowerPoint decks, reports, and research briefs, to provide insights for the participating UNICEF countries at different stages of the study. Next, inferential analysis provides midterm products focused on multiple rounds and multiple countries. Finally, experimental analysis follows the conclusion of all data collection in all countries.
Observations thus far are from after the first two phases of analysis—descriptive and regression analyses.
Survey Representativeness and Weights Model
The sampling weight for each round of data was calculated in three steps. First, the base sampling weight was calculated, which emphasized the total number of calls made and cellphone penetration in the population. Next, a post-stratification adjustment was applied, which emphasized the characteristics of the respondent. Finally, the sampling weight was trimmed.
If a respondent was younger than 18 years of age, the sampling weight for that respondent was set to 0. Many survey sampling frames include both landlines and cellphones. Given the populations to be sampled and the debate in the literature about the use of the dual sampling frames, the analysis team decided to use a frame of cellphone owners rather than those with landlines.
The base sampling weight was calculated using probabilistic sampling. This process began by using a list of people who had cellphone contracts as the sampling frame. The cellphone carrier agreed to make a given number of calls. In addition, demographic information on the cellphone owners was obtained from a recent census or large-scaled survey, depending on the country. The formula used to create the base sampling weight was based on one used by the Pew Research Center.
The base sampling weight was adjusted via post-stratification on the variables sex, urban/rural, age, and education, if available in that country. The post-stratified weights were trimmed at the 95th percentile; values above the 95th percentile were winsorized, thereby reducing the design effect. The design effect compares the current sampling design with simple random sampling. Design effects close to 1 indicate that the current sampling design is about as efficient as a simple random sample. Design effects that are smaller than 1 indicate that the current design is more efficient than simple random sampling, while design effects that are larger than 1 indicate that the current sampling design is less efficient than simple random sampling.
There are some limitations to the sampling weight as it was calculated. First, the sampling weight was constructed to weigh the sample to the population given limited information. As such, while the weight should be used in all calculations of descriptive and inferential statistics, it is not suitable for use in forecasting models. Second, improved information about non-respondents is needed. Third, there was no accounting for how many phones, either landlines or cellphones, were in a household.
Descriptive Analyses
The descriptive analysis design provides the data disaggregated by demographic variables while also weighted to the national population to enhance the robustness of the approach. UNICEF established a non-automated workflow using the R programming language for statistical computing and data visualization. Analysis scripts were reproduced, modified, and made available through knowledge management sites. The workflow was based on master script products developed for different rounds of data collection (for example, first-round, multiple-round, and final-round analysis scripts) and adapted for each round and for country data structures. The scripts and the resulting products (e.g., visualizations and data insights slide decks) served to inform subsequent inferential analysis modeling and more-specialized exploratory approaches.
The result is a high-quality and adaptable product for data analysis and visualization that incorporates survey design changes without requiring major changes in data analysis infrastructure, unlike what would have been the case for a fully automated dashboard. It also allows UNICEF country offices to leverage the products for engaging with national governments and other key stakeholders on reliable data insights.
Regression Analysis
The UNICEF Evaluation Office partnered with Statistics Without Borders (SWB) to apply inferential methods to two research questions: 1) Are there important differences related to protective behaviors between demographic groups? and 2) What role does trust in general and trust in health workers have for these protective behaviors? The inferential analyses are intended to help UNICEF compare and contrast trends between both countries and rounds within a given country.
The SWB project analyzed a total of six data sets, with two each (Round 1 and Round 2) from Ethiopia, Kenya, and Madagascar. The questionnaires for the three countries included questions related to the uptake of protective measures, as well as demographic and regional variables. However, the wording of questions and response alternatives varied in some cases.
The regression analysis treats the selected explanatory variables as categorical. The selected variables include demographic and regional information, relevant barriers to uptake of protective measures, trust in general, trust in healthcare workers or institutions, confidence in ability to provide for family, and observed compliance with protective measures within the community. There is some variation in the wording and availability of the explanatory variables between the six data sets.
The protective behaviors of interest in the regression models are frequency of 1) handwashing, 2) mask-wearing, and 3) social distancing. The survey responses for the three protective behaviors were ordered as categorical data in all data sets. Ordered categorical data such as these can be modeled in a variety of ways, and the team considered the following approaches: 1) Cumulative Logit Model, 2) Multinomial Logistic Regression, 3) Binary Logistic Regression, and 4) Linear Regression. After evaluating the characteristics of the CRA data, the team determined a linear regression model was most appropriate.
After fitting linear regression models to each of the six data sets, the team made the following observations.
- Adoption of protective behaviors varied significantly by region in all three countries—some of the strongest associations observed. The possibility of interactions between region and other explanatory variables were not investigated during the preliminary analyses, but is a possibility for future research.
- There are differences between rural and urban settings, but no consistent trend was observed. For example, rural areas were associated with lower adoption of mask-wearing in Ethiopia Round 1 and Madagascar Round 1, while rural areas were associated with increased social distancing in Kenya Round 1.
- Gender was associated with differences in adoption of protective behaviors, but no consistent trend was observed. For example, females had less-frequent handwashing when compared to males in Kenya Round 1, but more-frequent handwashing compared to males in both Madagascar data sets.
- Confidence (or lack thereof) in ability to provide for family needs was strongly associated with increased (or decreased) uptake of protective behaviors for all three countries and for most of the rounds. This was the most-consistent trend observed in the analysis.
- Trust in healthcare providers was generally associated with increased uptake of protective behaviors for Madagascar Round 2 data. Surprisingly, the reverse was true for Madagascar Round 1 and both Kenya data sets, where trust in healthcare workers was most often associated with decreased uptake of protective measures. Finally, there was no significant association of trust in healthcare workers with adoption of protective behaviors in the Ethiopia data sets. This is an area where further analysis and research are warranted to better understand the inconsistent and unexpected effect that was observed.
- One of the most-significant survey design challenges was maintaining a rapidly deployable, standard survey that is short enough to minimize the non-response rate typically associated with mobile phone surveys while allowing for some customization for the participating country UNICEF teams and their national partners. The solution was a short standard survey with no more than 24 questions from which three to four questions could be exchanged with locally developed questions related to the CRA core research objectives.
- One benefit of a standard survey between countries and rounds is that it would allow for longitudinal and cross-sectional analyses, which is of interest to UNICEF. Unfortunately, the data sets analyzed in this project were not fully standardized, making such analyses impossible. Future uses of the CRA should standardize both the survey questions and response categories for items where longitudinal and/or cross-sectional analyses are desirable.
- The responses for protective behaviors were very unbalanced, with the vast majority in only two out of five categories. Ideally, the responses would be distributed more evenly among the response categories. Future CRA efforts should consider adjusting the response categories and conducting a pilot survey to ensure that the scale captures variability in responses.
- It is important to ensure that those who decline to participate are not different in some important and systematic way from those who do respond. Furthermore, adjusting the sampling weights for unit non-response (i.e., individuals who are asked to participate and decline) would enable more-accurate modeling.
- There are limits to the generalizability of the results, which is one of the biggest challenges with this type of data collection. Clearly, the population to which the results can be generalized includes only adults over the age of 18 who own cellphones. However, the results may not generalize to those who do not own cellphones or those in areas with particularly poor cellphone reception. Furthermore, if cellphone ownership is related to socio-economic status, it might not be possible to generalize the results to those of different socio-economic categories.
- None of the data sets include direct information about socio-economic status of the respondents because of the difficulty in designing survey questions to capture that information accurately. Instead, the question of education level was intended to approximate socio-economic status. Unfortunately, the education question was not included in all of the data sets, and where it was available, there was a high incidence of non-response, so it was not included in the regression models. Instead, the explanatory variable indicating degree of trust in ability to provide for the family is the next-closest proxy for socio-economic status.
- The data sets did not include information about costs related to uptake of protective measures. This is relevant because an increase in mask-wearing could depend on whether masks are distributed for free or must be purchased. Similarly, the disposition to seek help from a doctor or health institution can depend on whether these services are supplied for free or at a fee.
- The coefficient of determination (R2) for the regression models is low, meaning that the explanatory variables did not account for much of the variance in the outcome variables. Other explanatory variables or modeling approaches may better account for the variance in the outcome variables, and this is an area for further research.
Lessons Learned
Many lessons came through this project that can inform future CRA data collection activities, including some key takeaways.
Future Goals
The CRA initiative was designed in response to the need for social and behavioral data to inform Risk Communication Community Engagement (RCCE) approaches during COVID-19. The experience from the data collection and the analysis done so far confirm that the CRA is a cost-effective way to gather rapid longitudinal data on the drivers of and barriers to people’s behaviors, coping strategies, and emerging needs. Findings so far provide a rich and much-needed contribution to understanding the behavioral component of the outbreak at the individual and community levels.
These findings are already being used to inform RCCE programming by both UNICEF and UNICEF-supported governments in East and Southern Africa and South Asia The findings from multiple rounds point to several areas where behavior change strategies and interventions can be adjusted to maximize effectiveness, particularly in relation to specific target populations, through socio-demographic data analysis.
Incorporating lessons learned from the analysis done thus far into future applications of the CRA will help mature the method and enable more-advanced analyses. A future goal is to conduct longitudinal and cross-sectional data analyses to examine country- and region-specific trends over time. Identifying and understanding such trends could lead to more-proactive RCCE programming changes or identify potential collaboration opportunities across regions and countries.
The need for rapid social and behavioral data is not limited to the COVID-19 pandemic. The long-term vision is to embed capacity for similar surveys within government data systems at the country level.
The implications of an embedded CRA capacity are two-fold: It will ensure that evidence-generation plans at all levels integrate systematic rapid research to collect and analyze social and behavioral data, and it will facilitate data-driven advocacy and decision-making processes.
Further Reading
Mobile phone data for informing public health actions across the COVID-19 pandemic life cycle. Science Advances.
The use of mobile phone data to inform analysis of COVID-19 pandemic epidemiology. Nature.
About the Authors
Christian Andersen has a PhD in economics and experience with applied research. He is an administrative adviser at the Institute of Marine Research in Norway.
Uyen Kim Huynh is chief of innovation and learning in the Office of Evaluation at UNICEF Headquarters in New York. She has extensive experience in evaluating the progress and impact of humanitarian projects in low-income countries and has measured Millennium Development Goals indicator progress and the Sustainable Development Goals across sub-Saharan Africa. Before joining UNICEF, she served as assistant director of policy at the Center for Globalization and Sustainable Development at Columbia University. She holds a PhD stemming from her research in the Harvard Program for Refugee Studies and a master’s of public administration from Cornell University.
Andrés E. Ochoa Toasa is a research analyst and data scientist in UNICEF’s Evaluation Office. His work focuses in advanced quantitative analysis, complex methodological designs, and use of new technologies. He holds an MIA, specializing in advanced policy analysis, from Columbia University and a law degree, specializing in human rights, from the Universidad San Francisco de Quito. He previously led TECHO, a youth and development NGO in Ecuador.
Christine Wells is the senior member of the UCLA Statistical Consulting Group. Her areas of specialization include all aspects of collecting and analyzing complex survey data and meta-analysis.
Melissa Wong is a statistician at the MITRE Corporation and volunteers with Statistics Without Borders. She received her master’s in statistics from Texas A&M University.
Interested to obtain a copy of this article on “Lessons from Applying the Community Rapid Assessment Method to COVID-19 Protective Measures in Three Countries” – by my supervisor and colleague, Uyen Kim Huynh. Thank you!