
A Machine Learning Approach to Helping Small Businesses Find Pandemic Economic-Impact Relief

When the Global Health Organization officially declared the spread of COVID-19 as a global pandemic in the first quarter of 2020, the rush to respond to the crisis by both governmental and private organizations made it difficult for an individual or a small-business owner to sort through information. What became abundantly clear for public safety was that stay-at-home and lockdown orders were needed to bend the curve or slow transmission. However, this also created a large strain on businesses, whose doors would have to be closed, and the economic impact was expected to be devastating.
Data scientists were called on to assist in the recovery and relief efforts on several fronts. One well-known effort came from the White House, which, along with other research teams, assembled the COVID-19 Open Research Data set (CORD-19) of more than 400,000 scholarly articles related to coronaviruses. In this case, data scientists were asked to help build machine learning tools to extract useful findings efficiently from this large corpus of text documents.
Another project focused instead on addressing the economic impact of the virus. Client-to-Consultant Bridge (C2CB) felt that data science could be employed more broadly and partnered with Statistics Without Borders (SWB) to help small businesses in the United States affected by the economic disruption associated with pandemic-control responses.
C2CB is a 100% volunteer organization of management consultants formed with the express purpose of providing high-quality managerial consulting advice to small businesses affected by the COVID-19 economic slowdown. SWB is an Outreach Group of the American Statistical Association that provides pro bono statistical analysis and data science tools to improve decision-making and knowledge in efforts that promote public welfare.
The project’s goal was to develop a tool to assist small businesses in their search for aid. At that time, there were many sources of potential aid, including the U.S. federal, state, and local governments and private and philanthropic entities. The challenge for a small-business owner with too much on their plate was to find the programs for which the business might qualify and stay informed about application deadlines and other program updates.
Finding relevant programs was not a simple task, as evidenced by the overwhelming results of simple Google or Bing searches. Given this situation, C2CB’s request for SWB was straightforward:
Use machine learning to automatically curate a national list of small-business aid programs and present users with results in a way that allows them to efficiently find and research programs relevant to them.
This led to the team’s decision to create a website that would automatically update a list of aid resources on a state-by-state basis.
The Idea
The C2CB team originated the idea of creating comprehensive lists of public and private grants for small businesses affected by COVID-19 from their consulting work with affected organizations. C2CB realized that many business owners were unaware of even local aid programs and wanted to provide resource lists that were both more comprehensive and more focused on small businesses across the United States.
This bold project idea faced several challenges. First, C2CB wanted to move quickly because the economic impact of shutdowns was practically immediate and many aid programs were designed to be temporary with quick application deadlines. The group set an internal deadline of four to six weeks.
The project’s twin goals of covering the large and diverse U.S. while maintaining a focus useful to small businesses also posed challenges, particularly in the short time frame. C2CB enlisted SWB’s assistance, knowing the group has extensive experience in building volunteer teams to address complex quantitative and statistical questions in support of the social good. By following SWB’s established engagement methodology, C2CB and SWB broadly defined the project parameters via a Statement of Work (SOW) and formed a team of volunteers from its global network of statisticians, data scientists, and analysts.
The Product
To meet the ambitious timeline, the now-official project team employed tactics from agile product and software development. One principle in these approaches is the rapid delivery of new functionality, often through iterative cycles or sprints. With this project, the team focused on defining and delivering a Minimum Viable Product (MVP), which is an early product release with minimal features that provides enough user value to be useful and can be delivered quickly.
These principles and practices were essential, given the unique nature of the problem. In May of 2020, small businesses were facing a rapidly changing landscape of available aid resources and regulations. Furthermore, small business aid was in high demand, making opportunities to receive aid short-lived. In this highly dynamic environment, it was essential for the team to produce an MVP quickly and iterate on it based on the state of the aid landscape for small businesses. While some aspects could be automated (updating the site list, removing expired aid opportunities, etc.), changes that were more substantial required the MVP to be refined rapidly as needs arose.
When developing software, it is easy and sometimes necessary to invest resources in services related to the core functionality. For example, runtimes can be optimized, user front ends developed and fine-tuned, and cloud hosting services constructed. With this project, MVP software requirements were constrained to these modules:
- Data collection—an engine capable of crawling and scraping the web for information about potential grant websites and filtering for relevant results.
- Modeling—a process for filtering web data for relevant websites.
- User interface—a mechanism for organizing and presenting results, allowing users to navigate the output easily.
For this effort, these components could be built using open source software and run on a standard personal computer. There was no need to scale up computing resources or automate data-collection jobs since workloads would be relatively small and updates would occur weekly at most and could be initiated manually.
With the benefit of hindsight, Figure 1 depicts the product’s fundamental functionality value proposition. Its purpose is to collect data from many aid-related websites, filter those data to the programs most-relevant to small-business owners, and present the results in an easy-to-navigate user interface.
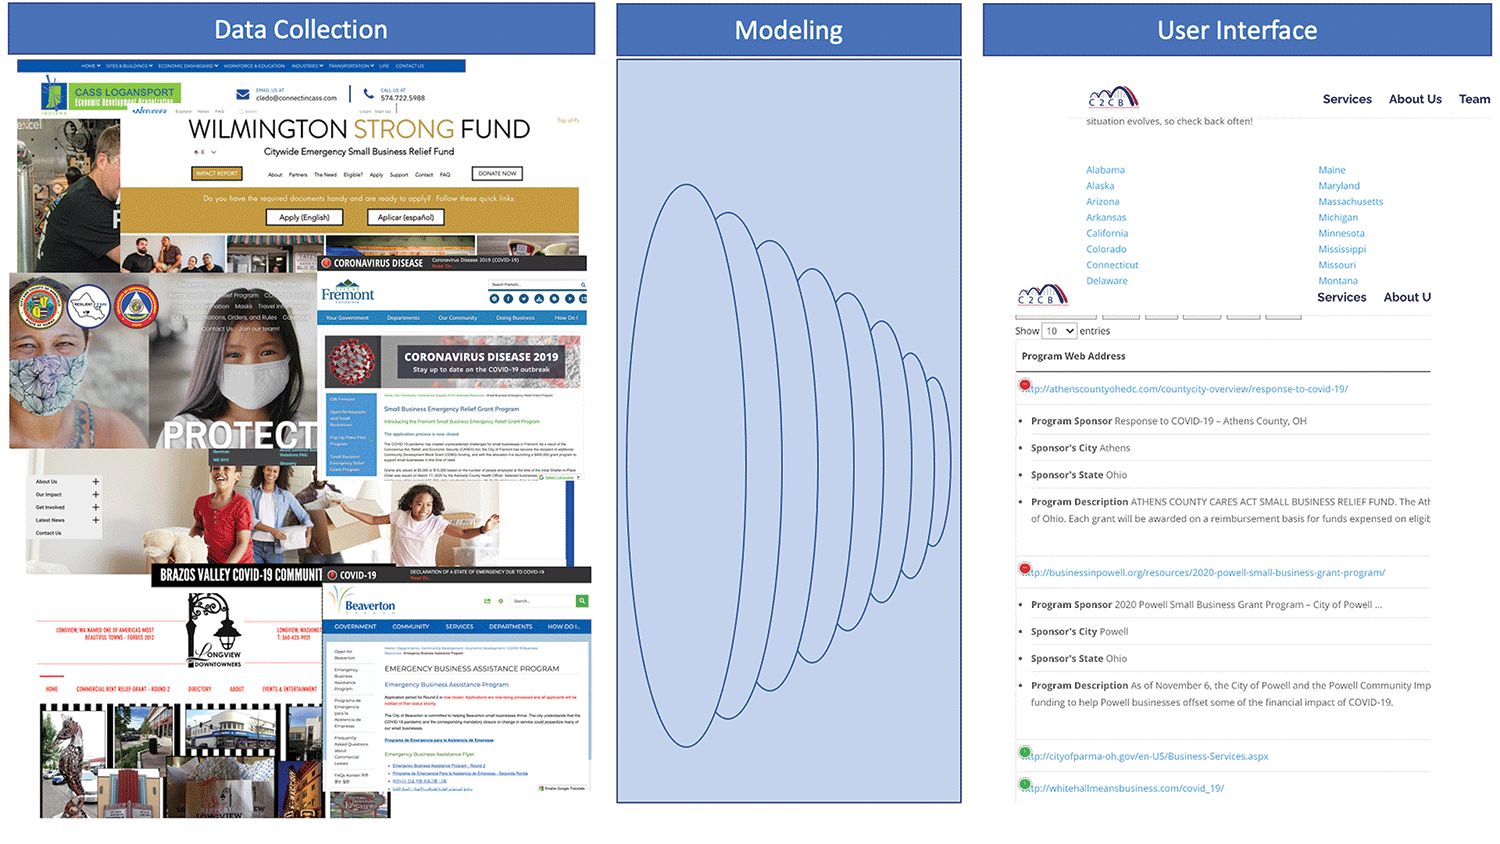
Figure 1. The product’s functionality.
The ethics of web crawling and scraping are important considerations when employing this type of approach. For several reasons, automated web scraping can fall into an ethical and legal gray area, and users of these tools must be aware that their automated processes can cross lines. This ethical ambiguity exists even for the automated collection of public internet data that are freely accessible to human-controlled browsers.
Some factors to consider in evaluating the appropriateness of web crawling include the relative ease with which automated crawlers can overwhelm the volume capacity of some sites (as demonstrated by denial-of-service attacks); copyright restrictions covering certain web assets (such as press images); ownership and redistribution constraints of certain data assets (such as social media profiles); and functionality of some crawlers to conceal their true identity and purpose.
In this case, the project team felt that using automated crawling met ethical standards because the searching was controlled so it would not overwhelm sites; the data collection was limited to minimal content and only information publicly available without login credentials; collected data were used primarily for the internal purpose of assessing site relevance to small-business aid programs; and all final results presented to users contained references and links back to the original sources. In fact, users could only fully assess a program’s relevance by visiting its site using a human-controlled browser.
The Role of Machine Learning
From a conceptual point of view, finding and filtering relevant online information seems straightforward. In this case, the idea was to use machines to replicate the steps a human small-business owner might employ:
- Use internet search engines to find websites covering potential aid programs.
- Review website content to determine which programs are relevant to their business.
The idea for automating these tasks was to use a web search engine Application Programming Interface (API) to run many web searches for small-business aid programs to identify potential website links and apply web-scraping and machine-learning techniques to extract useful information from their content. In addition to helping establish relevance, the scraped data would be used to categorize sites according to various classification criteria, such as applicable geography, funding source, and more. These categories would be employed to help end users find the most-applicable grants for their situations.
However, the main challenge of building a sound information retrieval system is finding a proper trade-off between noise (useless links) and information loss (links containing relevant information that were later erroneously determined to be irrelevant). The whole process can be compared to choosing the suitable sieve to separate wheat from chaff. The looser the net, the more debris allowed through; the denser the net, the more good grain stopped.
The Data
Among its many functions, the World Wide Web now serves as the modern public notice mechanism, and its pool of information on almost any given topic seems infinite. Even at the early stages of a heretofore not seen pandemic response, there is more web information about pandemic responses than can be easily consumed. Nevertheless, the web probably was and still is the best source for data about small-business economic aid programs. The challenge was extracting only the relevant content from a sea of related information, most of which was irrelevant.
The three V’s—Volume, Velocity, and Variety—are important considerations in these types of data-processing problems. In this case, the amount of data (volume) to process was too large for a human to curate (although not large in the world of Big Data), necessitating machine learning. The frequency at which the new data became available (velocity) could be handled by periodically manually running update scripts.
The most-difficult challenge for this project was the wide range of different data formats (variety). Imagining the variety of websites is all it takes to understand the challenges with trying to extract similar data elements, such as a program’s scope or deadline, from a broad collection of local, state, and federal websites.
Table 1 details the two primary approaches employed to handle this complexity. Each approach has pros and cons, and it was helpful to examine the results of both in the early stages of this project.
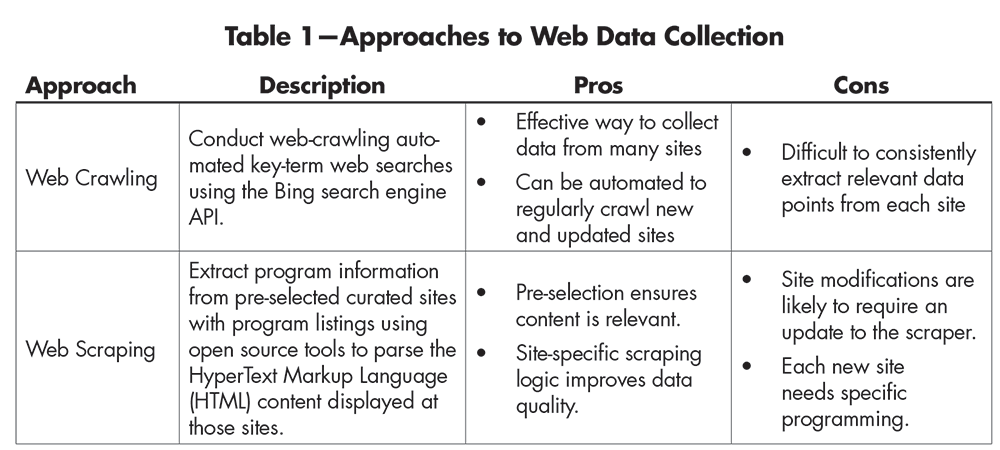
Table 1—Approaches to Web Data Collection
While initially useful as a comparison baseline, it quickly became apparent that the web scraping approach was not viable for this project. Extracting data required specific programming for each site, and such an approach could not be maintained with this all-volunteer, finite initiative. In addition, even in the short span of this project, many curated sites fell noticeably out of date.
The team settled on web crawling using the Bing search engine API as its data collection tool. However, many considerations and potential challenges remained. For various reasons, most search engines prevent repeated automated queries, and data-collection methods that employ these techniques have to comply with the search engine’s acceptable use policies. Bing struck a good balance between being queryable and providing good results.
In addition, finding new and complementary information from general web queries initially was complicated. Simple search terms such as covid aid tended to produce duplicate and irrelevant (to the task of small business aid) results. Over time, search parameters became more refined, such as individual searches for specific U.S. regions and exclusions of certain unwanted sites.
The limited data for each site presented another challenge in handling the search-engine results. The web crawler returned a Uniform Resource Locator (URL) or site link and a short text snippet, but this often was not enough detail to distinguish a target site. The team built a second web crawler to visit each target URL and extract more information. Applying machine learning techniques of document clustering based on similar content and rules-based filtering to this deeper data set made it possible to eliminate content that was clearly not pertinent to the task at hand.
At that point, the team looked to frame the issue as a supervised problem that would allow machine learning models to be trained to recognize relevant websites. In the nomenclature of machine learning, supervised refers to modeling problems where the answer is known and unsupervised to problems where the answer is unknown. Without a source of truth for site relevance, this project was operating in the unsupervised space. To move into a supervised space, the team ad to create a source of truth; namely, a data set in which each site was definitely labeled as either relevant or irrelevant.
The Hand-Labeling Process
In this case, the supervised data set contains website content for both relevant and irrelevant websites and a flag indicating which of the websites were relevant. A sample can be seen in Table 2 in which the Target variable is set to Yes if the site is relevant and No if the site is not relevant. Such a data set allows a machine learning model using input variables such as Description to be trained to predict the output variable; in this case, Target.
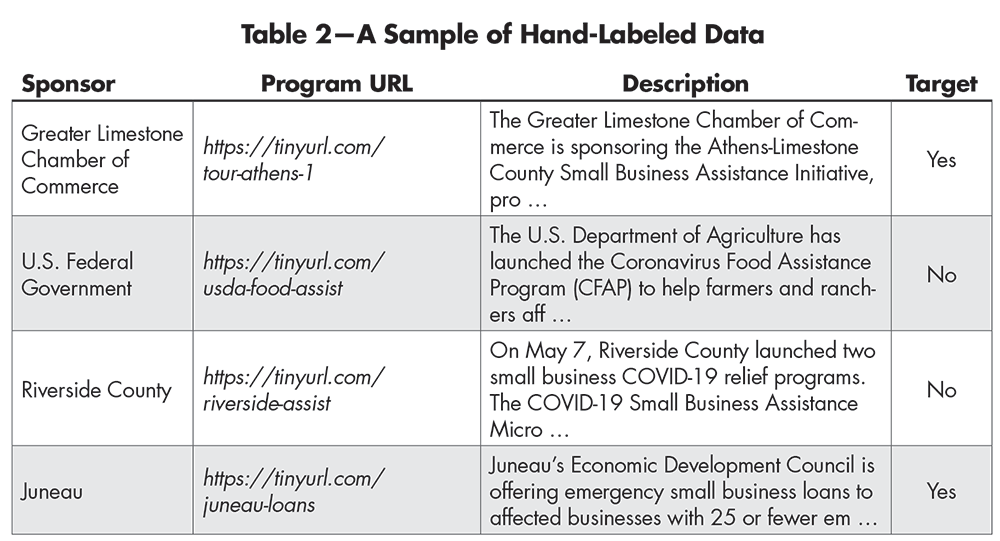
Table 2—A Sample of Hand-Labeled Data
Since no such data set existed, the team set about creating one to cover about 2,000 websites. This task encompassed challenges commonly found in constructing such machine learning data sets. First, some manual steps were required to label the data; second, the determination of relevant and irrelevant websites was not straightforward in many cases, leaving the human labeler with a judgment call to make.
To understand the difficulty of determining relevance, it is helpful to review an example. Consider the City of San Diego site in Figure 2. The page title, Economic Assistance for San Diego Businesses Affected by COVID-19, would suggest that the site would be relevant. However, upon further examination, the site appears to be a reference listing and not a specific program page. For the purpose of this project, this type of site was labeled non-target since it was expected that the actual program page itself would be captured. Further complicating the decision were cases in which the webpage contained information about a specific program and links to additional programs or covered programs aiding both businesses and individuals.
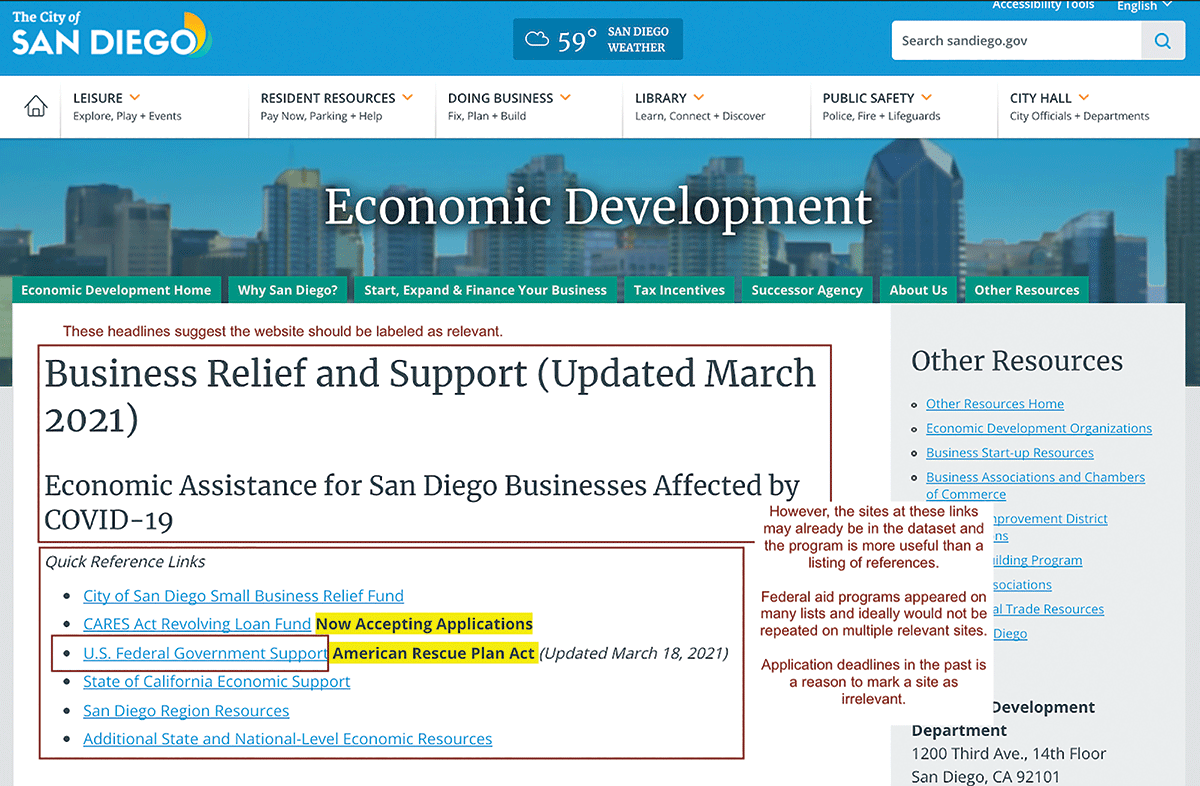
Figure 2. Example of COVID 19 business aid website.
Ultimately, the team adopted a multi-dimensional classification system in which sites were labeled for the several attributes covering their focus (national, state, or local programs); general relevance; solitary consumer focus; media designation; and—of course—a yes-no target flag. While the additional attributes were helpful in determining site relevance and categorizing sites, most machine learning modeling relied on the binary target.
The Model
The modeling approach evolved over several phases. Eventually, a three-part modeling process was adopted:
- Score each site for the likelihood that it is either a media, aggregator, or closed site.
- Score each site for relevance to the small-business aid topic.
- Cull sites that do not meet specified score targets for either the relevance or media/aggregator/closed models.
The media, aggregator, and relevance models relied on Natural Language Processing (NLP) techniques for quantitatively using the web text. The team believed that appropriately cleaned, this text contained keywords and phrases that would indicate a site’s purpose or relevance. To that end, the matter was constructed as a classification problem with NLP input variables. To create input variables, web text was represented by the vector embeddings produced by a Doc2Vec process that does not embed individual words to vectors but entire documents to a single vector. This yielded a data set of N websites, each having several hundred characteristic columns associated with it.
At this point, the team used a penalized (LASSO) logistic regression model to classify sites as relevant/non-relevant, media/non-media, or aggregator/non-aggregator. Identifying closed sites turned out to be highly challenging because NLP techniques were mostly ineffective and associating website dates with program deadlines was inconsistent. Ultimately, the team employed a combination of rules looking at site construction and site crawl dates and web content to identify closed sites.
A few metrics were employed to assess model performance and to set acceptance thresholds, including the standard classification metrics of recall, precision, and Area Under Curve (AUC). Recall is the true positive rate measuring the percentage of correctly identified positive cases; precision is the ratio of correctly identified positive cases to the total number of correct and incorrect positive model predictions; and AUC measures the model’s performance as a function of an acceptance threshold to help assess the trade-off between true and false positive predictions. Following C2CB’s guidance, the team selected scoring thresholds to allow for some irrelevant sites being tagged as relevant, with the benefit being that fewer actually relevant sites would be missed. With this in mind, the team used gain charts to set acceptance and rejection thresholds for each of the model outputs.
The Full Pipeline
Figure 3 represents the data-collection modeling pipeline stages all put together. The automated querying procedure crawls site text corresponding to the county-level Bing search top results in the first step. This initial list of sites is then culled according to several simple rules and classified by geography and program sponsor (Steps 2 and 3).
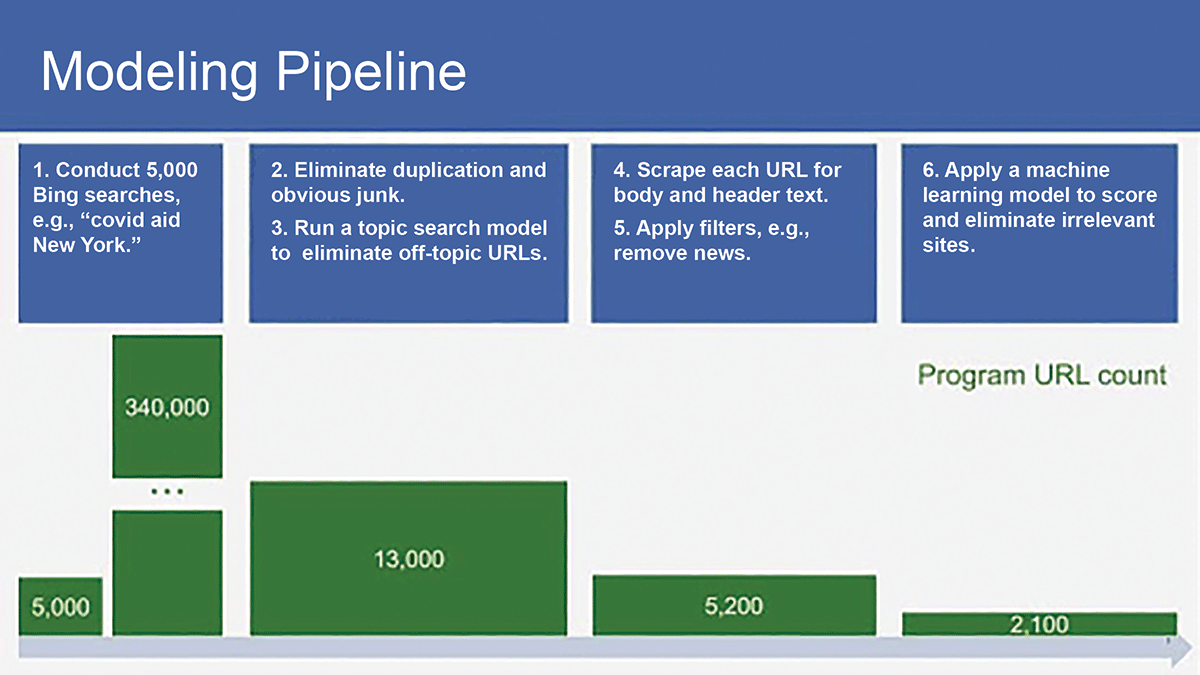
Figure 3. Final processing pipeline.
Additional data are collected for each remaining site in Step 4. Modeling occurs in Steps 5 and 6, where sites receive various scores with respect to different types of sites they may be (media/non-media, aggregator/non-aggregator, etc.), and are then scored for relevance.
The models in this part of the pipeline were validated by splitting all the labeled website data into three segments: a training set, validation set, and test set. Performance for all the classification models (open/closed, media/non-media, aggregator/non-aggregator, and finally relevant/otherwise non-relevant) was measured via the AUC.,/p>
The media/non-media classifier performed the best, with an AUC of .85, followed by the aggregator and overall relevance classifiers, with AUCs of .77 and .72, respectively.
The open/closed classifier performed the worst, with an AUC of .65, but still sufficiently, considering how challenging it was to automatically determine the status of an aid site from text alone.
Figure 4 shows sites with relevance scores above a specified threshold that are published and updated weekly at the C2CB website. These are divided by state and organized in tabular form, with each record providing users with a link to the program, as well as information about the program sponsor, city and state geographic data, and a brief program description constructed from data returned from the Bing search queries.
Product Limitations
While this product performed well in testing and was further validated in production by periodic spot-checks by the client, there are nonetheless several considerations for its performance. Perhaps the most-significant consideration is the data being fed into the model. Theoretically, every site found by the pipeline’s search queries should have a source-of-truth label to be used for model training. In practice, these labels were never truly known.
In addition, for some websites, such a label was ambiguous (for example, the website for an organization that planned to offer aid at some point in the future).
This is true even for the training and validation sets, which volunteers at C2CB and SWB inspected and hand-labeled. While these volunteers worked with small businesses directly and thus were uniquely qualified to assess whether a site would be relevant to such a business seeking aid, it is nonetheless possible (and probably likely) that some sets were mislabeled. This could have occurred at the time of the initial labeling, or if the labeling changed from its initial classification and was not updated (for example, a site at one point offering aid and no longer doing so).
In addition, due to resource limitations, each site in the modeling data was labeled by one and only one person. Even with the acceptance of labeling error, the team believes the approach offered sufficient accuracy to train the machine-learning models effectively.
Another consideration is how representative the website data is of the landscape of COVID-19 aid opportunities. There are many facets to this, from geography (state vs. county vs. local aid opportunities) to public vs. private aid, and even-more-specialized aid opportunities. The search methodology made it possible to curate geographically specific aid opportunities, thus providing a representative sample of opportunities with respect to geography (specifically, at the county level). Other aspects of representativeness are harder to assess.
The team used a search engine for initial site identification, so it is entirely possible that their sample of aid sites was biased toward more well-known aid sources and missed smaller/more-specialized sources. Even if the pipeline could theoretically correctly classify these sites as aid sites, they would never be curated if they were not gathered in the Bing search query.
All in all, though, the team believes that the list of aid opportunities provided by the pipeline is geographically representative, with both public and private aid sources well-represented, although there may be a bias with respect to how well-known the aid opportunity was. This is significant, as better-known opportunities were more likely to be overwhelmed with aid applications, while smaller opportunities might have gone unnoticed. However, the geographically specific nature of the Bing search queries could correct for this bias at least partially.
A final limitation has to do with assessing the actual use of the product. While the client was able to host the product on their servers, they were unable to track user behavior of their site due to limited funding, infrastructure, and staffing. Thus, it is not known at this time how many small-business owners have used this product, or how many have found aid through it. Nevertheless, the product is still hosted on the client’s servers and was certainly used by the client in helping their users find aid during the pandemic. However, the number of users the client assisted is also unknown.
Conclusion
This project came about under very difficult operating conditions, from the uniqueness of the pandemic to the challenges that come with functioning on an all-volunteer basis. Overall, the team learned three important lessons through the iterations of the project.
The first is that data never exist in a vacuum, and leveraging the data’s context is essential to creating excellent data-driven tools and products.
The second lesson came as somewhat of a surprise: A product does not have to be optimal to be useful. Data scientists often fall into the trap of pursuing perfection in what they create before deploying what they have made. This project reminded the team that perfection, in the form of perfect data or all the desired computational resources, is not required for creating a truly useful tool.
Finally, the project revealed the increasing connectedness between the world of data science and other aspects of product development. Data scientists may have implemented this product, but volunteer consultants used it to help small businesses find aid and ensured the product was adding value. More and more, data are becoming an asset that requires input from more than only technical data professionals. This trend is likely to continue, and with it comes the potential for more-relevant tools, and ultimately, more value added through data.
Clearly, the course of and response to the COVID-19 pandemic remains dynamic. By publication time for this article, the U.S. may find that economic shutdowns are no longer necessary and largely in the past. This may reduce the need for this project’s output, but the approach followed here may still prove useful; if not applied to economic relief for small businesses, then perhaps to another similar task.
In essence, the project demonstrated that using open source data-collection, machine-learning, and web-presentation tools, it is possible to gather and automatically curate a large amount of web data. Given the enormous data resource available through the World Wide Web, such approaches can add value in many use cases.
About the Authors
Michal Czapski is a data scientist at NBC News, where his current research focus is on personalized recommender systems. He is involved in various data-for-good projects, with a primary focus on supporting volunteers as a statistical consultant at Statistics Without Borders. He holds master’s degrees in applied physics and materials science.
Stephen Godfrey is a technical product manager in PayPal’s Global Data Science group who has spent his career in financial services, working for investment management, banking, and financial technology firms in quantitative risk analysis and product management roles. He has an MBA and BS in mathematics/applied economics from UCLA and recently completed a data-science bootcamp.
Joshua Derenski is a data scientist at the Universal Music Group. He recently graduated from the University of Southern California’s Marshall School of Business, where he developed methods of estimation and inference for large-panel data sets. He is an active member of Statistics Without Borders, serving in both technical and managerial roles.
Isaac Khader is a data scientist with a master’s degree in electrical engineering from Colorado University Boulder and an undergraduate degree in physics from Reed College. He works primarily in natural language processing.


