
Indigenous Language Migration Along the US Southwestern Border—the View from Arizona
The year 2020 will be remembered in history as the year of the COVID-19 pandemic. This coronavirus outbreak revealed in stark reality vast economic, educational, and health access disparities in societies that experience systemic racism and endure repeated climate-induced catastrophes. To learn from these circumstances requires thoughtfully collecting relevant data, especially from the most-marginalized populations, and can be seen through the experience of one such population: Indigenous Mayas migrating through the Casa Alitas shelter in Tucson, Arizona. Data collected at Casa Alitas and a database maintained by the New York Times highlight where they went and what they faced.
The Spectrum of Life Experiences of Migrants
Indigenous peoples in Guatemala and Chiapas, Mexico, who were alive by 1994 most likely experienced war-time atrocities or territorial military incursions. During the 1980s in Guatemala, more than 1 million male adults were forced to serve in local militias. The Guatemalan army carried out some 600 massacres against Indigenous peoples, constituting the worst genocide in the recent history of the Americas. Indigenous people arriving at Casa Alitas have often escaped a country like Guatemala, where 250,000 mostly Indigenous peoples were murdered.
Indigenous peoples constitute 40 to 60% of the total population of Guatemala. Currently, the human rights of the Indigenous are routinely violated without any judicial or legal defense on their behalf. Drug cartel violence has filled a vacuum created by weak national governments and a scant social safety network. Indigenous displacement and land dispossession is common for Maya in Guatemala, where more than 70% live in poverty and more than 80% of the land is controlled by elite non-Indigenous families.
In Mexico, unmonitored resource extraction and uneven distribution of state benefits to Indigenous peoples has dominated municipalities in the states of Chiapas, Guerrero, Michoacan, and Veracruz. Civil encounters with government officials lend themselves to social and racial discrimination. Consequently, social stigma is often anticipated, especially in unfamiliar surroundings, by someone who self-identifies as an Indigenous person.
In both Mexico and Guatemala, most rural Indigenous peoples worked in agriculture but were displaced due to free trade agreements that favor large-scale commercial agricultural producers, forcing Indigenous farm workers to migrate from their countries to search for work. Climate change impacts in the Central American Dry Corridor have also been a factor for migration for roughly a third of immigrants, mostly from Guatemala and Honduras.
In their migration experience, Indigenous people, due to discrimination against their cultures and race, may have been victimized or witnessed the victimization of others, along with threats to them and their families if they do not meet economic demands. Police and courts often show favoritism to those who offer bribes over those who follow civil procedure. This makes it appear unduly risky to report domestic abuse or armed robberies, for example.
Children who are separated from their families by force or by choice are often traumatized as Indigenous minors. According to the International Mayan League, four Indigenous Mayan children died in U.S. custody at the U.S.-Mexico border during an 18-month period. Even though this is higher than any other ethnic group, the U.S. government did not, at that time, recognize the need to communicate in Indigenous languages.
The Migrant’s Arrival in Arizona
This study looks at two recent waves of migration of Mayan speakers to Arizona. The first took place from May 2014 to May 2017. The second began in June 2017 with the data continuing until August 2019. As of May 2021, the Arizona border with Sonora is undergoing another wave of migrants moving north.
In the first period, data were recorded through a formal intake process at two immigrant shelters in Tucson, Arizona: the Casa Alitas (House of Little Wings) immigrant shelter hosted by Catholic Community Services of Southern Arizona, and the Methodist Church’s Inn Project.
In the second “wave” period, more data were gathered, but only at the Casa Alitas shelter. This second period is the major focus of this data analysis.
The authors are grateful to Catholic Community Service of Southern Arizona for making data available.
Indigenous families who migrated through Mexico were commonly arrested while crossing the border at Arizona or presenting themselves at the United States’ Land Ports of Entry. The data used for analysis are from individual adult Indigenous-language speakers (detained with their families) legally released by several federal government border agencies: Immigration Customs Enforcement (ICE), Customs and Border Protection (CBP), and Border Patrol (BP).
During the second period, the daily population first grew from 14 to 120 people and held steady until late January 2019, when it grew to a new plateau of 200 and occasionally topped 350 people. Over this period, Casa Alitas transitioned from a house and volunteer home sheltering 16 to 26 people to using a series of seven churches taking in 15 to 30 people each and then to a former Benedictine Monastery, which sheltered up to 350 people.
Alitas at the Monastery became the most-significant shelter in Arizona and the third-largest on the U.S. southwestern border. It received migrants from the Border Patrol’s Tucson Sector, a border zone extending from 28 miles east of Ajo, Arizona, on the west to the New Mexico state line on the east. The Tucson Sector is the largest and hosts the fifth-busiest land port of entry.
At the Benedictine Monastery, more than 1,400 volunteers served immigrant families, with more than 300 volunteering weekly and 40 of these volunteers conducting intake interviews. The rest provided a safe place to receive food, medical attention, clothing, Know-Your-Rights training, art activities, English as a second language classes, and information about next steps. Families also received travel arrangements (paid for by immigrant families’ sponsors) and travel food.
Understanding Indigenous Peoples for Intake
When an Indigenous immigrant arrives at a border shelter, a U.S. volunteer might ask them, when interviewing them for registration at intake, “What is your first language?”‘ Sometimes, however, a different question might be asked in an open room with 20 to 50 other people: “Is there anyone here who does not speak Spanish?”
Asking someone to openly and immediately identify themselves as an Indigenous person can be seen as provocative, and pose risk from the point of view of the Indigenous immigrant who arrives with their family. Immediately elevating Spanish over Indigenous languages conveys a perception of reinforcing the discriminatory social environment.
How can a person ask about someone’s Indigenous primary language in a respectful and effective manner? Effective communication is not necessarily verbal, and not all verbal communication has to be extractive.
Protocol and Training for Intake
All intake staff are trained to use these methods in this sequence of steps to accurately record the primary languages of Indigenous peoples. This is critical to having appropriate and accurate information behind analysis of the data. This protocol is based on more than 25 years of field work in public health training in Peten, Guatemala, and Sonora, Mexico, with health promoters in multilingual settings with Indigenous languages.
If there is no specific visual and or oral recognition of Indigenous people in the welcoming message, these migrants are likely to assume that their identity (including their language) poses a risk, so social stigma will dissuade them from communicating openly in their Indigenous language. Training staff and volunteers in the socio-linguistic steps outlined in Table 1 will reduce stigma and increase the accuracy of information exchanged with Indigenous immigrants. Not communicating in this manner signals to Indigenous persons that they and their languages are likely to be stigmatized.
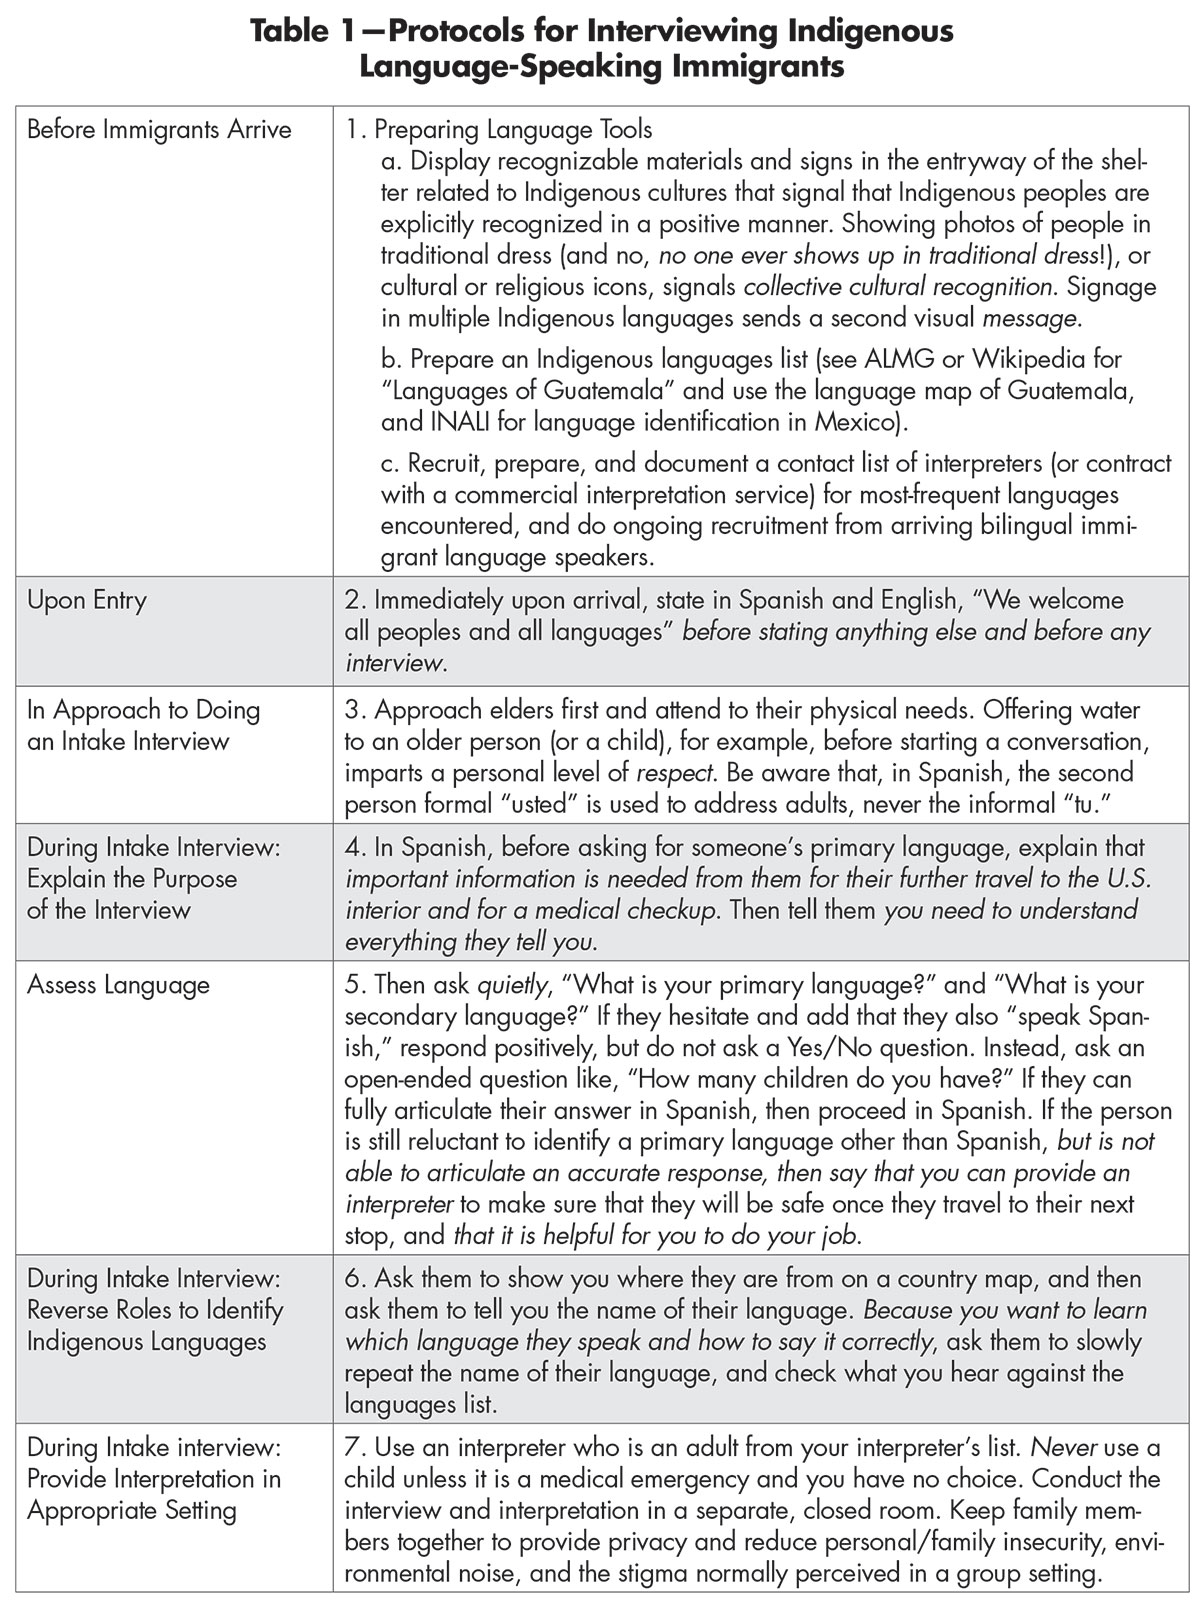
Table 1—Protocols for Interviewing Indigenous Language-Speaking Immigrants
Table 2 gives a broad summary of the data from the two time periods and shows that migration grew by a factor of 2.5 from the first period to the second. The Indigenous language speakers were very stable, constituting close to one in five migrants over both time periods. With very few exceptions, the Indigenous-speaking migrants gave Mexico or Guatemala as their country of origin.
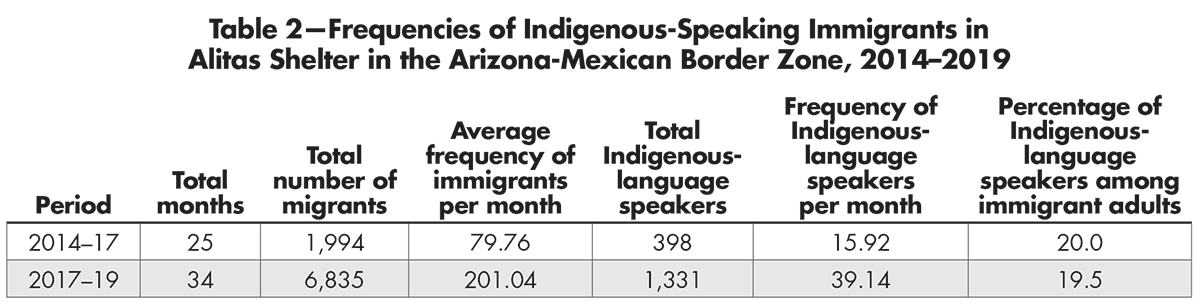
Table 2—Frequencies of Indigenous-Speaking Immigrants in Alitas Shelter in the Arizona-Mexican Border Zone, 2014–2019
Source of Migrant Populations
For the more-recent (2017–2019) migration (where the migrants came from, where they went, how they chose the place to resettle, and what they experienced when they arrived), Guatemalans represented 62% of all immigrant families in shelter (n = 4,251), and Indigenous-language speakers comprised 30.2% of all Guatemalan adults in shelter (n = 1,280). However, the Arizona border region experienced an increase in the presence of Indigenous languages from 19 in 2014–2017 to 29 in 2017–2019. This 34% increase indicates a larger source of migrant populations in the second migration period.
Many of the Mayan migrants found themselves traveling from Arizona to large urban centers or rural farming communities. The first wave of the COVID-19
pandemic began shortly after their arrival.
Mayan Language Trees
The origin of Indigenous-language-speaking migrants is shown geographically in Figure 1 and linguistically in Figure 2. Mayan languages of speakers documented here are shown in the Mayan Language Tree derived from Lyle Campbell’s History and Reconstruction of the Mayan Languages (Figure 2). To identify migrants and their related languages, the 10 languages are listed with the most speakers from families in migration who entered Arizona at the border with Mexico.
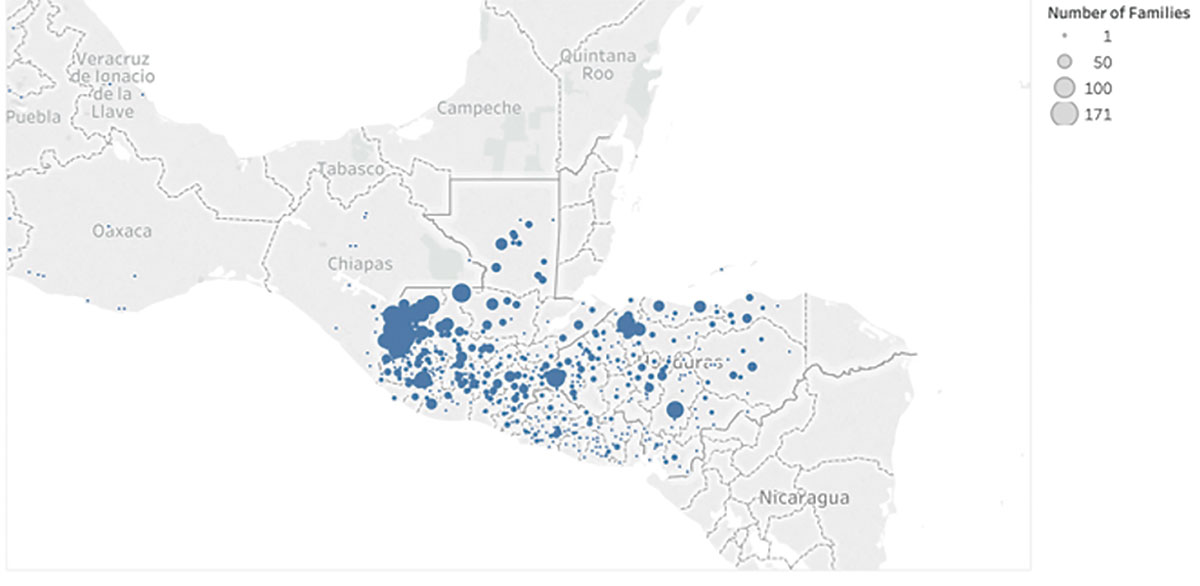
Figure 1. Origin of Indigenous-language speakers who arrived at Alitas Shelter, July 15, 2017– August 1, 2019 (n = 1,333).
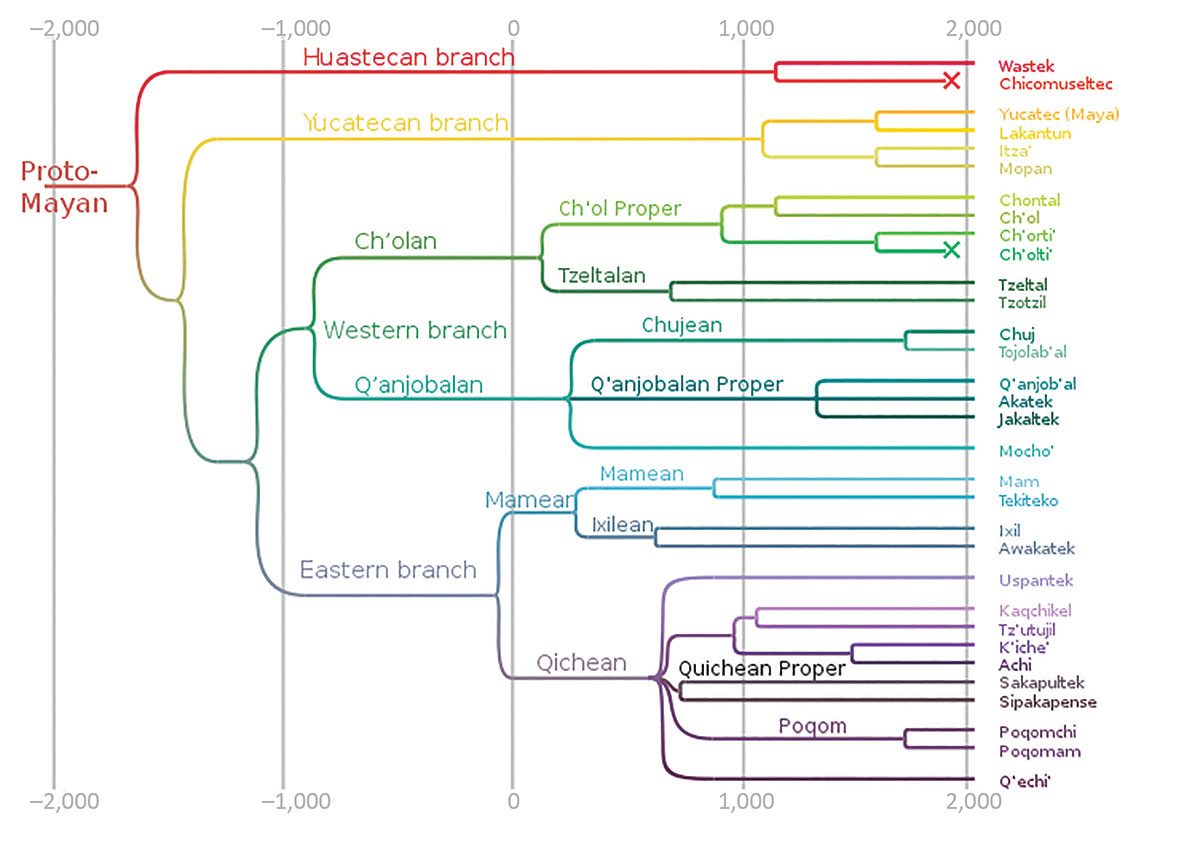
Figure 2. Mayan Language Tree from Campbell (2015) (left); 10 major languages with counts from 2017–2019 data set (right). Tree retrieved from Wikipedia.
After considerable cleaning of the data, the analysis focused on the 10 largest populations of Mayan language speakers and the 20 states they went to. This organizes the data into a two-way table. Different language groups made different choices in their destinations, so a hypothesis of no relationship between language and destination would certainly be rejected. In this case, a chi-square test will have a very low p-value and the null hypothesis would be rejected.
The residuals—the number of standard deviations above or below expectations under the null hypothesis—are emphasized here, and provided insights into how the migration patterns depended on each of the 10 Mayan languages. For example, Mam, the largest language group in migration, has strong positive residuals in Florida (2.37), Georgia (2.31), and South Carolina (2.30), with a strong negative residual in Texas (-4.91). However, for these residuals to have meaning requires knowing a little more about the traditional streams of migration.
Destinations of Mayan Migrants
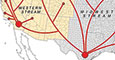
Rural immigrant farmworkers in the U.S. generally followed three migrant streams: Western, Midwest, and Eastern, as shown in Figure 3. Until the late 1990s, those traditional rural migrant labor markets in the United States regularly relied on binational Mexican migrant labor to satisfy the United States’ agricultural labor needs.
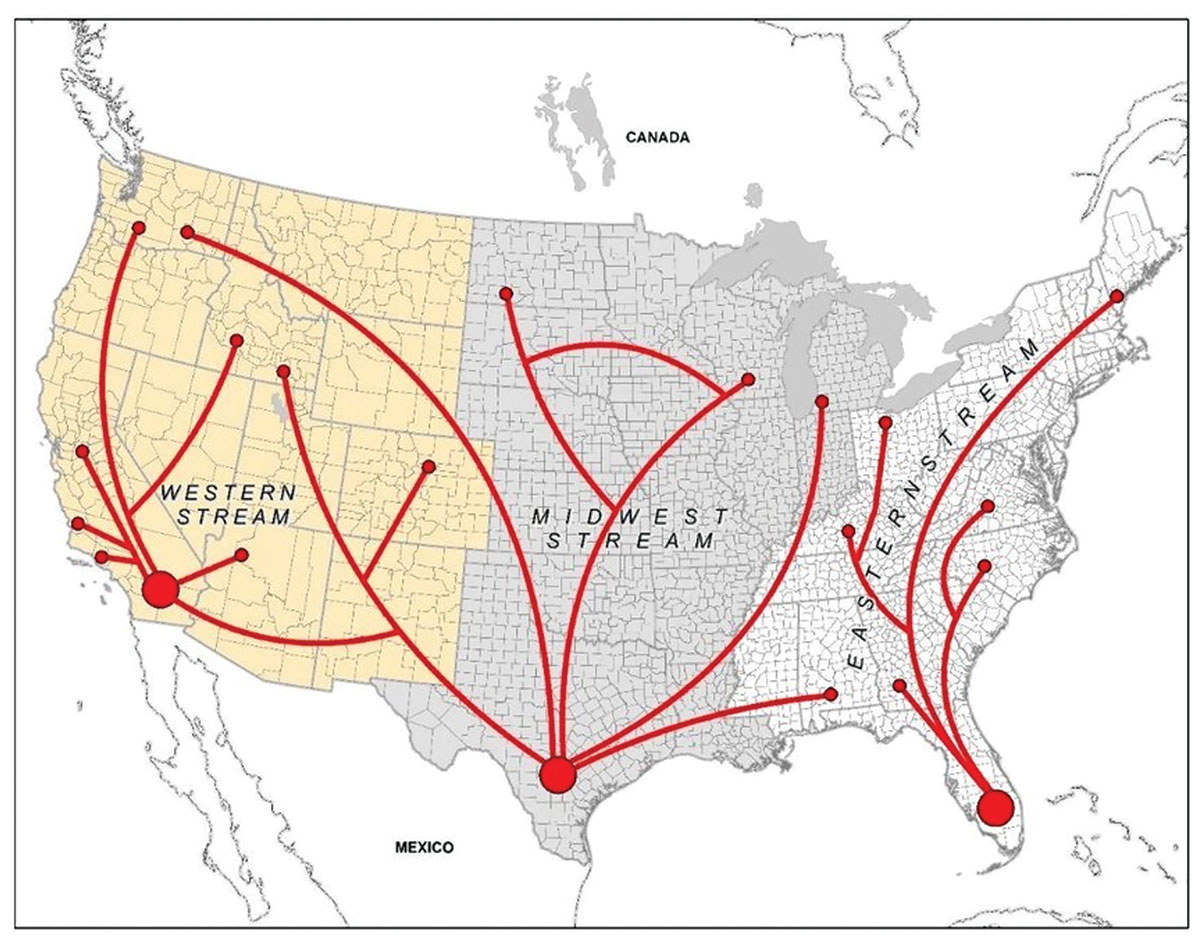
Figure 3. From The Geography of Farmworker Health: A Mixed-Method Exploratory Analysis of Chronic Disease, by Mark A. Deka (used with permission of the author).
Since then, a deliberate globalization strategy of the neoliberal economic model is to increase productive uses of capital, implement free trade agreements, and subsequently change land tenure in Meso-America. These large-scale economic changes have negative impacts on economically displaced and dispossessed rural workers in general, and on Indigenous farmworkers in Southern Mexico and Central American countries specifically. Their transnational migration to the U.S. began a modified pattern of meeting a relative increase in labor demand in the eastern U.S. migrant labor stream.
The data from this study demonstrate a 2:1 higher frequency of Indigenous migration to Florida than to California, the second-highest receiver state, during 2017–2019. Both states feed migrant workers upstream to the eastern and western migrant streams respectively, while Texas remains a pivotal point for labor migration to western, mountain, midwestern, and southern regions. California is also a receiver and transitory state for Indigenous peoples migrating to agricultural and forest industries in the northwest, while Florida is a gateway to rural agricultural, forest, and poultry industries in Southern Appalachian and southeastern states.
Statistical tests in five locations revealed concentrations of communities of Indigenous-language speakers, with evidence of some clustering by languages related within major branches of the Mayan Language Tree. For example, Kiché and Kachiquel in New Jersey and New York in the Megalopolis corridor have high residuals (7.46 [NJ] and 2.61 [NY] for Kiché, 1.51 [NJ] and 2.46 [NY] for Kachiquel) relative to other co-located Indigenous languages in this study. They are both in the Northeast Megalopolis Indigenous languages corridor, as well as geographically adjacent languages in the Guatemalan highlands (see Figure 2).
Consequences of the Pandemic for Indigenous Mayan Communities
In peri-urban and rural areas where Indigenous migrants live and work, COVID-19 infection rates are affected by social mobility, public health messaging, outreach strategies, and provision of services. In southern Florida, crowded housing and Indigenous farmworker mobility between urban enclaves and the rural agricultural belt pose a complex challenge. In rural Lincoln County, Oregon, Mam farmworkers were unresponsive to Spanish-language messaging.
On July 25, 2021 (day zero in the plots below), the Washington Post reported on the situation for Mayan farmworkers in Palm Beach County, Florida. The Guatemalan-Mayan population of around 80,000 has long been the backbone of the Florida farm labor force. Workers travel in buses to and from the workplace and live in conditions that promote the spread of COVID-19: Houses are rundown, a dozen or more people may share a single mobile home, and neither masks nor public health recommendations in Mayan languages were provided.
More than 30% of those Mayans tested returned a positive result for coronavirus. The governor of Florida singled out the “overwhelmingly Hispanic” day laborers as the major cause of the spread, overlooking the fact that many farmers are Mayan Indigenous peoples and not Hispanics. COVID-19 infection rates are unlikely to be reduced by racial profiling and public scapegoating of migrant workers as in Florida’s case.
In contrast, High Country News recently reported that public health officials in Lincoln County, Oregon, identified Indigenous migrant workers as being linguistically distinct from Spanish-speaking migrant workers. Officials partnered with Vive Northwest to adjust their strategy by changing communications and outreach from the Spanish language to the Mam language, based on primary language use. It was then possible to measure and trace COVID-19 infection rates among rural Indigenous migrants as hidden communities.
The New York Times COVID-19 database could be used to examine incidence rates (see Supplemental Material) for six counties with significant Mayan populations: two from the west (Los Angeles, California, and Lincoln, Oregon), two more central (Madison, Alabama, and Harris, Texas), and two along the East Coast (Palm Beach, Florida, and Fairfax, Virginia).
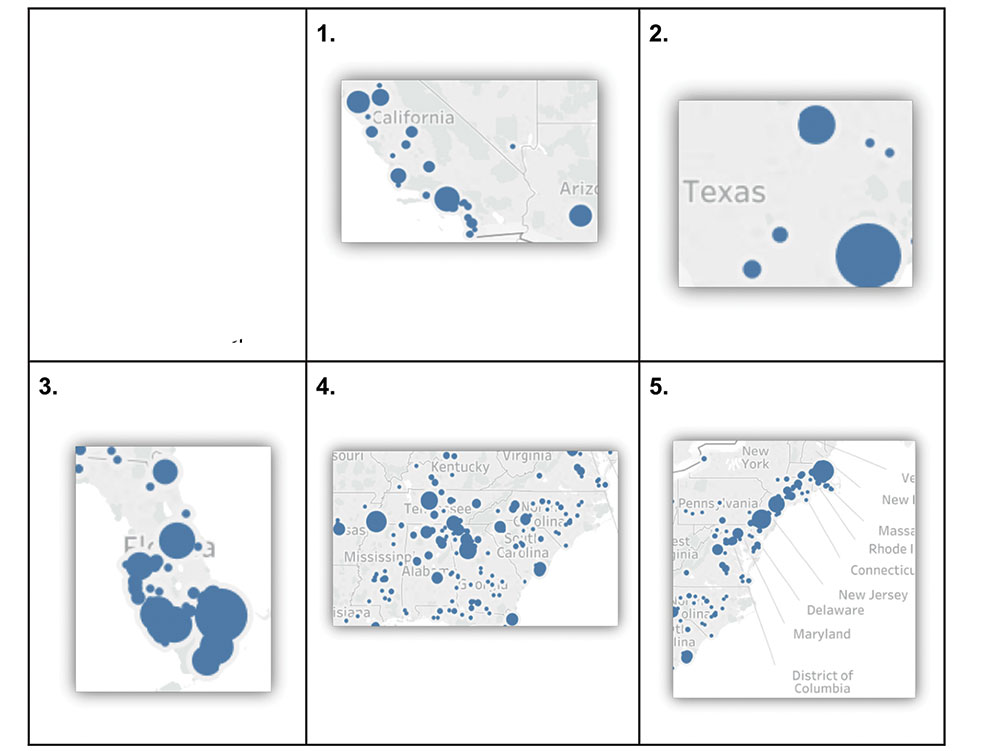
Figure 4. Proportional circle maps of Indigenous migration from Casa Alitas in Tucson, Arizona, to: 1. Phoenix, Arizona, and California; 2. Texas; 3. Southern Florida; 4. Appalachian and Piedmont regions; and 5. Northeast Megalopolis Corridor.
Table 3 summarizes significant aspects of the data. At the time of the Washington Post article, both Lincoln County, Oregon, and Fairfax County, Virginia, had daily incidence rates five to 10 times lower than the comparison counties.
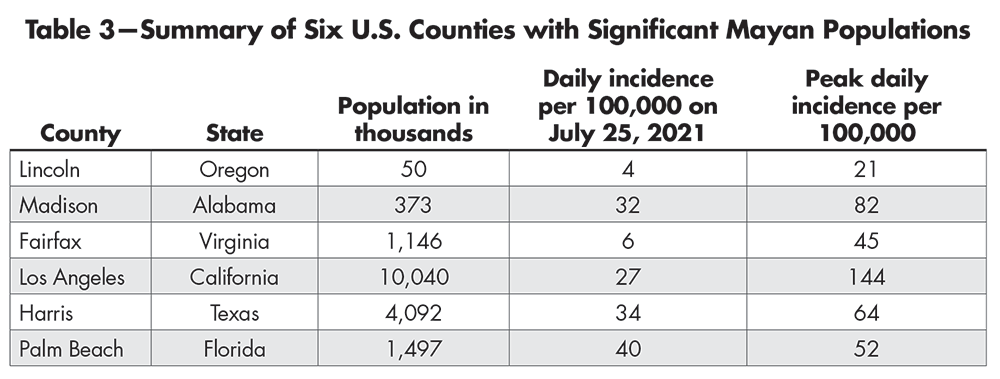
Table 3—Summary of Six U.S. Counties with Significant Mayan Populations
The New York Times lists the total number of cases each day, so the amounts for consecutive days were subtracted to determine the epidemiological or EPI curve (daily incidence as a function of the day). An EPI curve using the raw data is likely to be very jagged due to uneven reporting of the cases, especially on the weekends. Most news outlets use a seven-day running average to smooth the data.
The plots in Figure 5 used local regression, which makes a prediction of actual incidence by taking an averaging of the data with weights that decrease in moving away from the point of prediction. A span of 20% in the smoothing provides a good sense of the trends without being overly sensitive to local fluctuations in case reporting.
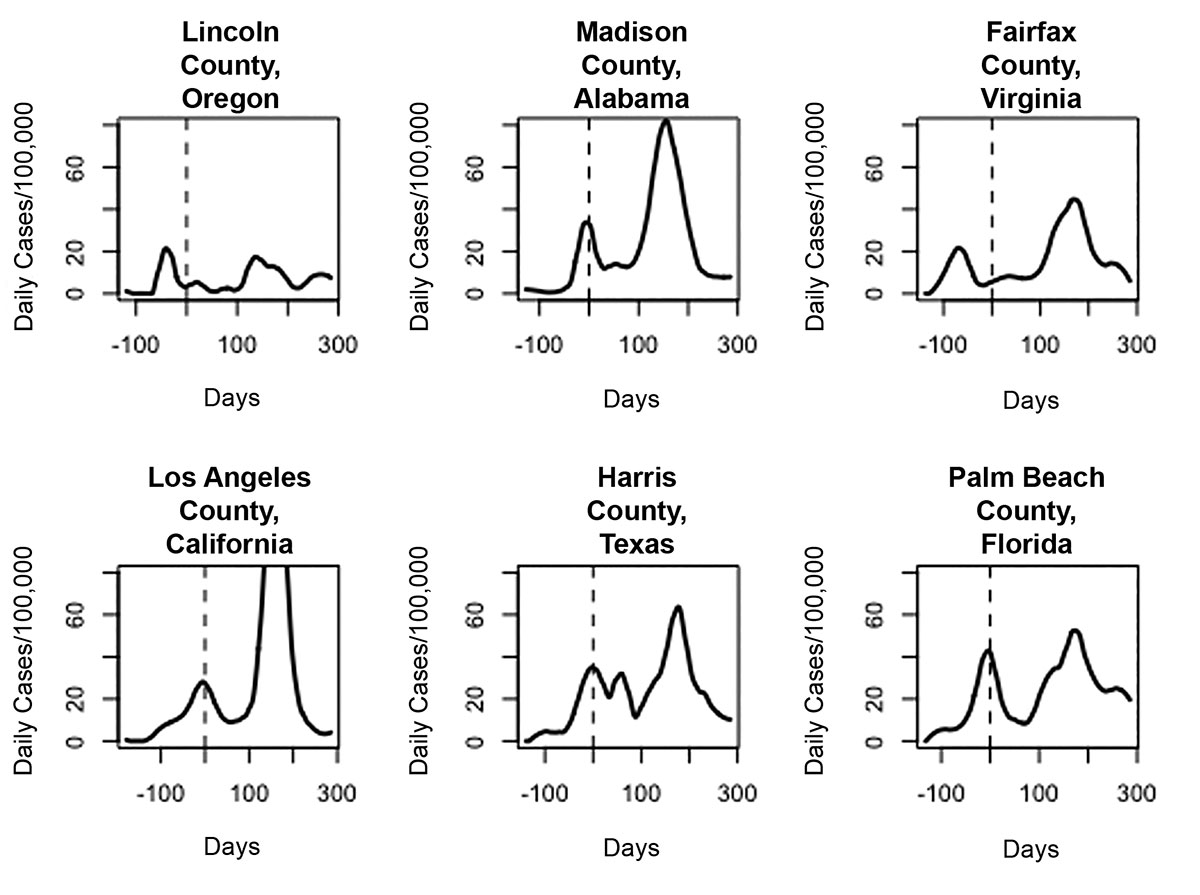
Figure 5. Epidemiological curves, daily incidence rate per 100,000 for six counties with significant Indigenous Mayan populations. Curves based on local regression smoothing with a span of 20% of the data. This is in contrast to the running seven-day average often reported in the press. Day 0 is July 25, 2020, to match report in the Washington Post.
All six counties experienced two distinct waves of infection. The first wave arrived several weeks earlier to Lincoln and Fairfax counties than to the other four counties. A vastly lower incidence of coronavirus infection rates can certainly be seen in the two counties where COVID-19 relief aid was provided to pockets of mostly Ixil and Mam Mayan peoples, often in their native languages and traditional dress.
A next logical stage for public health investigation is to understand how, and to what extent, these culturally based social interventions contributed to lower levels of incidence in these two counties.
A Final Thought
Health and well-being, as described in Article 25 of the Universal Declaration of Human Rights (UDHR), is a human right. Consequently, a ubiquitous public health data-collecting infrastructure that serves every community is a human obligation. The oft-repeated phrase during this pandemic, “No one is safe until everyone is,” has the precursor, “How do we know who needs help?”
A thorough reading of the UDHR leads to the centrality of public health in setting policy and engaging in the honest and informed conversations about inequity necessary to set policies that respect, defend, and fulfill human rights. This pandemic has shown how far we have fallen short of our obligations.
Further Reading
Aissen, J., England, N.C., and Maldonado, R.Z. (Eds.). 2017. The Mayan Languages. Philadelphia, PA: Taylor & Francis.
Deka, Mark A. 2019. The Geography of Farmworker Health: A Mixed-Method Exploratory Analysis of Chronic Disease. Dissertation, Texas State University.
International Mayan League. 2019. Indigenous Children are Dying at the US Mexico Border.
New York Times COVID-19 database.
Sieff, Kevin. 2020. For Guatemalans in Florida, essential work leads to a coronavirus outbreak. Washington, DC: Washington Post.
Smith, Anna V. 2020. A helpline connects Indigenous immigrants to crucial COVID-19 information. High Country News.
About the Authors
Blake A. Gentry (Cherokee) has degrees in Spanish, Latin American studies, and public policy. He directs the Indigenous Languages Office at the Alitas Shelter, is a designated campus colleague in Mexican-American studies at the University of Arizona, and is coordinator of the Development Commission of the National Council of Indigenous Peoples in Diaspora.
Marianne Richardson has degrees in Spanish, international studies, and public policy. After college, she worked in institutional development at Centro Educativo Providencia in Uruguay, and then as a chemistry teacher in Peace Corps Mozambique. She worked most recently with a team running testing sites, protective housing facilities, and mass vaccination sites for the City of Austin’s COVID-19 response.
Diego Piña Lopez has been at Casa Alitas Welcome Center, a shelter for asylum seekers in Tucson, for four years. He has worked his way up in the program, and is a second-year PhD student in public health, hoping to contribute to a recent immigrants’ national health resource network. In 2019, Piña Lopez received the National Association of Social Workers (NASW) Arizona region Emerging Leader of the Year award, and is currently on the NASW Arizona Board and co-chairing the Asylum task force of the Refugee Council USA.
Joseph Watkins is a professor in the Department of Mathematics and director of the Data Sciences Academy at the University of Arizona. He received his PhD in mathematics from the University of Wisconsin. His research training is in probability theory and he has collaborated with scholars in anthropology, biochemistry, bacteriology, computer science, linguistics, entomology, genetics, and physics. Watkins is working with a research team to consider new ways to model epidemics and the ramifications for timely and effective public health policy.


