
Benford’s Law and COVID-19 Data
Benford’s law states that in many sets of naturally occurring data, the first significant digit of an arbitrarily chosen data point is not equally likely to be 1, …, 9, as one might expect, but is rather closely approximated by the logarithmic law:
P(d) = log10(1 + 1/d) for d = 1, 2, …, 9 where d = the first significant digit. (1)
where P(d) represents the probability of the first significant digit d in an arbitrarily chosen data point. Figure 1 shows the values of these probabilities.

Figure 1. Probability distribution of the first significant digit for
Benford’s law.
Benford’s law was first discovered by Simon Newcomb in his 1881 work in the American Journal of Mathematics. When Newcomb used logarithm tables, he noticed how much faster the first pages in the bound tables were wearing out than the last pages. He deduced that numbers beginning with 1 were looked up more often than numbers beginning with 2, and numbers beginning with 2 were looked up more often than numbers beginning with 3, etc. Newcomb quantified his observation with a logarithmic law that gives the probability of occurrence for the first significant digit—now known as Benford’s law.
In 1938, Benford rediscovered the law in the Proceedings of the American Philosophical Society and was credited for it. He found that this logarithmic law was fairly accurate in many circumstances; for example, the numbers on the front pages of newspapers, lengths of rivers, stock prices, universal constants in physics and chemistry, numbers of inhabitants of large cities, and many other tables of numerical data.
In their 1979 work in the Journal of the American Statistical Association, Diaconis and Freedman gave convincing evidence that Benford actually manipulated some of the data he found, but the unmanipulated data were still a good fit.
One fascinating property of Benford’s law is that if a data set does, in fact, follow Benford’s law, then multiplying all the data by a mathematical constant will not change this fact.
Not all data sets follow Benford’s law. For example, phone numbers in a given area would not follow it because the area code is the same number. Another example would be the recorded times for the Olympic 1,500 m foot race, because none of these times would start with a 1.
In Benford’s Law: Theory and Applications (Princeton University Press. 2015), Steven Miller surveyed several real world applications. Topics include economics, sciences, and images. Benford’s law can also be used to detect manipulation of financial statements. It can even be used to detect tax fraud and is admissible in a court of law.
Results that follow Benford’s law are not limited to empirical evidence. Some results can be rigorously derived. Benford’s law has been known to appear in some number sequences. These sequences include the factorials and the powers of 2. Another sequence where Benford’s law shows up is in (ar)n where 1 ≤ a < 10, 1 < r < 10, and r is rational. Two integer sequences that Benford’s law does not hold for are the squares and the cubes.
Although none are used here, there are several ways to assess data set conformance with Benford’s law.
Benford and COVID-19
In the time of the COVID-19 pandemic, people are hesitant to believe that all levels of government are reporting complete and accurate data. Thus, it is a natural first step to see whether these reported data sets are following Benford’s law.
Data sets for COVID-19 tend to be a very good fit for Benford’s law. They include several categories of daily data from both the United States and the world. These findings also open up the possibility of Benford’s law being used in the future to assess the accuracy of reported sets of COVID-19 data.
A Look at COVID-19 Data
About the Data
The data analyzed for the United States in this article come from the COVID Tracking Project, and are available for download as a comma-separated value (CSV) file. The data in this file are organized by state (including U.S. territories), and by day, and broken down into several categories that are analyzed as: cumulative confirmed cases, cumulative confirmed+probable cases, new daily cases (confirmed+probable), cumulative deaths confirmed+probable, cumulative deaths confirmed, cumulative deaths probable, and new daily deaths.
The definitions for these categories can be found at the COVID Tracking Project’s website. The dates used for this analysis begin on January 22, 2020, and end on October 7, 2020.
The data analyzed for the world come from the World Heath Organization (WHO), and are available for download as a CSV. These data are organized by country and by day, and are broken down into four categories: cumulative cases, new daily cases, cumulative deaths, and new daily deaths. All four categories are analyzed here. The definitions for these categories are are available for download at the WHO website. The dates used for this data are from January 3, 2020, through October 7, 2020.
The data for the United States and for worldwide were kept separate for analysis.
Procedure
The data for the United States were aggregated daily across all states and territories for the given time period for the reported categories, while the data for the world were aggregated daily across all countries that reported data for the given time period in the reported categories. To compare these data sets with Benford’s law, the aggregated frequencies of the first significant digits (1–9) for each category within either the United States or the world had to be counted. We built and ran a computer program to do exactly that.
Results
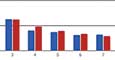
The tables show results for the first significant digits, 1–9, within their respective categories. The first row after the digits themselves is the frequency of the digits. The row after that is the distribution of the digits (cut off after 8 decimal places). The final row is the distribution of the digits according to Benford’s law (also cut off after 8 decimal places). The graph shows the distribution of the digits compared to a Benford distribution.

Figure 2. Distribution of cumulative confirmed cases—United States compared to Benford’s law.

Figure 3. Distribution of cumulative confirmed+probable cases—United States compared to Benford’s law.

Figure 4. Distribution of new daily cases (confirmed+probable) cases—United States compared to Benford’s law.

Figure 5. Distribution of cumulative deaths confirmed+probable cases—United States compared to Benford’s law.

Figure 6. Distribution of cumulative deaths confirmed cases—United States compared to Benford’s law.

Figure 7. Distribution of cumulative deaths probable cases—United States compared to Benford’s law.

Figure 8. Distribution of new daily deaths cases—United States compared to Benford’s law.

Figure 9. Distribution of cumulative confirmed cases worldwide compared to Benford’s law.

Figure 10. Distribution of new daily cases cases worldwide compared to Benford’s law.

Figure 11. Distribution of cumulative deaths—worldwide compared to Benford’s law.

Figure 12. Distribution of new daily deaths—worldwide compared to Benford’s law.
Discussion—United States
Cumulative confirmed cases, cumulative confirmed+probable cases, and new daily cases (confirmed+probable), which all have to do with amount of cases, all fit Benford’s law extremely well. Deaths, however, are not as cut and dried. Cumulative deaths confirmed+probable fit Benford’s law well in the sense that the percentages are close for each digit, and as the digit gets bigger, the percentages decrease strictly.
The argument can still be made that both cumulative confirmed deaths and cumulative probable deaths fit Benford’s law. However, these two categories definitely do not fit as well as the “case” categories in the United States and the cumulative deaths confirmed+probable, which combine these two data sets into one.
Discussion—Worldwide
At a first glance, it is safe to say that these four categories all follow Benford’s law for the world fairly well. This should not be a surprise, because these same categories followed Benford’s law in the United States.
One thing to note is that the frequencies of the digits are not decreasing strictly as the digit gets bigger for all of these categories. The first category this appears in is cumulative cases, where a 7 is more common than a 6. It also happens in cumulative deaths, where a 9 appears more than an 8.
Comparison of United States and Worldwide Data
The data that need further examination when comparing United States to world data are in the category of new daily deaths. Both sets of new daily deaths fit Benford’s law well for most digits, except the 1. In the United States data, the frequency deviates over 13% from what it should be according to Benford’s law. In the world data, the frequency deviates over 25% from what it should be according to Benford’s law.
Conclusion
Several sets of COVID-19 data, from both the United States and the world, follow Benford’s law. As countries report more and more COVID-19 data, it may be possible to use Benford’s law to see whether they are reporting accurate and complete data. Although some countries may not have the resources to test as many people, their data should still follow Benford’s law because of the scaling property. On the flip side, if countries want to make it look like their data are accurate and complete when that is not the case, they too can use Benford’s law.
About the Authors
Chase Marchand graduated from the University of Minnesota in December 2020 with a BA in mathematics.
Dalton Maahs is a fourth-year software engineering undergraduate at St. Cloud State University, with an additional background in computer science. He contributes to various free and open source software projects, and is passionate about creating software that is free (as in freedom) and accessible to everyone.


