
The Value of s at Which a Major League Player with Multiple Hitting Streaks of at Least s Games Might Be Termed ‘Streak Prone’

Thanks to his 56-game streak in 1941, Joe DiMaggio has been the poster child for the statistical analysis of consecutive-game hitting streaks. Multiple papers concede that DiMaggio’s streak is one of the most remarkable accomplishments in baseball history and is unlikely to ever be broken. What is rarely discussed is that DiMaggio’s next-longest streak was only 23 games. Over the course of baseball history, only two players (George Sisler and Ty Cobb) had two hitting streaks of at least 35 games, and these occurred in the pre-modern era. Since then, no one has had two 30-game streaks. While we agree DiMaggio’s streak is unlikely ever to be broken, we suggest it might be an equally long wait before Sisler and Cobb’s pair of streaks is matched.
From 1954 to 2009, the sample period that constitutes the database we use in our present research, there were 9,148 hitting streaks of 10 games or longer, accomplished by 1,709 players. Thus a 10-game streak is not an exceptional outcome, and many players have multiple streaks of at least 10 games. Chase Utley and Jimmy Rollins of the Philadelphia Phillies had 35- and 38-game streaks as recently as 2005 and 2006, but Rollins has no other 10-game streaks, while Utley added a 19-game streak in 2007.
Fifty-five players in our database had multiple hitting streaks of at least 20 games, but only one player, Pete Rose, had three streaks of at least 24 games. It would seem, then, that having multiple consecutive-game hitting streaks of at least s games in the range of 20 to 24 games is an exceptional accomplishment, albeit one that a select few “streak prone” players were in fact capable of achieving. The goal of this paper is to determine that point s, to give those particular players their due and pinpoint the skills that contributed to their success.
Our goal differs from the more traditional approach to the analysis of hitting streaks in which individual at-bats (AB) are viewed as a Bernoulli process in which a success is a hit (H) that occurs with a fixed probability that equals a player’s batting average (BA) on any given trial, so that given a sufficiently large event space of games with the potential of multiple trials in each game, it is inevitable that some player will manage a 56-game streak. From this view, DiMaggio, with a 13-year career BA of 0.325, would not seem to have been as good a candidate for the inevitability honors as, say, an Al Simmons who had a 20-year career BA of .334, but who had only four hitting streaks of at least 20 games and who peaked at 27 games in a season in which he batted 0.390.
Indeed, while nobody would call DiMaggio a one-year wonder, and, in fact, he too had four such streaks as mentioned earlier, none was longer than 23 games. Most assuredly, Sisler and Cobb, who had career BAs of 0.340 and 0.366 over their respective 15-year and 20-year careers, were better candidates. By contrast, Rose, with a 24-year career BA of 0.303 reached the 20-game mark seven times and his 44-game streak in 1978 stands second only to DiMaggio’s in the modern era. Only the still-active Ichiro Suzuki, with an 11-year career BA of 0.326 has matched Rose in having seven 20-game streaks.
With Rollins and Utley each having hit under 0.270 in 2011, which is essentially how they have performed since their halcyon days, we are quite confident neither player will ever be pointed to as an exemplar of a streak-prone player. But to whom can we point among contemporary players as more likely candidates?
The purpose of this article is to (a) isolate a set of batting characteristics that might serve to make one player more likely than others to eventually be judged to be a streak-prone player, (b) to develop a standard, s, by which that judgment would be made, (c) to list and rank the players in our sample that have met that s-game standard multiple times, and (d) to speculate as to which of the current crop of under-age-30 players seems best positioned to eventually earn a place on that list. Put otherwise, we provide a framework to answer the question of which young players appear to have the skill to tilt the process and the inevitability of outlier realizations in their favor—and more than once.
The Random Aspect of Hitting Streaks
“A consecutive-game hitting streak shall not be terminated if all of a batter’s plate appearances (one or more) in a game result in a base on balls, hit batsman, defensive interference or obstruction or a sacrifice bunt. The streak shall terminate if the player has a sacrifice fly and no hit.” That is Major League Rule 10.23(b), which goes on to say that the hitting streak is determined by the games in which the player appears rather than by those that the club plays, suggests some of the things that an analysis of the likelihood of a consecutive-game hitting streak must take into account.
Simmons, for example, a lifetime 0.334 hitter, was only called upon to sacrifice 111 times in his 5,586 plate appearances (PA); he walked only 615 times; and he was hit by the pitch only 30 times. Thus, 86% of the time he came to the plate, or 4,830 times, Simmons’ appearance concluded with a swing that might have started or extended or did or did not end a hitting streak. Moreover, Simmons only struck out 737 times in his career, so that 72% of his plate appearances resulted in swings that put the ball in play. That he had those aforementioned four hitting streaks of 20+ games is not very surprising.
Simmons is not unique. One can identify numerous batters in major-league history who on the surface would or would not seem to be potential candidates to produce lengthy hitting streaks, only to discover that they did not or did live up to that potential. To put the numbers into perspective, let p denote the probability that a PA will result in a concluding swing that might produce a hit. In the case of Simmons, this would be assessed at .334 x (4830/5586) = 0.289, or his adjusted batting average (ABA), which divides hits by PA rather than at-bats (AB), with his historical frequency serving as the proxy for the probability of a hit in any given PA. Assuming, somewhat heroically, that plate appearances are independent events in a Bernoulli batting process, the player that has m such hitting opportunities has a probability of P = 1- (1 – p)m of getting a hit in any one game. Thus, if Simmons had four such opportunities during a representative game in 1931 when his ABA was 0.355, the probability of his having gotten a hit was 1 – (.645)4 = 0.83.
So, at the start of the day, the odds of his extending his 27-game streak were about five-to-one, Indeed, even if he was under the weather or facing a Hall of Fame pitcher who reduced his probability of a hit to a meager 0.250, the odds of his extending the streak would have been 0.684/0.316, or better than two-to-one.
Let s denote the length of a streak, and, following the formula used in Don M. Chance’s CHANCE article, “What Are the Odds? Another Look at DiMaggio’s Streak,” the probability of an s-game streak over the course of n ≥ s games is:
P(n, s) = 1 – (1 – Px)/[(s + 1 – sx)(1 – P)](1/xn+1). (1)
where
x ≈ 1 + (1 – P)Ps + (s + 1)((1 – P)Ps)2. (2)
Thus, even a rather mundane batter who plays in 150 games and has a probability of, say, P = 0.7 of getting a hit in a given game, has a probability of P(150, 10) = 0.73 of having a 10-game hitting streak; appearances in only 100 games reduces the probability to P(100, 10) = 0.58, which, while much lower, still happens more than half of the time. Put otherwise, a 10-game streak for a player who plays most of the 162 games in a season for his team (henceforth called a “regular” [player]) would not earn him a place on a Hall of Fame ballot.
Indeed, during our sample period, 1,709 regulars had at least one single-season hitting streak of at least 10 games within either the American or National League, and, between them, they accumulated 9,148 streaks of 10 or more games. During this period, there were 47,389 regulars, most of whom appear multiple times.
In a 2007 article, “Major League Baseball Career Length in the 20th Century,” the average length of a Major League career is estimated as 5.6 years. Using this figure, and glossing over the fact that some of those regulars played in both leagues during the same season and are thus double-counted, a high-side ball-park estimate of some 47,389/5.6 = 8,462 players donned Major League uniforms in the sample period, of whom some 20% had one or more double-figure hitting streaks. Additionally, during this period, there were 1,504 streaks of 15 games or longer and 298 of 20 games or longer, but only 66 streaks of 25 or more games.
We examined 33 personal and performance statistics for those 1,709 batters to determine whether there is a systematic explanation for why players who hit in 10 consecutive games failed on the 11th try and so forth down the line. The data are weighted averages in that if a player had multiple streaks in a given year, his data were included that multiple number of times. Age is one of the variables. Half of the remaining 32 are player-performance statistics for the year, and half are their corresponding career statistics. The variables included in the latter set are: PA, walks, strikeouts, BA, ABA, the strikeout ratio (strikeouts divided by plate appearances), and balls put in play (i.e., AB less strikeouts, plus sacrifice flies). That year’s statistics for all Major League players, weighted by the number of 10-or-more-game streaks in each league, are also included. The omitted statistics are games played, at-bats, hits, slugging percentage, hit-by-pitcher, sacrifice bunts, and sacrifice flies.
An examination of these statistics over different years of the study reveals it is impossible to characterize players with 10-game hitting streaks. In a sense, given an opportunity to play, any major leaguer can do it. In 2009, for example, one player managed it in only 99 plate appearances, there was an 18-year spread between the youngest and the oldest achievers, and the BAs ranged from 0.223 to 0.365. One player struck out only 6.3% of the time, whereas another struck out a third of the time. One should not, however, infer too much from these statistics since, for example, the normality assumption for the age distributions can be rejected (α = 0.05 in a Shapiro-Wilks test) in 49 of the 56 years, and for BA it can be rejected in 27 years.
We remark en passant that the normality assumption commonly cannot be rejected when streaks of at least 15 games are considered, which might be due to smaller sample sizes ranging from 13 in 1955 to 42 in 1999 and 2003. Moreover, a logit analysis compelled the conclusion that there is no systematic explanation for why players that hit in 10 consecutive games failed on the 11th try and so forth down the line.
Streak-Prone Players
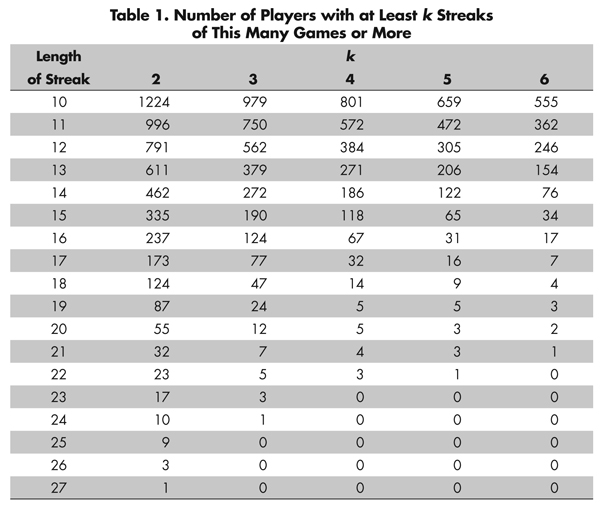
Although 1,709 players had double-digit hitting streaks, only 1,224 managed to do it more than once. Despite its ubiquity, a double-digit streak was indeed a singular accomplishment for 28.4% of the players. But about one-third of them, or 555 players, did it more than five times. Raising the bar to 15 games reduces the number of over-achievers to 725, but only 2% of them, or 34 players, did it more than five times. The distribution of the number of players with multiple streaks is given in Table 1.
We now first explore whether there is anything in the career statistics of these players that would help us identify batting characteristics that make some more prone than others to hit in consecutive games and consider what would be an appropriate standard of excellence that would distinguish the most streak-prone players from their brethren, just as DiMaggio’s streak sets him apart from Sisler and his most recent challenger, Rose, and attempt to identify their batting characteristics.
Batting Characteristics of Streak-Prone Players
To get a hit in at least 10 consecutive games, a player must have gotten at least one hit in the preceding nine games. Let Yj(s) = k ≥ 0 denote the number of times that player j (j = 1, …, 1709) hit in at least s consecutive games during the sample period. Thus, for example, Yj(10) > 0 for all j, since each player in our data base hit in at least 10 consecutive games during our sample period, and Yj (11) > 1 for 1,224 players, since 485 of the 1,709 failed to hit in the 11th game on the heels of their 10-game streaks.
We hypothesize that, for any s > 10, Yj (s) will be an increasing function of the players’ longevity and the number of opportunities they had to extend their streaks, which implies the number of games in which they appeared and the number of times they batted, for all players that hit in ten consecutive games. Hitting ability will also come into play, with greater batting proficiency hypothesized to increase Yj(s), for any s, unless player j’s batting skills induced a substantial number of walks, or when otherwise proficient batters are also susceptible to the strikeout.
We considered the following length-of-career variables for each player: the number of games he played (G) and his PA, his hits (H), and his strikeouts. As performance variables, we considered hits per game and career BA and ABA. We also defined two additional measures to account for strikeouts and walks: in-play at-bats, or at-bats less strikeouts, divided by at-bats, and adjusted in-play at-bats, or in-play at-bats divided by plate appearances.
Let X denote a vector of these variables. We initially estimated both linear and log-linear forms of the function Yj(s) = f(Xj) for s = 10,…, 22 and subsequently, in recognition of the fact that Yj (s) is a count variable, we also estimated both Poisson and negative binomial functions. In the process, based on both statistical significance (α = 0.05) and variance inflation factors (VIF ≥ 5), we reduced our final set of candidate variables to X1 =PA/1000, X2 = H/G, and X3 = ABA.
The variance of Yj (s = 10) is more than six times greater than the mean, with the ratio falling as s increases to less than three for, say, s = 15. In addition, the estimated and positive negative binomial dispersion factors, although close to zero, allows us to reject the hypothesis (α= 0.05) that they are equal to zero. This suggests the negative binomial would be a more appropriate fit to the data than a Poisson model. Nonetheless, we fitted both models to the data. In doing so, however, we paid due obeisance to the fact that, for s > 10, there are a relative excess of zeros in the data. Indeed, when s = 14, 48% of the values are zeros, and for s = 15, only 42% are non-zeros. We therefore employed a zero-inflated estimation procedure.
For s < 14, we still reject the hypothesis that the negative-binomial dispersion parameter is equal to zero, but this is no longer the case for s ≥ 14. Similarly, for s < 14, the accompanying Akaike Information Criterion (AIC) is smaller for the zero-inflated negative binomial than that for the Poisson, further suggesting that the former is the more appropriate distribution to fit to the data, at least for s < 14. The estimated parameters for both zero-inflated distributions, all of which have p-values of less than 0.0001, are shown in Table 2, along with the AICs. As seen in the table, the estimates for the negative binomial do not differ substantially from those for the Poisson model, and indeed are virtually the same as those for the Poisson when s =14, and so we confine our discussion to the former.

Since the hitting-streak task becomes more difficult as s increases, the intercept estimates get smaller (larger negative values), reflecting a smaller expected number of successes as s increases. As would be expected intuitively, all slope coefficients are positive: that is, having more opportunities to hit, getting more hits per game played, and having a higher adjusted batting average over the course of a career, increases the expected number of times a player that has hit in at least 10 consecutive games will register a hitting streak of at least s games, for any s ≤ 15. Moreover, and this is the critical point and the sole reason for running the regressions over successive values of s, the estimates for the ABA coefficient consistently increase from the initial value of 5.3443 for s = 10 to 12.3635 for s = 15. The latter implies that career-long hitting ability increases in relative importance to opportunity when it comes to extending a hitting streak and doing so multiple times, as we consider longer and longer hitting streaks.
For example, a representative player in our sample had an average of 4,109.7 career plate appearance, registered 0.8448 hits per game, and had an adjusted batting average of 0.236. For that player, the expected number of times he would have hit in at least 10 games is estimated to be exp(-2.4601 + 0.1766*4.1097 + 2.1336*0.8448 + 5.3443*0.236) = 2.99. That is given that an “average” player has hit in 10 consecutive games, he can be “expected” to accomplish the feat about twice more during his career. But how many times is that player “expected” to hit in at least 11 consecutive games? The answer is exp(-3.36024 + 0.1781*4.1097 + 2.5422*0.8448 +5.8893*0.236) = 2.48. Similarly, the representative player that has hit in 10 consecutive games will hit in at least 15 consecutive games an expected 0.51 times.
Suppose, however, that player was to play two additional seasons in which he clocked 1000 PA. This would increase the expected number of times he would have hit in at least ten games by a factor of 100*[exp(0.1766) – 1] = 19%, with the figure increasing to 20% for s =15. But rather than playing two more seasons, suppose the player had managed the rather modest accomplishment of getting one additional hit in every 100 plate appearances, or approximately 0.04 additional hits per game (assuming a mean of 4 PA per game). Concomitantly, the player’s ABA would increase by 0.01. The result would be to increase the expected number of times he would have in 10 consecutive games by 15%, which rises to 28% for a streak of at least 15 games. Thus, the expectations for a marginally better batter extending a streak are, as one would hypothesize, not simply greater than those for his trivially inferior counterpart, but the spread between them increases with the length of the streak. Extending the analysis to s = 20 only reinforces this conclusion. For example, the respective zero-inflated negative binomial (Poisson) estimates for PA/1000, H/G, and ABA are 0.1763 (0.1703), 3.7707 (2.6795), and 17.9813 (28.5864).
The broad inference, then, is that making the task at hand more difficult, albeit modestly, allows fewer players to accomplish it even once, to say nothing of more than once. Given enough opportunities to do it, however, which implies having a long career—and particularly a career in which the player has exhibited batting prowess—the latter increasingly becomes the dominant factor in determining which players can be classified as being streak prone.
The Elite Among the Streak-Prone Players
In Human Accomplishment, Charles Murray theorizes that there are giants in the arts and sciences, as well as in sports, whose accomplishments achieve standards of excellence that place them heads and shoulders above others in their field. And the more difficult the task they are asked to accomplish, the greater is the extent to which they distinguish themselves. Thus, for example, when it comes to winning one of golf’s four major tournaments, Jack Nicklaus stands tall. That is, many golfers have won one or two majors—with 43-year-old Darren Clarke winning his first such, the 2011 British Open, after more than 20 years on the tour and 54 attempts—but none save Tiger Woods, now stalled at 14, approach Nicklaus’s 18 majors.
Murray describes the phenomenon through the Lotka curve, an exponential function of the form y = az-b, where y, the percent of the playwrights or golfers, say, that have written a great play or won a PGA tournament, declines at a decreasing rate as z, the number of great plays or tournaments they have written or won, increases. The more difficult the task, winning a major versus winning a tournament, the steeper is the Lotka curve.
As seen from Table 1, the number of players with four or more streaks of s games becomes very small when s > 19. Our initial inclination was to set what is necessarily an arbitrary bar for hitting-streak excellence at a level that would have led the Majors Leagues in some year during the sample period, or s ≥ 20.
From Table 1, it is seen that 55 players accounted for 43×2 + 7×3 + 2×4 + 1×5 +2×6 = 132 of the 307 streaks of at least 20 games. Hence, 175 additional players accounted for the remaining 175 streaks, with one apiece; or 76% of the qualifying players accounted for 173 of the streaks, while two players, or 0.87%, accounted for 12 streaks. Raising the bar to s ≥ 21 and repeating the computations, 82.2% of 180 qualifying players accounted for 148 of 227 streaks, while 0.57% of the players, notably Rose, accounted for six streaks. For s ≥ 22, 83.8% of 142 qualifying players accounted for 174 streaks, and 0.70% of the players, Rose, accounted for five streaks. Once we extend the criterion for excellence to at least 23 games, however, 84.3% of 108 players account for 91 streaks and 2.78%—Rose and two other players (Nomar Garciaparra and Suzuki)—account for nine streaks. That particular task is seemingly too difficult for the purpose at hand. Looking at the raw data, the s ≥ 22 mark would appear to yield the most clear-cut nonincreasing curve: 119 players hit the mark once and 18 hit it twice, which makes it a feasible achievement, but, to distinguish themselves, only two players (Vada Pinson and Suzuki) did it thrice, two others (Henry Aaron and Garciaparra) did it four times, and Rose, stands alone, having done it five times. How, then, do these five players stand in terms of the three factors that the Poisson and negative binomial analyses isolated as being the statistically significant variables in the regressions?
Table 3 shows, for the five standouts, the number of standard deviations above the 1,709-player means, or the z-scores, of their career statistics, for PA, hits per game, and ABA, as well as their predicted zero-inflated Poisson (ZIP) scores for 20 games, noting there is virtually no difference between these Poisson estimates and those for the negative binomial. These statistics highlight the fact that Suzuki, who at the time of data collection and initiation of the writing of this paper was the lone full-time player among the elite, earned his place on the list by virtue of being head and shoulders above the rest as a great hitter, both in terms of hits per game and ABA. It is not out of the question that he might yet surpass Rose and define a new standard of excellence in streak hitting.
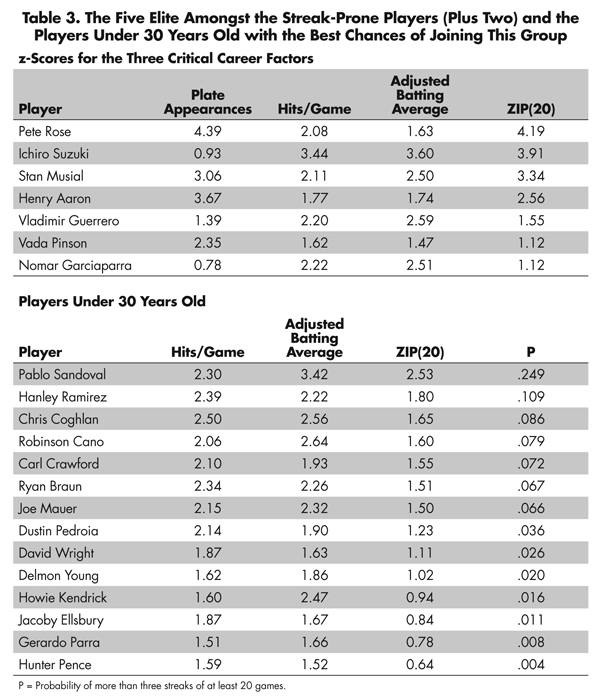
Suzuki and Garciaparra are players who had relatively few PA when judged by the standards of the other three, all of whom earned their positions by virtue of being both excellent hitters and, especially in the case of Rose, having a lot of batting opportunities. We might also remark that while he failed to do so during our sample period, although he was included in our sample, Stan Musial hit in at least 22 consecutive games three times during his distinguished career, all prior to 1954. His comparable statistics are also included in the table. Finally, among still active players, only one (Vladimir Guerrero) achieved the s = 22 mark twice, though his statistics stack up well against those of the other six players.
We also include in Table 3 a list of 14 players who at the time of the data collection were under 30 years old, had already recorded at least one hitting streak of 10 games or longer, and had z-scores of at least 1.5 for both hits per game and ABA. We have predicted their ZIP scores by extending their PA totals by 600 per year through the age of 35 and listed the results from highest to lowest. During our sample period, only five players had more than three streaks of at least 20 games, so we have also estimated the probability that the player would join this elite group. Pablo Sandoval, Hanley Ramirez, Carl Crawford, Chris Coghlan, and Robinson Cano top the list, but none of the player’s predicted ZIP scores approach those of Rose, Aaron, Musial, or Suzuki, and only Sandoval and Ramirez have a better than 10% chance of having more than three streaks of 20 or more games. Collectively, there is almost a 60% chance that at least one player will hit this milestone.
While these players should have ample opportunity in the future to have prolonged hitting streaks and bear watching, we will not be surprised if no one can approach the multiple streak events of the top players. We note that David Wright had a 30-game streak in 2009, and Ryan Braun, Dustin Pedroia, Hunter Pence, and Pablo Sandoval all had streaks of at least 22 games during the 2011 season.
Our analysis suggests that, rather than there being solely some stochastic process that determines one’s position on the Lotka curve, that position is at least partially dictated by tangible factors, which, in the case of hitting streaks, are longevity and hitting ability, as well as intangibles that we have not even attempted to identify.
Conclusions
On July 15, 2011, a lead story on ESPN’s “SportsCenter” was about the end of two hitting streaks: 23 games (Braun) and 22 games (Sandoval). At the time, the longest current streak after these two was 13 games by a player with whom many may not be familiar (Emilio Bonifacio). Two weeks later, on July 28, the MLB Network featured a segment in which their analysts dissected the respective and ongoing 26-, 25-, and 19-game streaks of Bonifacio, Pedroia, and Dan Uggla (the first player in MLB history to have a 15-game streak while hitting under .200), with the analyst/expert summing up with an explanation of why Pedroia was the best candidate to keep his streak going far into the 30s and perhaps beyond. Is this a case of overhyping three streaks that had yet to reach the halfway point of DiMaggio’s?
The phenomenon of hitting streaks is such that a large number of players accomplish one of at least 10 games at some point in their career. Until one gets past 20 games, however, it can happen with players who are not otherwise noteworthy for their season or career batting averages. Yet it is a relatively rare occurrence once we get past 20 games, and only a relatively small percentage of players have multiple streaks of more than 21 games. Since 1954, only one player (Ron LeFlore, never mentioned in Hall of Fame discussions) has had two streaks of 27 games or longer. Why has this proven to be such a rare occurrence?
Even the quintessentially consistent hitter will have his good days and his bad days, and his good at-bats and his bad at-bats, the realities of a Bernoulli process aside. Adding further uncertainty to the batting process, bats are prone to splinter, which will ordinarily reduce the probability of a hit, notwithstanding the occasional broken-bat single. Further, something as common as a managerial strategy that dictates an intentional walk or “pitching around” a batter can halt a hitting streak in its tracks. And, the micromanaging of changing relief pitchers with almost every batter at the end of a close game to have lefty/lefty or righty/righty matchups can reduce the odds still further.
The luck that accompanies a hitting streak extends well beyond baseball’s being a game of inches, and the irresistible temptation to think of a hit as being the successful random outcome of a Bernoulli process. Yielding to the temptation, in “What Are the Odds? Another Look at DiMaggio’s Streak,” Chance speculates as to why players such as old timers Cobb, Rogers Hornsby, and Joe Jackson, as particular prime candidates, failed to match DiMaggio’s streak, with Simmons estimated to having had a 0.001142 probability of doing so. Recent articles suggest that hitting streaks “aren’t just by-products of random variation” and a player in the midst of a streak changing his approach to batting or to the contrary, as to a misconception of chance in the generation of sequences.
But surely there is some element of skill involved, skill that extends beyond what data reveal. Glenn Beckert, never considered an elite player by the experts, was a lifetime 0.283 hitter who averaged 1.116 hits per game over the course of a nine-plus-season career in which he twice recorded the longest hitting streak in the National League: 27 games in 1968 when he batted 0.294 and 26 games in 1973 when he batted 0.255. His signature year was 1971, when he hit 0.342. That year, he peaked at two 10-game hitting streaks. Some “magic” was at work for Beckert in 1968 and 1973, magic that went missing the rest of his career. Magic, however, is not what denied Beckert recognition in Table 3, as his hits per game and ABA average essentially mirrored those of Pinson. Beckert’s problem is that he made only a little more than half of Pinson’s PA.
We have attempted to identify a set of younger players whose batting statistics suggest they have the skills to join the elite group of seven streak-prone players we identified as having pushed forward the boundaries of excellence by hitting in at least s = 22 consecutive games on at least three separate occasions. Several have already had an initial streak of 22 or more games. Time alone will tell whether any of these younger players will enjoy sufficiently long careers as to fully exploit their potential for doing so, whether any will wilt under the pressure of being labeled “the next Pete Rose,” or whether any will rise to the occasion, viewing it as a motivating factor and do so several times during their careers. We look forward to following their efforts over the coming decade and, we confess, to basking in their success when they justify our high expectations for them.
Further Reading
Albert, J. 2008. Streaky hitting in baseball. Journal of Quantitative Analysis in Sports 4(1), Article 3.
Chance, D.M. 2009. What are the odds? Another look at DiMaggio’s streak. CHANCE 22(2):33–42.
Gilovich, T., R. Vallone, and A. Tversky. 1985. The hot hand in basketball: On the misperception of random sequences. Cognitive Psychology 17(3):295–314.
McCotter, T. 2010. Hitting streaks don’t obey your rules: Evidence that hitting streaks aren’t just by-products of random variation. CHANCE 23(4):52–57.
Murray, C. 2003. Human accomplishment. New York: HarperCollins Publishers.
Rockoff, D., and Y. Yates. 2011. Joe DiMaggio done it again … and again and again and again? CHANCE 24(1):14–18.
About the Authors
Ira Horowitz is a graduate research professor emeritus in the information systems and operations management department in the Warrington College of Business Administration at the University of Florida and a perennial summer faculty adjunct in the management information systems department in the college of business administration at San Diego State University. His most recent research has focused on energy issues and sports economics.
Jim Lackritz is emeritus associate dean and emeritus professor of management information systems in the college of business administration at San Diego State University (SDSU). He is a sportsaholic who is the faculty co-founder of the SDSU sports MBA program and a member of the Sports Management Research Group at SDSU. He conducts research on statistical modeling in baseball, basketball, and golf.
What is the average hitting streak? 2 games?