
To Fund or Not to Fund: Using Bayesian Networks to Make Decisions About Conserving Our World’s Endangered Species
 Making a decision to invest in the conservation of a species is a complex process. The factors involved and interactions between these factors may depend on the perspective of the decisionmaker and particular characteristics of the species in question. While some factors that affect the decision are based on factual information relating to biology, costs, and benefits, others are based on individual or collective judgments and inclinations. Conservation planners are in the unenviable position of having to decide how to divide limited resources among many deserving causes, often with limited information.
Bayesian Networks (BNs) provide a flexible framework for both the conceptualization and quantification of decision processes, but have hitherto not been widely applied to conservation decisions. The probability of investment in the conservation of a species can be characterized in terms of a set of factors linked in a potentially complex, directed manner and probabilistically quantified by available data on those factors, expert opinion, and other sources of information.
BNs were introduced by Judea Pearl in his 1988 book, Probabilistic Reasoning in Intelligent Systems: Networks of Plausible Inference. They are now used in a variety of applications—from Johnson and colleagues’ 2010 marine environmental research paper modeling algal blooms in ecology to Farr and colleagues’ 2011 ABNMS conference paper modeling way finding in airports.
A BN can be used to interrogate factors in terms of their influence on the response of interest, identify information gaps, prioritize research and resource activities for more targeted understanding of the response, and evaluate ‘what-if’ scenarios. As such, they could be a useful addition to the set of tools used by conservation planners.
There are many ways in which BNs can be conceptualized and developed in the statistics and machine-learning disciplines. For example, BN models are often used to structure large amounts of data to discover relationships between variables. This approach of ‘learning’ a BN based on data—such as that discussed by Heckerman, Geiger, and Chickering in their 1995 machine learning paper—is useful when relevant data are available. This is in contrast to the expert-elicited method considered here, which is useful when hard data are sparse. In this case, the structure of the network and the parameters of the conditional probability tables are typically obtained from experts first, then the states of internal nodes are updated using data where available and from expert-elicited conditional probabilities otherwise.
At an international workshop held in London, two BNs were developed with the aim of deciding whether to invest in the conservation of a species. The BNs were independently developed from different perspectives: a government official and an inter-government organization (IGO) official for the first and a non-government organization (NGO) representative for the second. The species-independent components of the BN were quantified by two of the three experts, and the species-specific components were quantified by an expert group of 13 ecologists for a species in their area of expertise.
The objectives of the study were to examine the utility of BN models to answer two questions:
1. How do different decisionmaking perspectives affect the decision to invest in a species?
2. Among a set of species, what is the priority listing for conservation under the different perspectives and, importantly, is there a common set of prioritized species that would satisfy both perspectives?
What Did We Do?
Two BN models were built with an overall outcome node of “invest in the conservation of a species” (yes/no) linked by directed arrows to a set of factors (nodes) representing considerations related to this decision. Each node was categorized by the expert as a set of states (e.g., high/medium/low, yes/no). The nodes were classed as species-specific and species-independent. The two BN models were then discussed in the workshops and one was chosen to progress to the quantification stage. The species-independent nodes of this BN were then quantified from two perspectives: a government opinion (denoted hereafter as BNG) and a non-government organization (BNNGO).
Experts from around the world, representing a wide variety of taxonomic groups, were then asked to identify a species of conservation concern in their area of expertise and complete a questionnaire designed to elicit the required probabilities for the species-specific factors in the BN. The panel chair (BC) reviewed all submitted questionnaires for completeness, consistency, and commentary and followed up with experts as necessary. BNs were then completed for each species.
The 13 target species identified by the experts comprised the pygmy hippopotamus (Choeropsis liberiensis), Scottish primrose (Primula scottia), white-backed vulture (Gyps africanus), chacma baboon (Papio ursinus), European freshwater crayfish (Austropotamobius pallipes), straw-colored fruit bat (Eidolon helvum), large blue butterfly (Maculinea arion), Bornean orangutan (Pongo pygmaeus), polar bear (Ursus maritimus), freshwater crab (Potamonautes pilosus), okarito brown rowi (Apteryx rowi), Sumatran tiger (Panthera tigris sumatrae), and kihansi spray toad (Nectophrynoides aperginis).
What Did We Find?
The resulting factors and their definitions are given for both BNs in tables 1 and 2. The conceptual Bayesian Network models constructed by the two experts (E1, E2) are shown in Figures 1(a) and 1(b), respectively.

Table 1. Factors Included in BN (E1), Used for BNG, BNNGO, Where the Response ‘Invest in conservation of this species? (Yes/No)’ Depends on Urgency, Cost of Investment, Chance of Success, and Biological Value
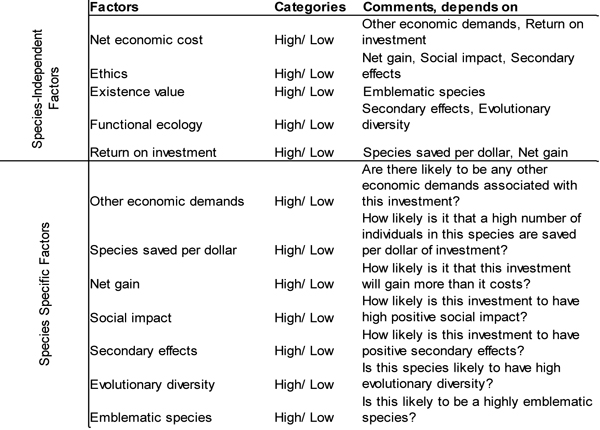
Table 2. Factors Included in BN (E2), Where the Response ‘Invest in conservation of this species? (Yes/No)’ Depends on Economics, Ethics, Functional Ecology, and Existence Value

Figure 1(a). Conceptual Bayesian network (E1). Circles represent nodes, while arrows represent associations between nodes. Operational definitions and states of nodes can be found in Table 1.
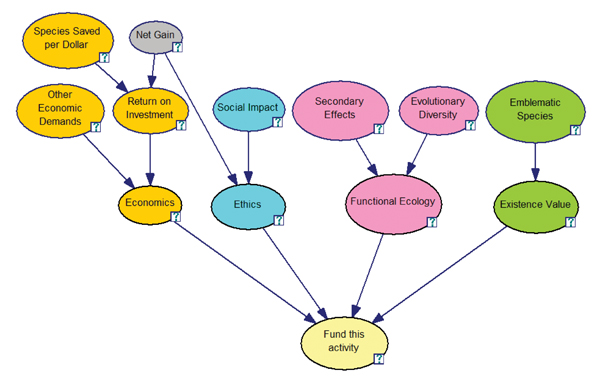
Figure 1(b). Conceptual Bayesian network (E2). Circles represent nodes, while arrows represent associations between nodes. Operational definitions and states of nodes can be found in Table 2.
The first BN (E1) was the one chosen to progress to quantification based on expert opinions of validity. This included 10 species-independent factors and 18 species-dependent factors, which reflects the complexity of the decisionmaking process for those involved with conservation funding. In contrast with the second BN, many factors in this network concerned the support received from outside sources, such as political, community, and government. Also of note is the presence of nodes regarding the complexity of the system surrounding the species, such as ecological and geographic complexity that did not feature in the second BN.
The quantification of this BN from the government (BNG) and non-government organization (BNNGO) perspectives differed only with respect to the conditional probability table (CPT) for the response, Invest in this species (Yes/No). It was argued that the other nodes were based on biological, scientific, political, and ecological considerations, so were outside the scope of the funding decisionmaker.
The perspective of the decisionmaker was thus confined to the relative prioritization of factors directly affecting the response node: Urgency (how soon will this species be extinct), Cost of investment, Chance of success, and Biological value, which we consider separately below. Other nodes from the original structure were used to refine the definitions of the nodes that were ultimately quantified by the experts.
Quantification of the confined E1 network based on the NGO perspective led to the lowest probability of investment in the species in all situations except for low urgency, unlikely to succeed, low value species requiring either high or low investments, or in scenarios where there is low urgency but high chance of success, cost of investment, and biological value. In those situations, the BN quantified from the NGO perspective revealed a marginally higher probability of investing in the species than that obtained from the government perspective.
The probabilities obtained for each of the 13 species are depicted in Figure 2(a)-(d), based on both the BNG and BNNGO models. Inspection of these plots revealed the following about the roles of urgency, chance of success, cost of investment, and biological value in conservation decisions.
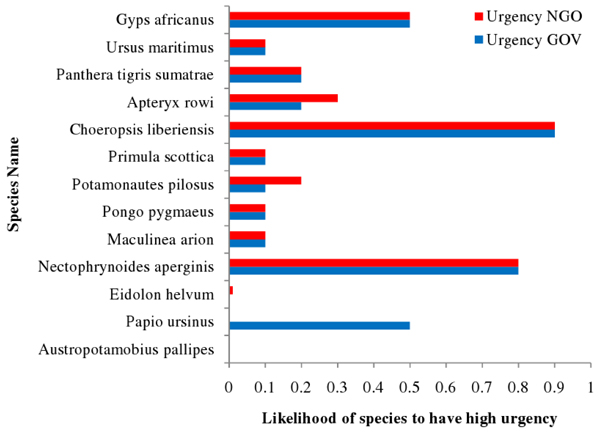
Figure 2(a). Comparative likelihood of a species having high urgency
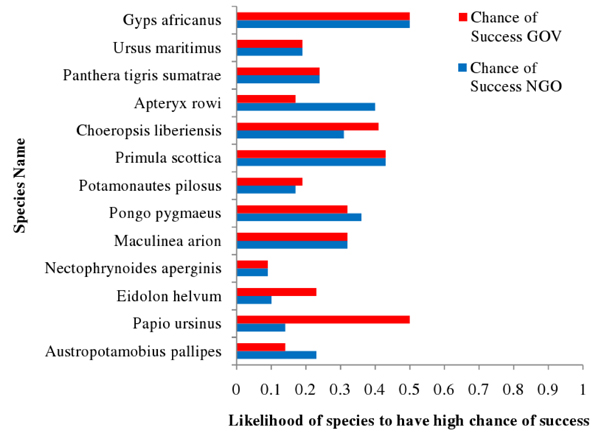
Figure 2(b). Comparative likelihood of a species having high chance of success
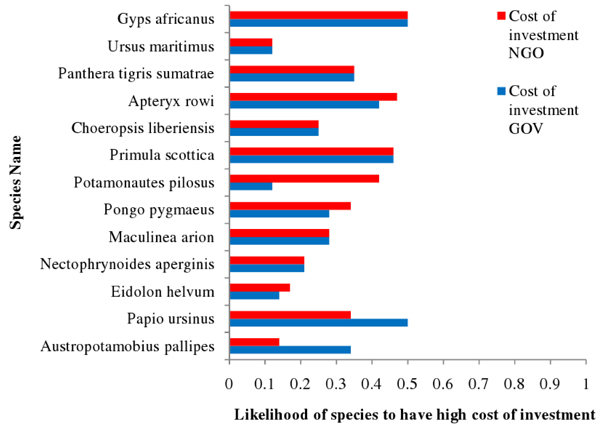
Figure 2(c). Comparative likelihood of a species having high cost of investment
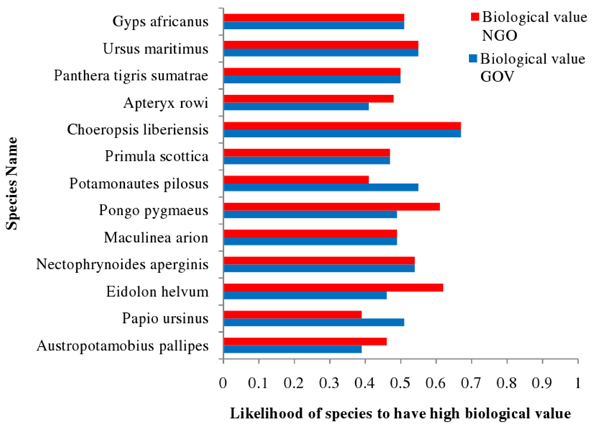
Figure 2(d). Comparative likelihood of a species having high biological value
Urgency: For both BNs, in scenarios in which the highest probability of investment would be expected based on all other included dimensions (i.e., low cost, high value, and likely to succeed species), high urgency increased the probability of investment from 90% in the low urgency scenario to 100%. Similarly, in scenarios where the lowest probability of investment would be expected based on all other included dimensions (i.e., high cost, low value, and unlikely to succeed species), high urgency increased the probability of investment from 0% in the case of the government network or 1% in the case of the NGO network to 10% probability of investment for both governments and NGOs. Thus, in situations with high certainty, urgency accounted for around 10% of the probability of investment. In particular, high-value and high-cost species were 60% more likely to receive investment (probability = 0.8) when the urgency is high (extinction within three years) than when urgency is low (decades) (probability = 0.2).
Chance of Success: This was an important species-independent factor because it expresses how effective the other factors might be in preventing the extinction of that species. The effect of chance of success was greatest in the NGO network when the cost of investment was low and biological value was high, regardless of urgency.
Cost of Investment: This had no discernible effect on probability of investment within either network when there was a low chance of success and low biological value of the species, regardless of urgency. The BNG revealed a 10% higher probability of investment when cost of investment was low in the context of species with low urgency, and a 30% increase in probability of investment when cost of investment was low and urgency was high.
Biological Value: The largest difference in probability of investment between the two models BNs was obtained when urgency, chance of survival, and cost of investment were all low. In this scenario, a change in biological value from low to high increased the probability of investment in the species by .2 in the BNNGO network and .8 in the BNG. For species with a high chance of survival and low cost of investment, there was no interaction between urgency and biological value; under both models, the probability of investment in a species with high biological value was 0.7, regardless of urgency.
Comparison of the Overall Probabilities
The overall probability of investing in one of the 13 target species is given in Table 3 for each of the two BNs (BNG, BNNGO) and depicted in Figure 3. The government perspective discriminated between species slightly more than the NGO perspective, with the former network assigning more discrete rankings than the latter, which ranked many species equally. Despite weighting the factors differently, both networks ranked each species similarly.
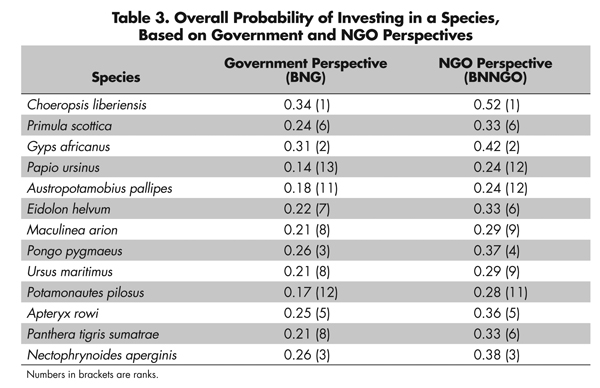
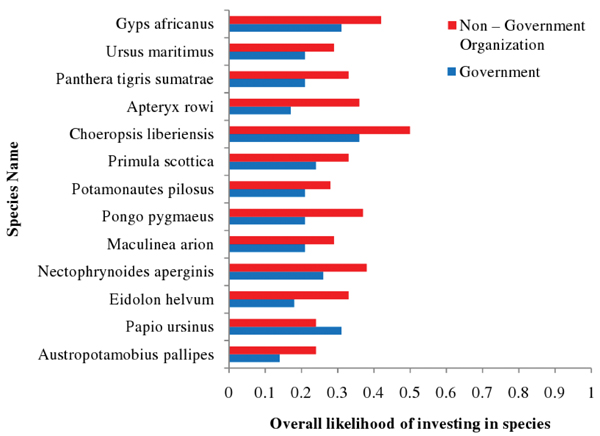
Figure 3. Comparative likelihood of investing in a species
So What?
The primary focus of this analysis was to determine whether different conceptual frameworks lead to different decisions. The BNs analyzed in this paper were constructed through discussions with an international panel of experts representing a range of perspectives. The similarities and differences between the networks indicate the different decisionmaking processes used by different experts. The BNs represent how experts make conservation decisions, rather than being based on a framework of metrics. In other words, while one expert may deal in budgets worth thousands and another worth millions, each will make a decision on whether they think the cost is high or low relative to the other budgets they have dealt with in the past.
The difference in complexity of the network structures obtained from the government/NGO and IGO perspectives is somewhat mitigated by the complexity of the definition of the nodes. Government support is explicitly recognized as a factor in one BN (E1), but implicitly accounted for in the second BN (E2) by including ‘other economic demands.’ The inclusion of this node implies a negative decision to invest in a species may result in a positive decision to invest in another species.
Our results showed urgency to be a critical factor in conservation decisions, as high urgency means lack of investment could lead to species extinction. It therefore follows that for species classified as urgent, one might expect high cost will matter less than cases for which the investment can be deferred and higher cost investments should be made for urgent cases, although the reverse (low cost for non-urgent) may not apply. This expectation is supported by the results of the quantified networks.
Conversely, cost of investment interacts in a different manner to urgency and chance of success. In some scenarios, the node has no effect on probability of investment at all; in others, it affects the probability of investment relatively greatly. The effect of cost of investment averaged across both networks was in the expected direction in all but one scenario (high urgency, low chance of success and high value species). The results imply a more complex relationship between urgency, cost of investment, and biological value in the government network than in the NGO network.
Decision support frameworks such as BNs can provide useful tools to evaluate conservation decisions in addition to existing conservation planning, decisionmaking, and evaluation tools. In this project, the primary aim was to describe how different decisionmaking perspectives might affect the decision to invest. We suspected, based on conversations with government members and representatives, that governments would be more concerned than NGOs about the scale of investment. This was indeed the case, particularly when concerned with high-risk, low-return projects. Conversely, NGOs may be perceived as generally more ideologically committed than governments to the conservation projects and therefore prepared to invest heavily in high-priority species, regardless of risk of failure.
Our results showed that, overall, the government perspective resulted in a lower likelihood of investing in a given individual species than the NGO perspective. In one BN, slightly more emphasis was placed on economic factors. The BN approach provided a mechanism for identifying such issues more clearly. It also allowed for the inclusion of more intangible factors and factors for which little or no quantitative data exist.
The second problem we sought to address was whether there was a common set of prioritized species that would satisfy both government and NGO perspectives. We demonstrated through the use of BNs that the order in which species are addressed remains largely identical, regardless of decision network or perspective, with all 13 species examined in this paper occupying similar or identical priority levels for both government and NGO models. Both models led to Choeropsis liberiensis being ranked with the highest probability of investment for conservation, and Papio ursinus lowest.
These results suggest the different priorities of governments and NGOs may result in differing weightings of factors when deciding whether to invest in a species, but this does not necessarily imply they will arrive at differing decisions. Future research could explore the interactions between funding structures and decision factor weightings and how these pressures influence decisions to invest in endangered species.
Further Reading
Farr, A.C., T.F. Kleinschmidt, S. Johnson, P. Wu, and K. Mengersen. 2011. Wayfinding in airports: A Bayesian network approach. Presented at the Australian Bayesian Network Modelling Society Annual Conference, Brisbane, Australia.
Heckerman, D. 1995. Real-world applications of Bayesian networks. Communications of the ACM 38(3):24–26.
Heckerman, D., D. Geiger, and D.M. Chickering. 1995. Learning Bayesian networks: The combination of knowledge and statistical data. Machine Learning 20(3):197–243.
Johnson, S., F. Fielding, G.S. Hamilton, and K.L. Mengersen. 2010. An integrated Bayesian network approach to Lyngbya majuscula bloom initiation. Marine Environmental Research.
Pearl, J. 1988. Probabilistic reasoning in intelligent systems: Networks of plausible inference. Morgan Kaufmann.
About the Authors
Gavin Stewart is a research fellow at the University of York Centre for Reviews and Dissemination in the United Kingdom. He is associate editor of Research Synthesis Methods and statistical editor for the Cochrane Pain and Palliative Care group. His primary interest is in the generic science of evidence synthesis to support needs-led decisionmaking.
Kerrie Mengersen is an accredited member and society president of the Statistical Society of Australia, a longtime executive member of the International Society for Bayesian Analysis, and an elected fellow of the Royal Statistical Society and Institute for Mathematical Sciences.
Jeffrey McNeely is A.D. White Professor-at-Large at Cornell University, senior science advisor at the International Union for Conservation of Nature, chair of the Policy Committee of the Society for Conservation Biology, chair of the Red List Committee of IUCN’s Species Survival Commission, and a member of the Science and Technical Panel of the International Risk Governance Council.
Georgina Mace is professor of conservation science and director of the Natural Environment Research Council (NERC) Centre for Population Biology, Imperial College London. She has been a vice president of the British Ecological Society, president of the Society for Conservation Biology, member of the Science Committee of Diversitas, and editor of the Philosophical Transactions of the Royal Society (Series B, Biological Sciences).
Jegar Pitchforth is a researcher in Bayesian statistical modeling of complex systems. He is assistant chair for the Social Statistics Section of the Statistical Society of Australia and works with Australian airports and border agencies to quantify performance.
Ben Collen is head of the Zoological Society of London’s Indicators and Assessments Unit, research fellow at the Institute of Zoology, honorary senior research associate at University College London, honorary research fellow at the United Nations Environment Programme World Conservation Monitoring Centre, and co-chair of the IUCN National Red List Working Group.
Don’t you think that the model would be more robust if you defined what you mean by high/low, strong/weak?
I am wondering whether you have considered incorporating value of information analysis to see where narrowing uncertainty might improve the decision.
Also did you attempt calibration of experts for estimating probabilities (see Doug Hubbard’s book How to Measure Anything) and if so I am interested in your experience.