
How to Defuse Earth Impact Threat Announcements
Announcements of newly discovered near-Earth asteroids with unusually high Earth-collision chances in the near future have been regularly highlighted in the press and on TV since the 1980s. Recently, they’ve been highlighted on the web. These planetary objects, referred to throughout as NEAs, are formally defined in Figure 1.
Over time, less concern has been noted, unless the announcement concerns a new, relatively big asteroid (hundreds of meters in size) with an alarmingly high probability of hitting the Earth in the next decades.
Impact monitoring and analysis is primarily undertaken by the University of Pisa (the system is called CLOMON21) and NASA-JPL (National Aeronautics and Space Administration Jet Propulsion Laboratory), where it is called SENTRY2. On a daily basis, these two groups collect all astrometric data of all NEAs, new and known, observed the previous night by the observing surveys.
Astrometric data, or astrometric observations, are the optical/radar measurements of the asteroid sky position with respect to the so-called “fixed stars” (the Earth, in the case of radar observations). These data are compiled from all the observatories around the world and made available at the Minor Planet Center (MPC)3 at Harvard University.
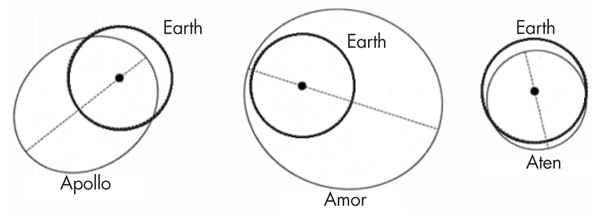
Figure 1. Near-Earth asteroids, or NEAs, are those asteroids with perihelion distance q less than 1.3 A.U. (1 A.U. is the mean Earth-Sun distance, and it is nearly equal to 1.5 × 10⁸ km). The perihelion is the point in the orbit of a planetary object where it is nearest to the Sun, as opposed to aphelion, where it is farthest. NEAs are divided into three sub-classes: Apollos, Amors, Atens. Apollos have q < 0.983 A.U. and semi-major axis a > 1 A.U.; Amors have 1.017 A.U. < q < 1.3 A.U., and Atens have aphelion distance Q > 0.983 A.U. and semi-major axis a < 1 A.U. Note that 0.983 A.U. and 1.017 A.U. are the perihelion and aphelion distances of the Earth, respectively. Shown is a projection of NEA orbits onto the ecliptic plane (the Earth’s orbit plane). That could give the wrong impression that actually all Apollo and Aten orbits intersect the orbit of the Earth. Obviously, this is not true since orbits are also inclined with respect to the ecliptic plane and rotated around the focus (the Sun).[/caption]
SENTRY and CLOMON2 apply their algorithmic procedures daily to identify possible threatening asteroids among the new ones and refine the orbit of those already categorized as threatening.
The first well-publicized scare concerned asteroid 1997 XF11, for which a possible impact with the Earth was predicted in 2028 by Brian Marsden at MPC. This object and its heralded non-zero impact probability in the near future led to unprecedented turmoil within the astronomical community and, to a somewhat lesser extent, within the wider community. (Note that, as described by Chapman (1999), Marsden’s initial calculations were actually incorrect, even given the information known to him at the time).
The case of asteroid 1999 AN10 was one of the first cases in the impact monitoring era (that of CLOMON2 and SENTRY), and this object played an important role in developing the concept of virtual impactors described below.
One of the most recent asteroids discovered with near future non-zero impact probabilities is the ~40-meter 2012 DA14, while the most famous one is asteroid (99942) Apophis (~300 meters), which is named after an ancient Egyptian evil god. In December of 2004, monitoring systems calculated an initial impact chance for the year 2029 as high as ~1/38. Then, after more observational data were gathered, the impact in 2029 was ruled out. Currently, Apophis has a chance nearly equal to ~5 × 10⁻⁶ of hitting the Earth in 2068.
For those wanting the most up-to-date information, the CLOMON2 and SENTRY web pages provide a daily updated list of all potential future impactors.
The discovery of new NEAs with non-zero impact probabilities always grabs the attention of the astronomical community with a focus on Earth impact, as well as the general public when the calculated impact probabilities for a specific date in the future result to be unusually high according to the standards of the astronomical community (see the International Astronomical Union [IAU] rules4).
Unusually high means that the impact probability calculated by monitoring systems for a particular new asteroid is higher than the yearly statistical impact probability on the Earth coming from an unspecified asteroid of equal size or larger belonging to the whole NEA population, multiplied by the time interval (in years) that separates the present time from the future impact date of the asteroid under analysis. This is motivated by the fact that our planet moves in an environment swept by the NEA population.
This metric flows from the philosophy of the Palermo Scale, the hazard scale most used among astronomers. Using this measure, an impact prediction (time, size, and probability) is normalized to the background expected impact probability from the present time to the time of the prediction.
Expressed as a logarithm, Palermo Scale 0.0 means the predicted event is essentially “as expected” in that time interval; positive values mean the predicted event is “extraordinary” and deserves attention. Negative values indicate the predicted event is only a small addition to the expected impact flux.
Astronomers first estimate the “per object” mean impact frequency. This is done by generating a synthetic population of point-like objects, which is thought to be representative of the overall orbital distribution of the actual NEA population. Next, they numerically integrate over their motion and study the distribution of close encounters with the Earth. By extrapolating these statistics down to the Earth radius and dividing by the number of point-like objects, they obtain the per object impact frequency. The background impact probability is obtained by multiplying the per object impact frequency with the estimated number of NEAs in different size ranges. The background impact probability can be approximated by the following power function:
ρi (≥ D) = 20D−2.4 yr−1 , (1)
where D is the diameter of the asteroid expressed in meters. Note that more detailed and up-to-date models for impact production rate exist.
Rigorously speaking, the background impact probability gives the average number of NEAs larger than a given size that hit the Earth per year. If this number is less than 0.1, as happens with bigger asteroids, then it expresses a mathematical probability. Otherwise, if it is greater than or equal to unity, as happens with (sub)meter-sized NEAs that fall on the Earth every year more than once, then it expresses a kind of frequency of impacts. Accordingly, the average number of NEAs that hit the Earth per year with diameters between D and D + ∆D is given by:
ρi (D + ∆D; D) = 20(D−2.4 − (D + ∆D)−2.4) yr−1 . (2)
The reciprocal of the background impact probability ![]() is the impact interval time, and it gives the mean time between two consecutive impacts of asteroids larger than a given size (Figure 2). As is clear from Figure 2, the constant power law (1) is only an approximation of various data about NEA size distribution coming from different sources: The points plotted in Figure 2 represent unpublished estimates of the NEA population in different size range.
is the impact interval time, and it gives the mean time between two consecutive impacts of asteroids larger than a given size (Figure 2). As is clear from Figure 2, the constant power law (1) is only an approximation of various data about NEA size distribution coming from different sources: The points plotted in Figure 2 represent unpublished estimates of the NEA population in different size range.
[caption id="attachment_7487" align="aligncenter" width="400"] Figure 2. Estimate of the cumulative population of near-Earth asteroids (NEAs) versus absolute magnitude H, namely brightness at standard distance of 1 astronomical unit from Earth and Sun (blue-dashed line and blue dots). N (< H) is the cumulative number of objects with H less than a given value. The fraction currently detected (red dashed line) is nearly complete to H ~16, but falls off rapidly with increasing H magnitude, since smaller objects are harder to detect. There are also equivalent scales for diameter in km (bottom axis) and expected impact interval in years (on the right). The dots represent some unpublished estimates of the NEA population. The straight line is a simple power law that approximates the estimates: With respect to the right-hand vertical scale, this line represents , where ρi (≥ D) is the equation (1) in the text. [/caption]
Reprinted by permission from Macmillan Publishers Ltd [Nature]: Harris, A.W., 2008: What Spaceguard did. Nature 453:1178–1179. Copyright 2008.
It must be said that every estimate of size distribution (and thus of background impact probability) has its own intrinsic uncertainty, which is often large and may not be fully characterized. However, this is not considered a major concern, since the argument is somewhat independent of the background impact probability exact form.
When additional new astrometric observations become available, the asteroid orbits are refined and usually the impact possibilities are definitively ruled out, as happened with the case of asteroid 1999AN10. In what follows, we qualitatively describe how the current impact monitoring systems compute impact probabilities of newly discovered NEAs. Then, we define the a posteriori conditional probability W: This is directly related to the background impact probability as well as the mean annual frequency with which impact-monitoring systems find impact threats among newly discovered asteroids. We argue that probability W is the appropriate probability measure to help assess from the very beginning the future impact chances of asteroids just inserted in the risk lists of monitoring systems. We also give an estimate for the upper bound of W.
NEA Discovery and Impact Scare
When a new NEA is discovered by telescopic surveys around the world, a preliminary orbit is computed using its positions in the sky over a suitable (minimal) interval of time (astrometric observations). Like every physical measurement, astrometric ones are affected by errors that make the resulting orbit uncertain to some variable degree. Sophisticated mathematical and numerical tools are now available to allow the propagation of these measurement errors to the six orbital elements that identify the orbit of the asteroid (semi-major axis a, eccentricity e, inclination i, longitude of ascending node Ω, argument of perihelion ω, time of perihelion passage t). The new NEA, soon after its discovery, is not represented by a single point in the six-dimensional orbital elements space; rather, it is represented by an uncertainty region, a six-dimensional volume with blurred contours. Obviously, the volume of this uncertainty region changes (it generally shrinks) when additional observations become available and the orbit estimate is refined.
When the nominal orbit (which best fits the observations) of the new NEA is geometrically close to the orbit of the Earth and it shares some other peculiar orbital characteristics (like encounter timing issues), some orbital solutions that lead to a future collision of the asteroid with the Earth cannot be excluded on only the basis of the available astrometric observations. Orbital solutions that lead to a collision are inside the uncertainty region and fully compatible with the available astrometric observations and their errors.
In these cases, monitoring systems sample the uncertainty region with an appropriate number of sample points according to a suitable six-dimensional space distribution closely related to what is currently known about error statistics (a priori uniform or Gaussian). They then evaluate the relative probability that the ‘true’ orbit of the asteroid is one of the collision ones. Henceforth, we will refer to this probability with the symbol Vi. The collision orbits are nowadays commonly called virtual impactors (or VIs). Sometimes, Vi is also referred to as VI impact probability.
If a newly discovered NEA exhibits VIs, then it is promptly added by monitoring systems into their publicly available risk lists, together with its estimated probability Vi and Palermo Scale rating.
CLOMON2 and SENTRY find hundreds of newly discovered NEAs with VI orbital solutions every year (see Figure 3 for a summary of VI identification between calendar years 2004 and 2009).
[caption id="attachment_7489" align="aligncenter" width="400"]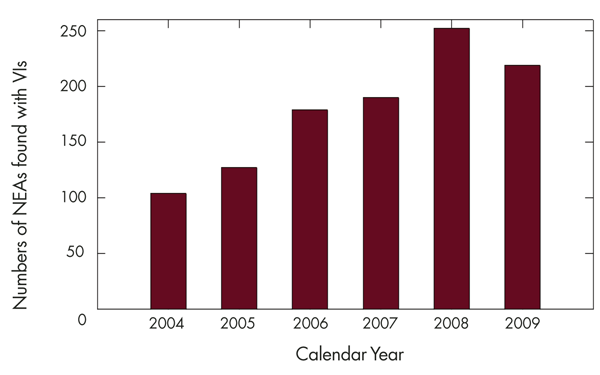 Figure 3: NEAs discovered between calendar years 2004 and 2009 exhibiting VI orbital solutions (taken from SENTRY risk list and archive). The increasing trend with time is mainly because discovery surveys have become more efficient in discovering NEAs over the years. The efficiency of impact monitoring systems in finding VIs is very high, and it has been almost always the same through the years.
Every time additional astrometric observations become available, the characterization of the asteroid orbit improves and the estimated impact probability Vi is re-computed. This may happen in the weeks, months, and even years following the discovery date. A typical pattern is that as the orbit becomes more precisely determined, impact probability Vi often increases initially, but then decreases until it falls to zero, or some very low number.
The reason for the initial increasing behavior is rather technical: Since the uncertainty region generally shrinks with new additional observations, some VI orbital solutions often remain inside the uncertainty region in the elements space.
In the following section, we propose an a posteriori conditional reading of VI impact probabilities. We label our probability as a posteriori since it is obtained as the ratio between two statistical quantities (relative frequency). On the other hand, the VI impact probabilities can be considered a priori, in the sense that they are obtained through sophisticated mathematical models and deductive reasoning (for instance, the choice of an a priori six-dimensional space distribution to sample the uncertainty region).
Statistical Reading of Vi : The Probability W
When a newly discovered NEA is found, a key question is whether the probability that Vi approaches and eventually reaches unity (within this paper, we will use the compact notation ‘Vi → 1’) after the right amount of additional new astrometric observations has become available. This is equivalent to asking whether only knowing that a newly discovered NEA exhibits some VI orbital solutions, what is the probability that Vi will be equal to 1 at the end of the whole orbital refinement process.
The following thought experiment helps motivate this point. Suppose that the existing discovery surveys are able to discover all NEAs that pass close to the Earth down to a size cut-off. This is obviously not true since during their close approaches to the Earth, many unknown asteroids remain too dim to be detected by telescopes. They are too small in size and/or still ‘too distant.’ Moreover, some NEAs are not found because telescopic observations miss them, namely surveys do not image a portion of the night sky when they are there and bright enough to be seen. This becomes especially true for asteroids relatively close to the Sun, where monitoring is more sporadic or even impossible.
We also suppose that every discovered asteroid really impacting the Earth in the future will show some VIs, with low Vi soon after the discovery and fluctuating with an increasing trend as soon as subsequent astrometric observations become available, as usually happens in reality.
In other words, we are putting ourselves in the somewhat idealized situation in which every impacting asteroid above a size cut-off is surely discovered, and monitoring systems surely spot some VIs for it soon after its discovery. Thus, we define W as:
![]()
where n(D + ∆D; D) is the number of asteroids with size between D and D + ∆D that actually impact the Earth in the period of time T, with T » 1 year, and v(D + ∆D; D) is the number of asteroids found by monitoring systems among all the newly discovered ones to exhibit VI orbital solutions, in the same size interval and in the same period of time T.
The quantity W can be seen as the a posteriori conditional probability of Vi → 1, and could also be interpreted as a kind of ‘weight’ of the VI impact probability calculation. Now, by dividing both numerator and denominator of (3) by T, we have:

The limit limT → ∞![]() is the definition of the background annual impact probability, equation (2). The function fvi (D + ∆D; D) = limT → ∞
is the definition of the background annual impact probability, equation (2). The function fvi (D + ∆D; D) = limT → ∞![]() is the annual frequency of newly discovered NEAs with sizes between D and D + ∆D found with VI orbital solutions.
is the annual frequency of newly discovered NEAs with sizes between D and D + ∆D found with VI orbital solutions.
Note that, according to the earlier assumption, the number n(D + ∆D; D) is counted in the number v(D + ∆D; D), if every impacting asteroid is identified soon after its discovery as having some VI orbital solutions, thus n(D + ∆D; D) is always less than or equal to v(D + ∆D; D).
We focus our attention on (4). Within the hypotheses introduced above, we imagine waiting for a long period (many years), T, and count the number n(D + ∆D; D) of true asteroid impacts on the Earth and the number v(D + ∆D; D) of newly discovered NEAs found by monitoring systems to have VI orbital solutions with size between D and D + ∆D during that period of time. The limit for T → ∞ of the ratio between these two numbers is the conditional probability that a discovered asteroid of size between D and D + ∆D will eventually fall on Earth, given that it has VI orbital solutions. In (4), we have simply rewritten W in terms of the background annual impact frequency ρi and the mean annual VI detection frequency fvi.
Thus, W(D + ∆D; D) gives the probability that an asteroid with VIs (an asteroid inserted into the risk lists of the monitoring systems) has its probability Vi eventually reaching unity.
We noted earlier that W could be interpreted as a kind of ‘weight’ of the VI impact probability calculation. Suppose that, thanks to improvements in observational techniques (e.g., higher positional precision) and orbital computation, the number of newly discovered asteroids identified by monitoring systems as potential impactors decreases in every diameter (or absolute magnitude) range. Accordingly, the probability W will increase (given its definition) in every diameter (or absolute magnitude) range. Since the decrease of the number of potential impactors among the new asteroids means an increased capability in constraining the true potential impactors, the consequent increase of W would equivalently mean an increased capability in constraining the true potential impactors by the monitoring system. Therefore, W could be seen as a ‘weight’ in expressing the actual capabilities of the monitoring system.
Moreover, we can see that W is not directly related to the specific numerical value of Vi, no matter how Vi’s specific, fluctuating numerical figure is. Rather, it depends upon fvi, which, in turn, depends upon observational characteristics. These characteristics are the annual number of NEA discoveries, the amount of astrometric observations available at discovery, the magnitude of astrometric errors (and conventions in their statistical treatment), and the observational geometry and orbital characteristics of the newly discovered asteroids.
Although the value of fvi depends upon contingent, variable features, it is worthwhile to estimate it statistically. Given the total number of NEAs with VIs found at every size between calendar years 2004 and 2009 (Figure 3), an indicative estimate of fvi (D + ∆D; D) is possible (see Figure 4). Consequently, a preliminary estimate of W(D + ∆D; D) can be obtained as in Figure 5. The annual VI detection frequency fvi (D + ∆D; D) shown in Figure 4 has been obtained by dividing the number of all NEAs discovered between calendar years 2004 and 2009 and listed in the SENTRY risk list by six (years), binning the result by size.
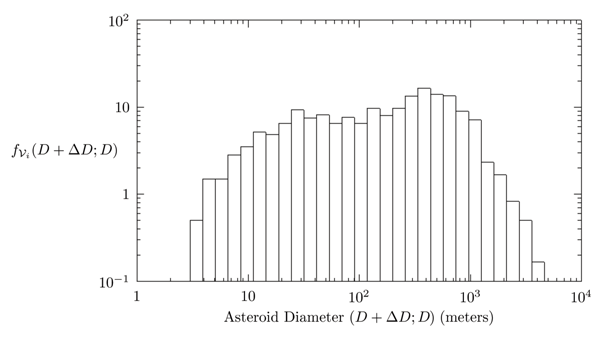
Figure 4: Annual frequency fvi (D+∆ D; D) of VI detections, estimated using all NEAs discovered between calendar years 2004 and 2009 and listed in the SENTRY risk list (and archive). The size range of this group is from ~3m up to a maximum of ~4 km. The size bins are spaced geometrically (such that D + ∆D = 1.3D).
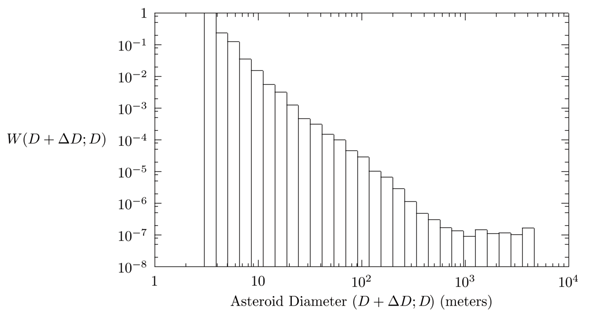
Figure 5. The probability W(D + ∆D; D) as a function of asteroid diameter. The size bins are spaced geometrically (such that D + ∆D = 1.3D). W(D + ∆D; D) represents the probability that an asteroid with VIs, and thus an asteroid inserted into the risk lists of the monitoring systems, has its probability Vi eventually reaching unity. It is thought that the whole population of NEAs with diameter larger than nearly 4km has probably already been discovered and the orbits are also known to be safe for the Earth. This is the reason why no VI has been found so far for such NEAs.
Relaxing the optimistic assumptions on the “almost perfect NEA discovery efficiency” and VI monitoring capabilities makes fvi, as approximated with the aid of Figure 4, even a lower limit. As a result, the computation of W(D + ∆D; D) is surely an overestimate.
Furthermore, fvi changes over time, since the discovery completion increases and the discovery rate declines with time (because the NEA population is stable). It is useful to update fvi (and hence W) from time to time. But the sense and the validity of the definition of W are not affected by (and dependent on) such a time dependence.
In summary, the function W(D + ∆D; D) provides us with a first simple tool to evaluate the chance that Vi (the impact probability calculated by the monitoring systems for newly discovered NEAs with VI orbital solutions) eventually reaches unity. As a matter of fact, Vi is a stochastic variable since nobody knows how Vi will evolve with additional observations, and it is perfectly legitimate (and valuable) to define a probability (W) of a (stochastic) probability value (Vi).
Consider now the application of probability measure W to two well-known cases: Apophis and asteroid 2008 TC3 (which actually impacted the Earth the day after its discovery). These examples suggest the reliability of probability W in providing an early direct glimpse of the most likely fate of probability Vi.
Soon after Apophis was discovered in December 2004, impact-monitoring systems identified multiple VIs orbital solutions and obtained the fear-inducing initial impact probability of ~1/38 for the year 2029.
What is the probability W for Apophis, an asteroid with an estimated diameter of nearly 300m? According to Figure 5, W(~300m) is less than 10–6, namely more than four orders of magnitude lower than that initially reported by monitoring systems and close to their current estimate, obtained after some orbit refinement.
Nowadays, it is almost certain that the probability Vi for Apophis will go to zero with future astrometric observations, but it was not so clear at the beginning of the impact-monitoring process (with an initial Vi of ~1/38). As a matter of fact, an early use of probability W would have given a direct glimpse of what would have been the most likely fate of Vi for Apophis.
The same would have happened for 2008 TC3, which was discovered on October 6, 2008, and impacted the Earth about 20 hours later. The impact was predicted by monitoring systems to have a probability of ~100%. Consistently, the probability W for objects in the size range of 2008 TC3 is practically 1, the size of that asteroid being estimated to be between 2m and 4m (see Figure 5).
In the end, the proper impact probability of a newly discovered asteroid is not Vi (which actually fluctuates with new additional observations), but the probability that Vi → 1 (i.e., W).
1 http://newton.dm.unipi.it/neodys/index.php?pc=4.1
2 http://neo.jpl.nasa.gov/risk
3www.minorplanetcenter.org/iau/mpc.html. The MPC designates minor bodies in the solar system and has international responsibility for the efficient collection, computation, checking, and dissemination of astrometric observations and orbits for minor planets and comets.
4http://web.mit.edu/rpb/wgneo/TechComm.html
Further Reading
Chapman, C.R. 1999. The asteroid/comet impact hazard. Case study for Workshop on Prediction in the Earth Sciences: Use and Misuse in Policy Making. July 10–12, 1997, National Center for Atmospheric Research, Boulder, CO, and September 10–12, 1998, Estes Park, CO. www.boulder.swri.edu/clark/ncar799.html.
Chesley, R.S., P.W. Chodas, A. Milani, G.B. Valsecchi, and D.K. Yeomans. 2002. Quantifying the risk posed by potential Earth impacts. Icarus 159:423.
Harris, A.W. 2008. What Spaceguard did. Nature 453:1178.
Milani, A., S.R. Chesley, P.W. Chodas, and G.B. Valsecchi. Asteroid close approaches and impact opportunities. In Bottke, W., A. Cellino, P. Paolicchi, and R.P. Binzel (Editors). 2003. Asteroids III. Tucson: University of Arizona Press.
Morrison, D., A.W. Harris, G. Sommer, C.R. Chapman, and A. Carusi. Dealing with the impact hazard. In Bottke, W., A. Cellino, P. Paolicchi, and R.P. Binzel (Editors). 2003. Asteroids III. Tucson: University of Arizona Press.


