
How We Know the Earth Is Warming

There is no doubt that global temperatures are increasing, and that human greenhouse gas emissions are largely to blame, but how do we go about measuring global temperature? It is not just a matter of reading an instrument.
In Figure 1, we see a variety of curves depicting annual global mean temperature. They are not the same, although they all show a strong increase after about 1980. Different groups, using different data and different techniques, have computed the different curves. It would be hoped that the curves would all be measurements of the annual global mean temperature, but global mean temperature is not something that can be measured directly using an instrument. On the other hand, it is the quantity most commonly used to indicate global warming.
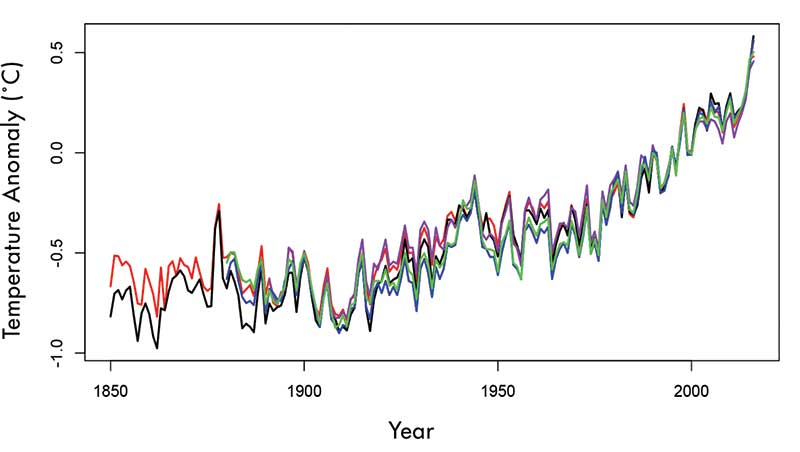
Figure 1. Five estimates of the annual global mean anomalies relative to 1981–2010: Black is from Berkeley Earth, red from the UK Met Office Hadley Center, purple from the Japanese Met Office, blue from the Goddard Institute for Space Science (GISS), and green from the National Oceanic and Atmospheric Administration (NOAA).
Where do the numbers come from? We will go through some issues that are associated with determining surface temperature, and illustrate some of the uses of these temperatures.
Some content is only viewable by ASA Members. Please login or become an ASA member to gain access.


