
Plotting Evidence to Affect Social Policy: Guns, Murders, Life, Death, and Ignorance in Contemporary America
Editor’s Note: This work is collaborative in every respect, and the order of authorship is alphabetical.

In the mid-19th century, Joseph Fletcher (1813–1852), a young lawyer turned statistician, published a long paper filled with choropleth maps whose shadings depicted the variations seen among English counties in many “moral statistics.” Fletcher’s principal goal in preparing this essay was to affect opinion on what he considered to be key social issues. For example, he juxtaposed a plot of crime in England and Wales with another of ignorance. One could easily see that the same pattern of shading that characterized areas of high crime were matched by patterns showing high levels of ignorance. Fletcher drew the causal connection suggesting that improving schooling would reduce ignorance and crime simultaneously. A reanalysis of the same data a century later showed that the policies favored by Fletcher had the effect he anticipated.
While we firmly believe there is a causal connection between ignorance and crime, the inclusion of empirical evidence to support such a claim is always welcome. There are relationships between various contemporary moral statistics that seem, on their face, to be obvious, yet stakeholders of one sort or another dispute such claims regardless of how obvious they seem. So, let us take a page from Fletcher’s book and look at evidence for a variety of such claims.
We shall make two kinds of claims and hence mobilize two kinds of displays in their support. The first kind of claim will be about the relationship between two quantitative variables; for example, the relationship between the number of guns in a state and the number of people murdered by guns in that state. These claims will be illustrated with scatterplots. Such plots show the relationship between the variables, but convey little geographic information. We augment the scatterplots a little by indicating the states that voted in the majority for Barack Obama in the 2012 presidential election (“blue states”).
The second kind of claim relates more directly to the geographic distribution of the variables displayed in the scatterplots. To accomplish this, we shall use the same choropleth format that Fletcher employed more than 150 years ago. We modernize his format slightly following the lead of Andrew Gelman in his marvelous 2008 book about that year’s presidential election. We shall shade each map so that states above the median in the direction generally agreed is positive (e.g., fewer murders, longer life expectancy, lesser ignorance, greater income) will be in blue, the further from the median the more saturated. And states below the median will be shaded in red, the lower the more saturated the red. The closer to the median that a state scores, the paler is the coloration, so that a state at the median is shaded white.
Our goal with these displays is to examine the extent to which geography is destiny; is there coherence among states that always seem to find themselves at the unfortunate end of these variables? Perhaps such a view can suggest ways that those states can amend their policies to improve the lives of their inhabitants. Or, if those states resist such change, the maps can guide their inhabitants to alternative places to live.
Variables and Data Sources
- Variable 1. Number of guns in a state—we found it difficult to get an accurate estimate of this variable, so we used, as a proxy, the 2012 NCIS firearm background checks per 100,000 in each state. We assume the more background checks that were done, the more guns that were in the state. We assume the actual number of guns purchased far exceeds the number of background checks, but we expect that the relationship between the two is monotonic. Some might claim that by not requiring background checks, we might thus reduce gun violence, but we remain unconvinced by such argument.
- Variable 2. Firearm death rates per 100,000 from StateHealthFacts.org
- Variable 3. 2010–2011 life expectancy from the American Human Development Project
- Variable 4. Ignorance—we used 2011 NAEP 8th-grade reading scores (NAEP: National Assessment of Educational Progress, popularly referred to as “The Nation’s Report Card”) as a measure of the ignorance of the state’s population. NAEP scores are a random sample from the population and all scores on all age groups and all subjects form a tight positive manifold. Hence, we simply chose a representative one. Any other would have yielded essentially the same picture. Fletcher used the proportion of individuals who signed their wedding license with an “X” as his indicant of ignorance. We believe our choice represents an improvement.
- Variable 5. Income—2010 per capita income from U.S. Census Bureau 2012 Statistical Abstracts
Claims About the Relationship Between Variables
Claim 1. The more people who are killed by guns in a state, the lower will be life expectancy in that state.

Figure 1. A scatterplot of 2010–2011 life expectancy vs. firearm death rate per 100,000 by state. The bold points are states that voted for Obama in the 2012 presidential election. The data are standardized (z-scores).
Claim 2. The more guns that are registered in a state, the greater will be the number of gun deaths.

Figure 2. The horizontal axis shows the 2012 NCIS firearm background checks per 100,000 in each state; the vertical axis is the firearm death rate per 100,000. Bold points are blue states.
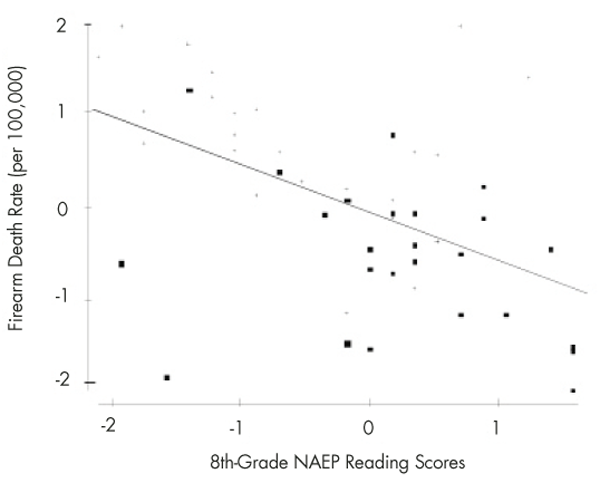
Figure 3. The horizontal axis shows 2011 NAEP 8th-grade reading scores; the vertical axis has the firearm death rate per 100,000.
Claim 4. The lesser the ignorance, the greater the income.
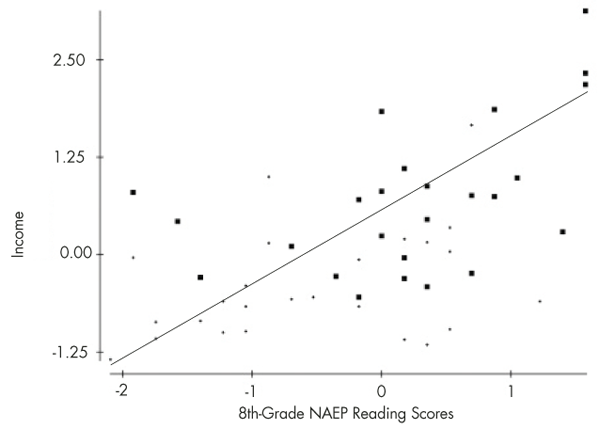
Figure 4. The horizontal axis shows 2011 NAEP 8th-grade reading scores; the vertical axis shows the 2010 per capita income.
Geographic Claim
There is a coherence among states that has remained stable for at least the past 80 years. In 1931, Charles Angoff and H. L. Mencken tried to determine which American state was the worst. Their conclusions, based on a large mixture of indices of quality of life, closely resemble what we see in our 21st-century data. While people differ in their goals and aspirations, most would agree that life, on the whole, is better than death (Figure 5 – life expectancy, Figure 6 – firearm death rates), that some provision for human need is better than chronic lack (Figure 7 – income), and that a literate population is better able to participate in decisions regarding the future and welfare of themselves and their progeny (Figure 8 – NAEP reading scores).
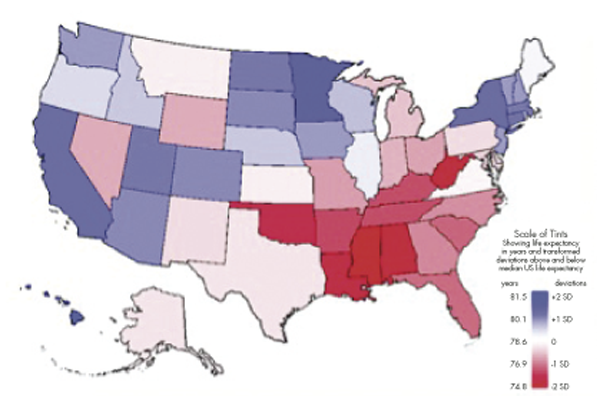
Figure 5. 2012 U.S. life expectancy
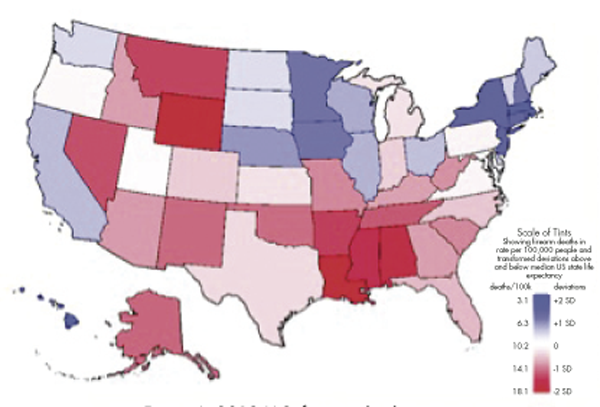
Figure 6. 2012 U.S. firearm death rate

Figure 7. 2012 U.S. per capita income
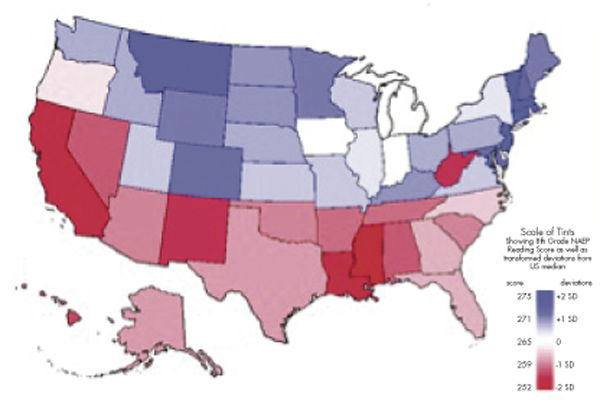
Figure 8. 2011 NAEP Scores: 8th-grade reading
Even a cursory study of these figures reveals a startling similarity of the geographic pattern of these variables. This pattern repeats itself in Figure 9, gun background checks, suggesting a plausible causal connection that seems worth considering seriously. The red and blue coloration scheme used here is based solely on the states’ location on the variable plotted, not on their voting in the 2012 presidential election (Figure 10). Yet the similarities of the color patterns shown here to those of the voting maps is striking. The direction of the causal arrow connecting the voting habits of states and their position on these variables is uncertain; are the citizens of states ignorant because of the policies espoused by Gov. Romney? Or are ignorant people attracted to such policies? Our data do not illuminate this question.

Figure 9. 2012 NCIS background checks

Figure 10. 2012 U.S. presidential popular vote
Conclusion
Although Joseph Fletcher never quoted Thomas Hobbes1 as the philosophical underpinning of the tack he took, we shall. Hobbes described the natural state of humankind, without the control of some sort of central government, as a “war of every man against every man,” and the result of such a circumstance as lives that are “solitary, poor, nasty, brutish, and short.” We have seen that as access to firearms becomes less and less controlled, lives become shorter, wealth diminishes, and ignorance increases. Or at least that is what the evidence shows.
1 What Hobbes actually said is, “Whatsoever therefore is consequent to a time of Warre, where every man is Enemy to every man; the same is consequent to the time, wherein men live without other security, than what their own strength, and their own invention shall furnish them withall. In such condition, there is no place for Industry; because the fruit thereof is uncertain; and consequently no Culture of the Earth; no Navigation, nor use of the commodities that may be imported by Sea; no commodious Building; no Instruments of moving, and removing such things as require much force; no Knowledge of the face of the Earth; no account of Time; no Arts; no Letters; no Society; and which is worst of all, continuall feare, and danger of violent death; And the life of man, solitary, poore, nasty, brutish, and short.”
Further Reading
Angoff, C., and H.L. Mencken. 1931. The worst American state. American Mercury 31: 1–16, 175–88, 355–71.
Cook, R., and H. Wainer. 2012. A century and a half of moral statistics in the United Kingdom: Variations on Joseph Fletcher’s thematic maps. Significance, 9(3):31–36.
Cook, R., and H. Wainer. 2013. Joseph Fletcher, thematic maps, slavery, and the worst places to live in the UK and the US. In Visible numbers, the history of statistical graphics. Kostelnick, C., and M. Kimball (Eds.). Farnham, UK: Ashgate Publishing.
Gelman, A. 2008. Red state, blue state, rich state, poor state: Why Americans vote the way they do. Princeton: Princeton University Press.
Hobbes, T. 1651. Leviathan, or the matter, forme, and power of a commonwealth, ecclesiasticall and civill. Republished in 2010, ed. by Ian Shapiro. New Haven: Yale University Press.
Wainer, H. 2012. Moral statistics and the thematic maps of Joseph Fletcher. CHANCE 25(1):43–47.

Visual Revelations covers many topics, but generally focuses on two principal themes: graphical display and history. Howard Wainer, column editor, encourages using this column as an outlet for popular statistical discourse. If you have questions or comments about the column, please contact Wainer at hwainer@nbme.org.
Is Chance magazine supposed to educate people about statistics? Why did the authors not present R squared or p values for their regressions? Why does the magazine allow some of these claims to be stated as proven when the R squared value is a few percent and p values show no significant difference from zero in slope? Is it statistical science to eyeball fits and maps and declare correlation? What credibility will statistics have when we make bold claims that do not pass the tests we design?
Is this supposed to be satire? I sure hope so. If not, I am concerned.
First lets remember that correlation is not causation. The article states “The more people who are killed by guns in a state, the lower will be life expectancy in that state.” Well, of course, because life expectancy and death by any means are inversely related anyway. One could say that the more it rains in a state the higher the humidity and pretty much nail the prediction. That says nothing about causation. There are also a number of counterfactuals in your graphics. Montana, for example has a high 8th grade reading score which the author equates to “ignorance” (I’m not sure how reading and ignorance are established as equivalent but I will go with it for now), and yet has a “high” firearm death rate but a moderate life expectancy. Part of the problem is that many of the “red” states are rural and agricultural in nature — look at the reading scores graphic and you can see a definite North-South difference. The differences are spurrious when you take into account that there are more hunters living in the rural mountain West and Southern areas and more people from urban populations who come to those areas to hunt while on vacation. The gun deaths seen in those locations are not necessarily locals either — many people who vacation and go hunting from urban areas are not as well educated or familiar with firearms and either hurt themselves or others due to their “ignorance” of local laws and hunting regulations.
There are so many logical leaps in this article that it almost comes across as intentional humor. The subject matter is not well researched, nor are potential confounds accounted for in the presentation. This seems to be a one-sided attempt at using pseudo-stats and graphics to sway public opinion in a particular direction.
This is a hilarious article. So being able to do well at the 8th grade level is a sign of not being ignorant. Really, I teach at James Madison University and have taught at many ‘fine’ universities across the USA. Not only are many college students ignorant, but so are many ‘professors’. The Department of Education and most Colleges of Education and Psychology are filled with very ignorant people. Also, more people die from cancer, disasters and diseases through products developed by highly educated people who did well in school. Weapons of mass destruction (that are used by the current president and the 3 previous presidents) built by highly educated scientists kill way more people than guns do. There are way more serious problems in the USA and the world than citizens owning guns and most of these serious problems have been created by highly educated people. This has been a prevailing fact throughout human history. The Mennonites where I live only go to school up to the 8th grade and all of them own firearms and I have no fear of them and neither does anyone in the county where I live. Many of the guns owned by these Mennonites are unregistered and many Mennonite families own a stockpile of unregistered guns. So a county with a high percentage of gun owners does not have a problem with the gun owners or people being killed by these gun owners. However, the people who own the ‘meth’ labs where I live and there are lots of them are a threat, but only to those involved in the drug culture. Unfortunately, this means the police force. Once again,the data does not really tell us a lot. The lifestyles and values are what is really important.
I did some similar plots relating obesity and voting patterns.
I could come to some “politicially incorrect “conclusions.
Thanks for sharing –
regards.
Professor Wainer,
How do you justify your conclusion in the case of Russia, for example, where the government prohibits ownership of firearms; yet, as of the last year or two, Russia leads the world in the number of homicides and/or deaths by gunfire.
Or take a different extreme view. Cuba provides a good example. In that island, the government has complete control over every aspect of human life. Predictably, Cuba has a very low incidence of homicides and/or death by gunfire (with the exclusion of suicides, where, as of recent, it was among the world’s leaders). In this case, the “price to be paid” is the removal of personal freedoms, the absence of civil rights or due process, and the indifference of the government towards self dignity and individual enterprise.
The better question is the perennial, “what gives”? Of the factors in your study, the one that makes the most sense to me is “level of education”. If nothing else, perhaps it can be inferred that our national system of education appears to be failing the nation.
Regards,
Frank P. Soler, Ph.D.
Professor Emeritus
Math/Stats Dept.
De Ana College
Cupertino, CA 95014