
Understanding COVID-19 in 2020 Through the Lens of the 1918 “Spanish Flu” Epidemic

The 1918 “Spanish flu” epidemic has been described as the “most severe pandemic in recent history” (Centers for Disease Control and Prevention). Studying the history of that pandemic may provide useful insights into the possible courses and potential outcomes of the current COVID-19 pandemic. It is an important exercise, if for no other reason than, as George Santayana famously said, “Those who cannot remember the past are condemned to repeat it.”
A simple example concerning face masks is illustrative. Although face masks appear frequently in photographs of Americans during the epidemic (Figure 1), recommendations, requirements, and ordinances about masks in public were debated, challenged, and ignored—just as we have observed in response to COVID-19 in summer 2020.
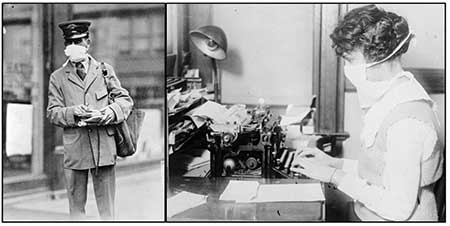
Figure 1. Letter carrier and woman typing in New York City illustrating use of masks in public and private spaces during the 1918 influenza epidemic.
Source: National Archives.
The United States is struggling to manage the current pandemic. Some projections show nearly 300,000 COVID-19 deaths in the U.S. by this fall, and that is before—or perhaps in the absence of—a potential second wave in the fall or winter.
Comparisons of the case rate and death rates between the United States and most other countries indicate that the U.S. is lagging in its ability to mitigate the effects of the disease. Thus, relevant lessons learned from 1918 are critical to helping alleviate the impact of COVID-19 in 2020.
How the 1918 influenza pandemic manifested in the state of Virginia, particularly in terms of fatalities and the characteristics of those who died by age, racial composition, and temporal and geographic distribution is helpful as a case study because, throughout the pandemic, that state kept detailed records, which was not true of all states. The statistical records that are available from 1918 provide an example of how the 1918 influenza severely affected one particular rural county in Virginia, while the state’s data can be compared and contrasted with today’s COVID-19 pandemic to draw some useful lessons learned.
A Brief History of the 1918 Pandemic
As early as March of 1918, outbreaks of a flu-like illness were detected in the United States; the first report of unusual flu activity may have been as early as that January. This first wave was mild and did not attract much attention (Crosby. 1989). The disease was unusually contagious, however, especially among soldiers on the front lines in Europe and in training camps in the United States. By July of 1918, even as newspapers bestowed the name “Spanish influenza” on the disease, most health officials predicted that it would soon disappear (Barry. 2004).
Of course, the disease did not disappear. In the United States, the deadliest phase of the 1918 influenza began in late August 1918, with widespread cases and a sudden increase in deaths in several army camps in the eastern United States (Bristow. 2012). By the middle of September, the number of cases and then deaths began to increase quickly in major cities, including Boston, New York, and Philadelphia, and then the rest of the country. In Virginia, the disease began among soldiers at Camp Lee and Camp Humphrey in early September, and then spread quickly among civilian populations across the state (State Board of Health and the State Health Commissioner to the Governor of Virginia. 1920).
By early October, influenza had reached epidemic proportions throughout the United States. In most cities and regions, the epidemic period lasted about two months, with rapid increases during the first couple of weeks, a peak of cases followed by a peak in deaths in the following week, and then a gradual decline, with the number of cases and deaths returning to normal levels at the end of this period. The number of deaths from influenza and pneumonia exceeded any previous totals in most regions of the country and caused an overall increase in death totals and rates across the United States.
In late 1918 and early 1919, many cities and regions recorded increased cases and deaths, although at a slower rate than had been the case during the fall weeks. In the six months from October 1918 to March 1919, an estimated 650,000 Americans died from influenza or pneumonia (Crosby. 1989), a toll of deaths within a relatively short period of time that has had no equal before or since.
Virginia as a Case Study
Virginia is an interesting case study for examining the 1918 epidemic because the state was broadly representative of national patterns and substantial documentation is available from the state Board of Health. Virginia was a registration state, which meant that it was among the 30 states for which detailed information about deaths was published annually in mortality statistics from the Census Bureau. Yet, the data for both Virginia and the United States are simultaneously extensive, incomplete, and inconsistent (see sidebar, below).
Sources of Statistical Information in 1918
The statistical evidence for historical analysis of the 1918 influenza epidemic in the United States is extensive and detailed, yet also incomplete and inconsistent. The U.S. Census Bureau annual reports on mortality provide extensive evidence about deaths, including analysis of causes, age groups, and time of year. The most-detailed annual publications, including the most-relevant report for 1918, are available only for the registration states, which were primarily in the Northeast, upper Midwest, and western coasts, with fewer states from across the South.
Across the United States, departments of health at the state and city levels collected, categorized, and published extensive data about deaths in their jurisdictions that provide extensive documentation for statistical analysis. Not all states or cities compiled and published these accounts, reports are not consistently available in digitized collections, and research with non-digitized materials was frozen in spring 2020 by the closure of research libraries.
City health departments, especially in the largest cities, documented cases and deaths in their populations, and these figures have dominated histories of the 1918 epidemic (Influenza Encyclopedia, University of Michigan Center for the History of Medicine). The statistics for rural populations, which made up half of the total population in the United States, have been mostly absent from historical analysis of morbidity and mortality during the epidemic. The available published statistics display inconsistencies in classifying cause of death, dividing age groups, defining ethnic and racial categories, and period of the reports.
Statistical Documentation in Virginia
The number of deaths reported in Virginia varied by sources. The U.S. Census reported 41,272 deaths in 1918, while the State Board of Health reported 44,083. This discrepancy is substantial: The state numbers were almost 7% higher than the Census data. One possible cause was the counting of stillbirths, which were excluded from the U.S. Census Bureau report. The Bureau collected more-complete records from physicians, undertakers, and health officers, which may also have accounted for the lower totals reported by the federal government.
In the case of influenza, the U.S. Census Bureau reported 7,839 deaths from influenza for the year 1918. The State Board of Health, however, reported 11,344 deaths from influenza for the same time period. What could explain this difference?
The answer lies in part in how deaths from the epidemic were counted. According to the state health department, Virginia had 2,140 deaths from pneumonia. The U.S. Census report, by contrast, reported 4,112 deaths from pneumonia. By combining these two categories, influenza and pneumonia, the numbers are closer: 11,951 deaths reported by the U.S. Census and 13,484 deaths reported by the Department of Health.
The Commonwealth of Virginia has changed substantially in the past 100 years. Virginia reported a population of slightly more than 8.5 million in 2019, with large urban centers in the north and east. In comparison, the population of Virginia in 1918 was slightly more than 2.2 million and primarily rural. Figure 2 shows the 1920 Census map of the population distribution by county, with between 18 and 90 inhabitants per square mile in most of the state.
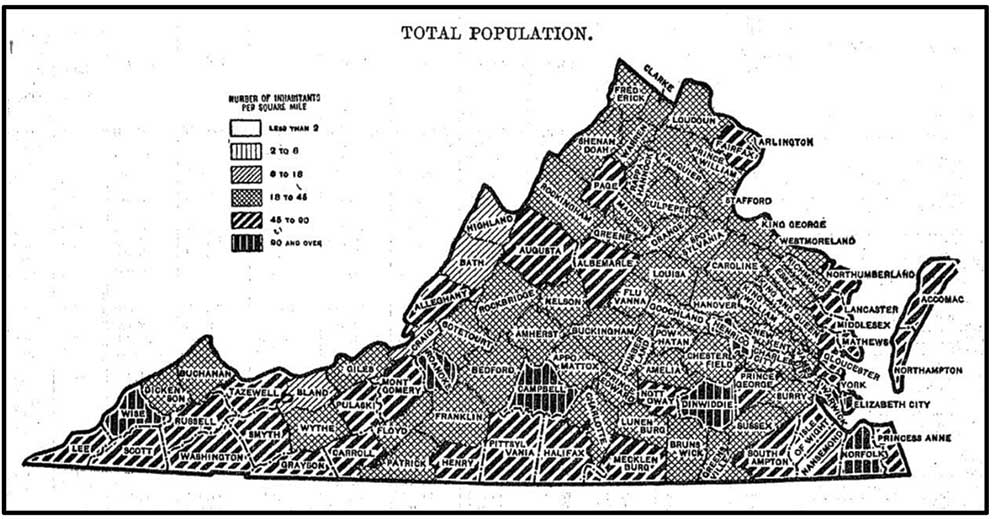
Figure 2. Density of the population of Virginia by county, per 1920 Census/State Compendium Virginia.
Virginia was among the first states to feel the effects of the epidemic, due to a very early outbreak in September 1918 at Camp Lee, near Richmond, but an elevated death rate lasted into early 1919. In 1918, Virginia reported death statistics for 116 locations, including cities and counties, which provides granular data for examining the spread and impact of the disease across the state. A closer look at Virginia’s statistics thus provides a way to think about how history can inform current discussions about COVID-19, as well as the ways that applying statistical analyses can inform our historical understanding of the 1918 pandemic.
Virginia vs. National Death Rates in 1918
As shown in Table 1, in 1918 Virginia reported a total of 41,272 deaths from all causes, for a death rate of 1,847 deaths per 100,000 population. This death rate was only slightly higher than the national rate of 1,754 deaths per 100,000 population. Virginia accounted for 2.8% of the U.S. population and 2.9% of the nationwide total deaths from all causes.
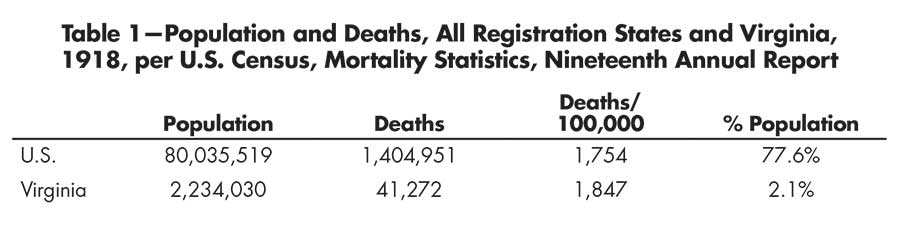
Table 1—Population and Deaths, All Registration States and Virginia, 1918, per U.S. Census, Mortality Statistics, Nineteenth Annual Report
According to the U.S. Census, Virginia’s death rate from influenza was higher than the national average: 284 deaths in the U.S. and 351 deaths in Virginia per 100,000 population. The fact that Virginia’s death rate was 25% higher than the national rate is probably related to two causes.
First, states in the East Coast region generally had higher than average death rates from influenza: Pennsylvania, Connecticut, New Hampshire, Massachusetts, North Carolina, and Maryland all had rates above the national average (although New York and New Jersey were below that average). Virginia’s death rate was, thus, similar to other states in the geographical region.
Second, and more importantly, the mortality rate from influenza may have been affected by the way deaths were recorded during the epidemic. Specifically, Virginia’s death rate from influenza was recorded as 25% higher than the national average, yet the death rate from pneumonia—the disease most closely associated with influenza—was 32% lower than the national average.
Combining deaths from influenza and pneumonia, using the method currently adopted by the Centers for Disease Control and Prevention (CDC), indicates that Virginia was very close to the national average: 555 deaths in the U.S. and 535 deaths in Virginia from pneumonia and influenza per 100,000 population.
In a retrospective study of autopsies performed in 1918 published in 2008, that included some surviving lung tissue, researchers at the National Institute of Allergy and Infectious Diseases found that “The majority of deaths in the 1918–1919 influenza pandemic likely resulted directly from secondary bacterial pneumonia caused by common upper respiratory-tract bacteria” (Morens, Taubenberger, and Fauci. 2008). The virus destroyed the cells in the bronchial tubes and lungs that normally protect the lungs. This allowed bacteria from the nose and throat to enter the lungs, causing pneumonia.
The researchers found that victims of the 1918 pandemic “uniformly exhibited severe changes indicative of bacterial pneumonia.” It was therefore difficult to distinguish influenza deaths from pneumonia deaths. While most were categorized as influenza, 1918 also saw an uptick in pneumonia cases at about the same time that the number of influenza cases increased.
Calculating epidemic deaths based on pneumonia and influenza actually distinguishes Virginia from other states on the East Coast, which generally reported higher death rates from these two diseases: 850 in Pennsylvania, 812 in Connecticut, 712 in New Jersey, and 681 in Massachusetts per 100,000. Virginia’s death rate from pneumonia and influenza combined is almost the same as New York’s at 551, also slightly below the national average. Thus, for the purposes of both understanding the severity of the 1918 epidemic and making useful comparisons with COVID-19, it is important to identify evidence that illustrates the actual toll from the disease (deaths from influenza and pneumonia) in contrast to differences in classification of cause of deaths at the time.
Virginia Death Rates Over Time
Statisticians during the 1918 epidemic used point-in-time comparisons to illustrate the importance of the epidemic. The most-useful comparison was between years, because it illustrated how dramatically the epidemic affected death totals and rates, and how much 1918 departed from usual patterns of mortality.
The Virginia State Department of Health reported 44,083 deaths in 1918, an increase of nearly 40% over the 31,739 deaths reported in 1917. As the department’s annual report discussed, this increase was explained almost entirely by the 11,641 deaths from influenza, which accounted for 95% of the increased total.
As shown in Figure 3 and Table 2, a comparison of death rates by disease over years further illustrates the substantial increase in influenza deaths in 1918. Tuberculosis, which had been the single greatest cause of death for the previous several decades, rose only slightly in 1918. The pneumonia death rate also increased in 1918, but had been increasing gradually over the previous five years.
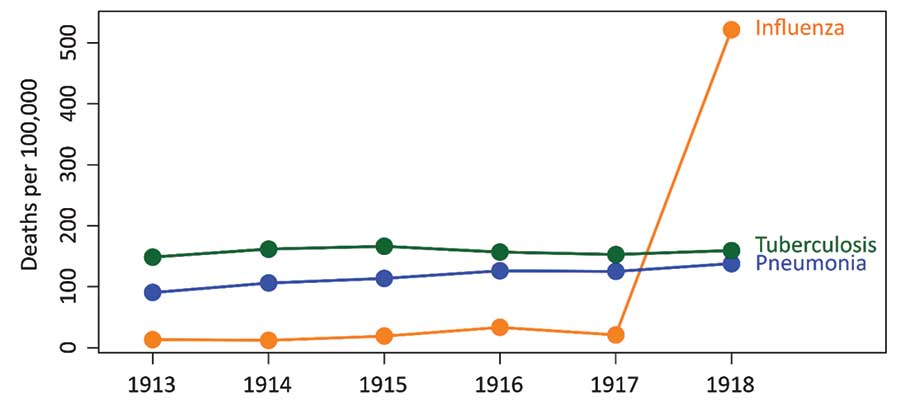
Figure 3. Death rates per 100,000 for influenza, tuberculosis, and pneumonia from 1913 through 1918.
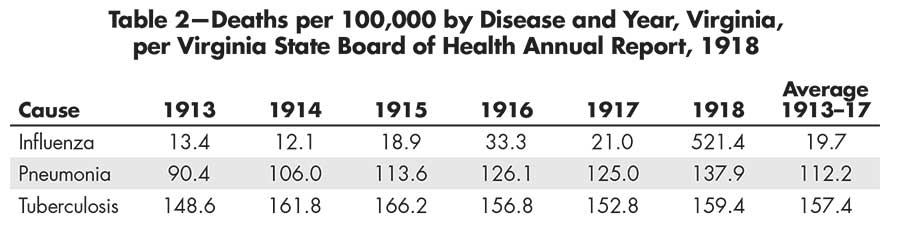
Table 2—Deaths per 100,000 by Disease and Year, Virginia, per Virginia State Board of Health Annual Report, 1918
In contrast, the death rate from influenza, which had previously ranged from a low of 12.1 per 100,000 in 1914 to a high of 33.3 per 100,000 in 1916, was 25 times higher in 1918 (521.4 per 100,000) than the average annual rate (19.7 per 100,000) for the previous five years.
Deaths by Race
In the United States, statistics in the early 20th century were often recorded by race. In Virginia, deaths were recorded as “White” or “Colored,” with the latter primarily including African Americans, following the pattern in most southeastern states. In Virginia, African Americans accounted for about 30% of the total population, with the counties and cities reporting the highest percentages of African Americans in southern and eastern regions of the state, as well as in major cities.
As shown in Table 3, the epidemic seemed to have similar effects on both the majority and minority populations in terms of pneumonia and influenza as a fraction of all deaths. However, because African Americans had a disproportionately higher number of deaths compared to their representation in the population (42.5% of deaths from all causes vs. 30% of the population), they also had a disproportionately higher number of deaths due to the 1918 pandemic, as Figure 4 shows.
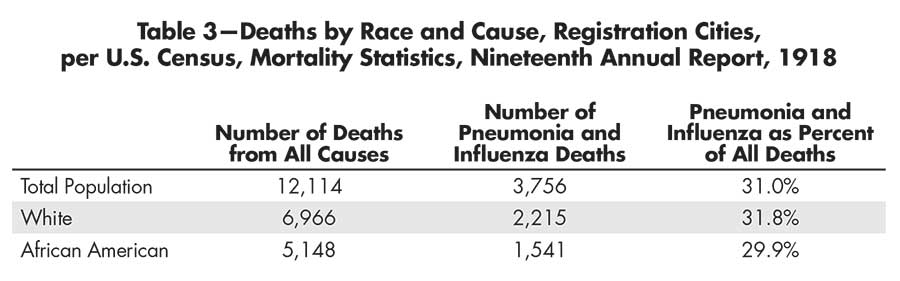
Table 3—Deaths by Race and Cause, Registration Cities, per U.S. Census, Mortality Statistics, Nineteenth Annual Report, 1918
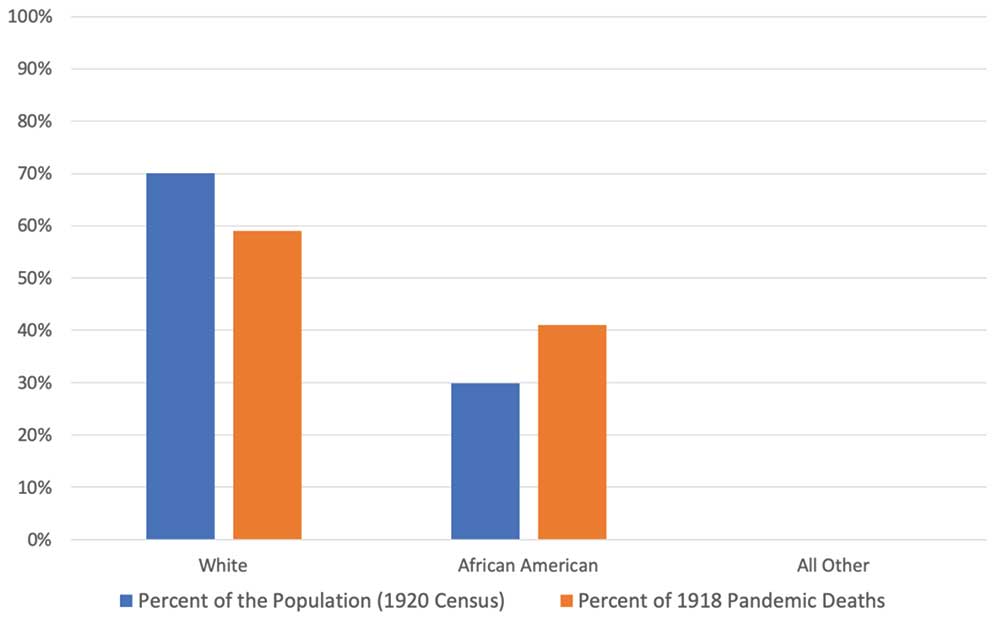
Figure 4. African Americans had a disproportionately higher percentage of deaths attributable to the 1918 pandemic in comparison to their representation in the population.
Deaths by Age
The 1918 influenza epidemic produced remarkable distributions of deaths by age. This pattern was evident to public health officials—and especially statisticians—at the time, although the causes remain unclear. Specifically, in Virginia in 1918, children under the age of 5 accounted for 25.1% of all deaths; youths aged 5 to 19 accounted for 10.6%; adults age 20 to 49 made up 32.7% of all deaths; and older populations, aged 50 and above, accounted for 31.6% of all deaths.
As shown in Figure 5 and Table 4, the distribution of influenza-related deaths by age group varied dramatically from the distribution for all other deaths, with influenza-related deaths much more likely to occur in youth and young adults. Specifically, adults aged 20–49 accounted for 50% of influenza deaths and just 28% of deaths from other causes. Youths aged 5 to 19 displayed a similar pattern, accounting for 20% of influenza deaths and just 8% of deaths other than influenza.
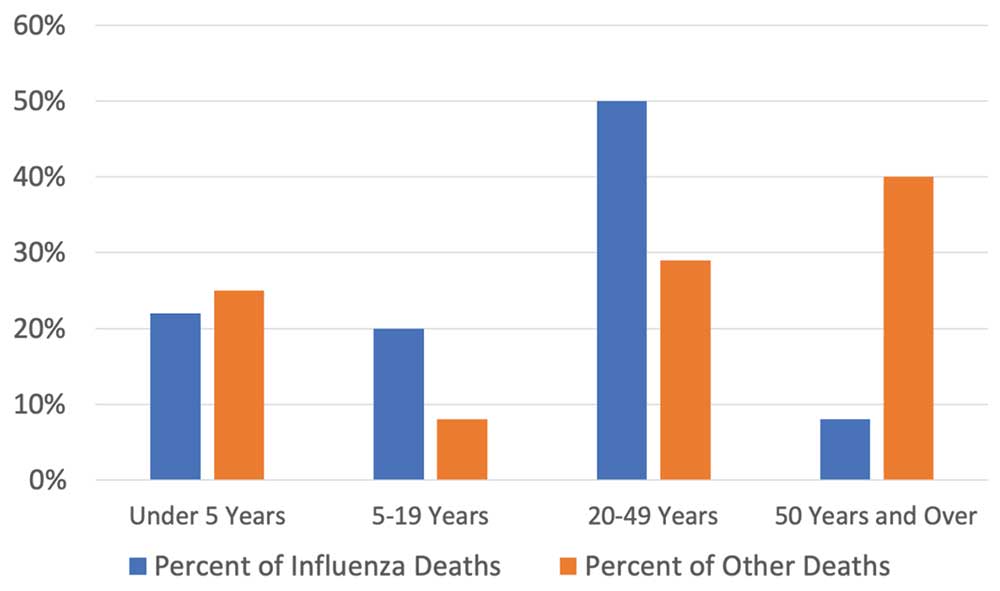
Figure 5. Comparison of the percent of deaths attributable to influenza versus other causes by age group.
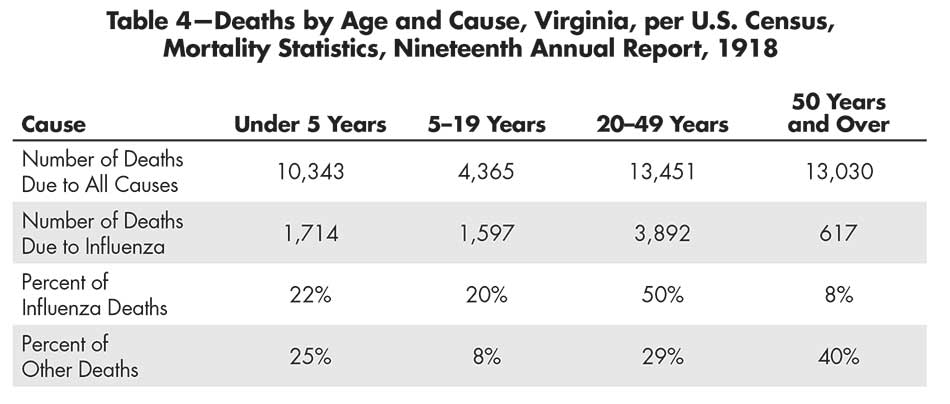
Table 4—Deaths by Age and Cause, Virginia, per U.S. Census, Mortality Statistics, Nineteenth Annual Report, 1918
By contrast, the oldest age group—those over 50—accounted for only 8% of influenza deaths, but 37% of deaths from other causes. Among children aged 5 or less, the ratio was more consistent: 22% of influenza deaths and 26% of non-influenza deaths.
Regional Variation
The reporting of deaths during the epidemic reveals striking variation by location. The highest death rates overall and from influenza occurred in large cities, as well as counties along the western border of the state. Early in the pandemic, the virus spread mostly among military troops who were preparing for service in World War I. The high density in sleeping quarters, along with transfers among camps, led to a rapid spread of influenza across the country. Camp Lee, 25 miles south of Richmond and 75 miles west of the naval base at Norfolk, experienced 634 deaths (Army Military History), and the virus quickly spread to Richmond.
According to records of the State Department of Health, the 28 locations with death rates above the state average included 12 cities. By contrast, only four cities were listed among the 90 locations that had death rates from all causes below the state average. The locations with higher than average death rates also included counties in close proximity to urban areas, which confirms the general pattern cited above. This distribution suggests that mortality rates were higher in cities than in counties when measured by all causes during the year 1918. Figure 6 shows a choropleth map illustrating the death rates by county/city in Virginia.
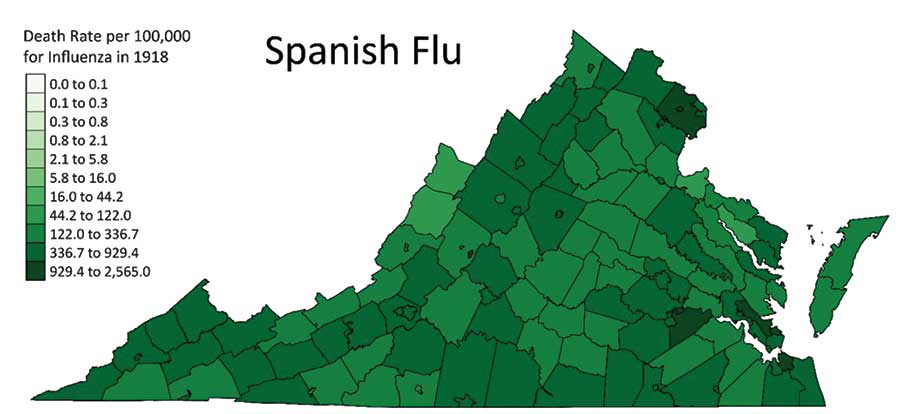
Figure 6. Death rates from influenza per 100,000 in Virginia, 1918.
Table 5 shows the 20 cities and counties with influenza death rates above the state average. Among the highest 20 influenza death rates:
- • Six were in the far western part of Virginia (Buchanan, Dickenson, Lee, Tazewell, Smyth, and Wise).
- • Five were near the naval base at Norfolk (Warwick, Newport News City, Elizabeth City, York, and James City), where many soldiers embarked for the war in Europe.
- • Three were near Washington, D.C. (Fairfax, Alexandria City, and Prince William).
- • Two were near Camp Lee (Petersburg and Prince George).
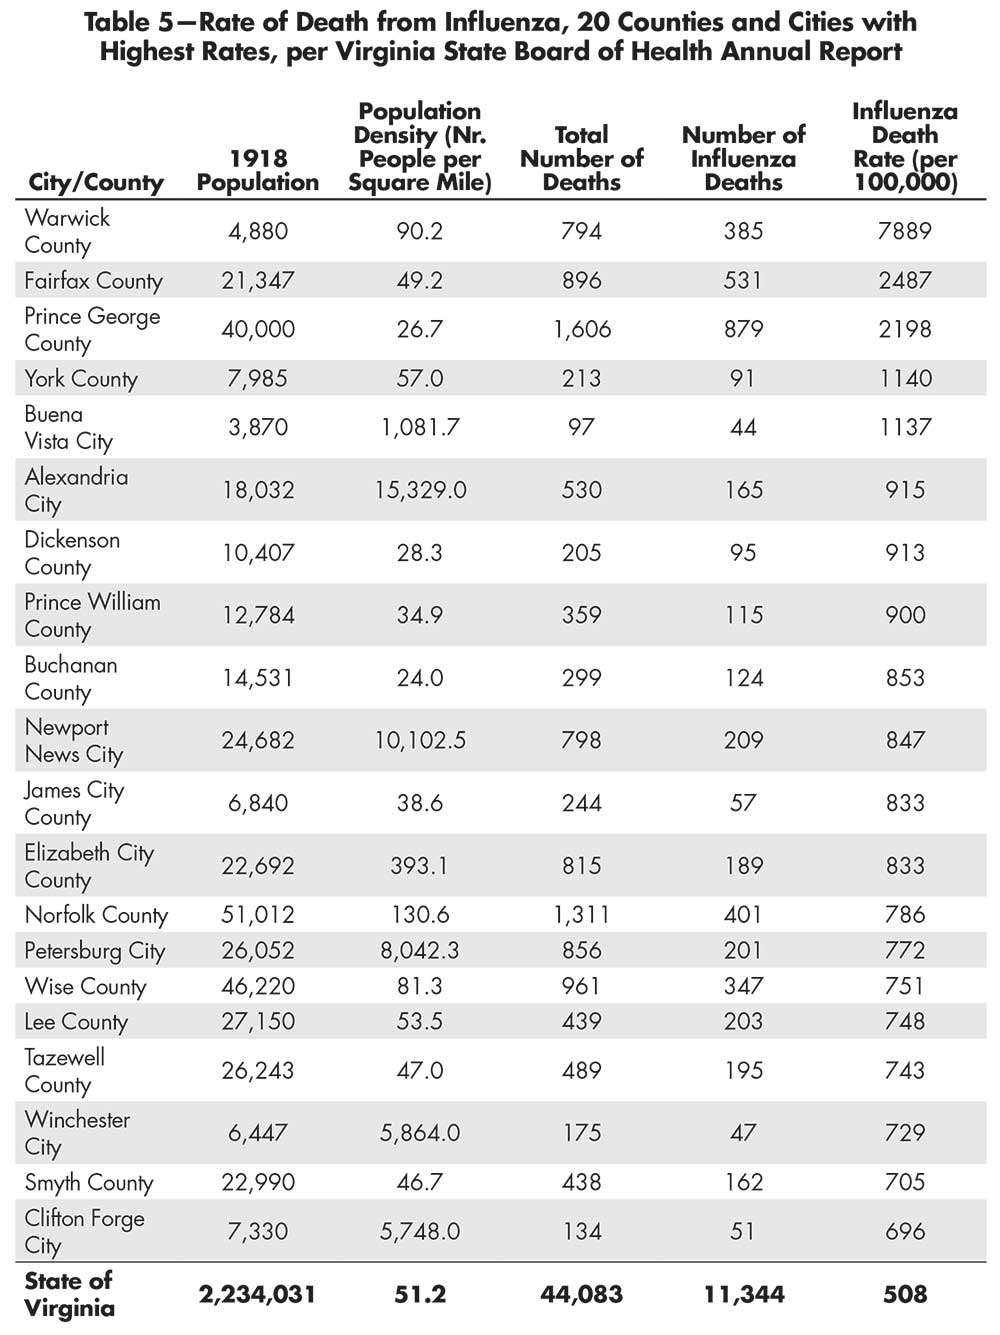
Table 5—Rate of Death from Influenza, 20 Counties and Cities with Highest Rates, per Virginia State Board of Health Annual Report
The other counties/cities in the top 20 are scattered through the central and northern parts of Virginia.
A comparison of influenza death rates to non-influenza death rates provides a different perspective. Most of the cities that recorded high overall death rates also recorded above-average influenza death rates. However, as shown in Figure 7, six counties in southwestern Virginia had relatively low population density and below-average non-influenza death rates, but high death rates from influenza. This distribution suggests three important qualifications for understanding the 1918 influenza epidemic:
- • The pattern of higher deaths in cities and lower deaths in rural communities did not apply uniformly across the state.
- • The counties in western Virginia that recorded higher death rates from influenza, even as the overall death rates were at or below state averages, probably had some underlying conditions that caused these higher death rates. For example, these counties had coal mining operations, which suggests a possible connection between deaths in the epidemic and other factors causing respiratory disease and deaths. This analysis may not be accurate, however, because these same counties reported deaths from tuberculosis at or below the state average.
- • The relatively high death rates from influenza are thus suggestive of the pattern of infectious diseases, which is the tendency to spread widely and cause deaths among isolated populations.
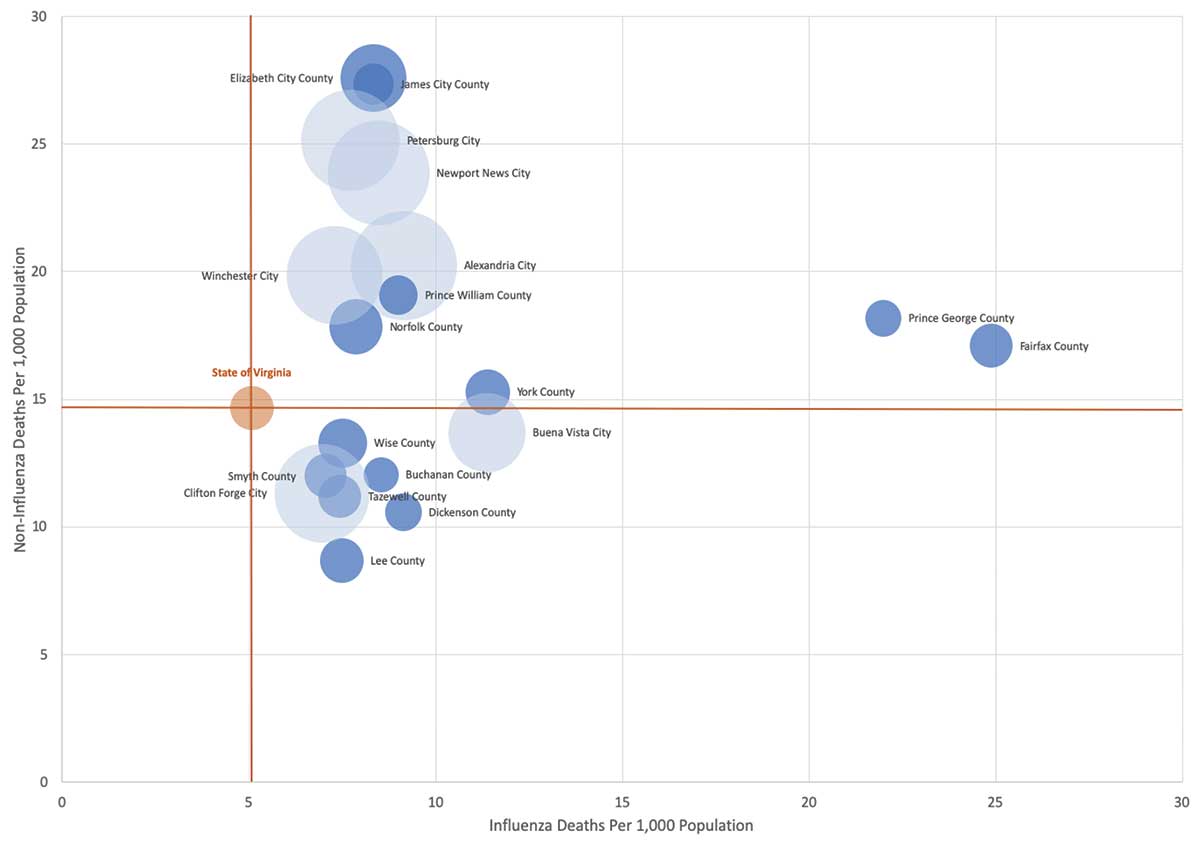
Figure 7. Bubble chart of 20 cities and counties with highest rates of influenza deaths. Bubble size is proportional to the log of the population density and are color-coded by city (light blue) versus county (dark blue).
Chance as well as cause may have played a role in some cases. For example, Dickenson County just happened to have its county fair at the same time as the influenza outbreak. This caused what today we would call a “superspreader” event that resulted in substantially higher mortality (see sidebar, below).
An Account of the Outbreak in Dickenson County
As the worst stages of the influenza epidemic came to end, public health officials looked for explanations for the remarkably high toll of lives lost to this disease. These efforts provide further evidence of how the statistical record of the 1918 epidemic was shaped by the context in which victims lived and health officers worked.
In October 1918, the Virginia Board of Health sent inspectors into remote communities of southwestern Virginia to determine the impact of the epidemic (Big Stone Gap Post. 1918). One inspector submitted this graphic account of the suffering experienced by a coal mining community:
In Dickenson County, which has only one railroad, the “flu” literally ran riot, and it is little to be wondered at that many persons became panic stricken, for in some sections they saw death and suffering on every side. Worse still, the disease did its deadly work with horrifying rapidity and no man, sick or well, could tell when his hour might come…In one household four out of ten people succumbed to the malady. And is it any wonder that their neighbors became demoralized when they saw a quartette of coffins standing in front of this stricken home? The sight that met their gaze was a hideous allegory of menace and tragedy.
After describing the terrible toll taken on other families, the inspector ended with speculation about the course of a disease in a sparsely populated community:
So far as Dickenson County is concerned, it may at first appear strange that so isolated a section should have been so sorely afflicted when the health authorities everywhere proclaim that Spanish influenza is “a crowd disease.” Well, everybody would have to admit that Dickenson’s heart-rending story presents a sort of scientific mystery, were it not for the fact that her people had their county fair just a few days before the scythe of death began to reap its human harvest. That fair probably did the work which has left desolation in its wake.
This description of the tragic costs of an epidemic in an impoverished community, and the determination to find a simple answer for the spread of the disease, provide lessons relevant to Americans dealing with COVID-19. Compassion for victims and appreciation of the costs of the epidemic must be balanced by an appreciation of the complex processes by which diseases spread among all populations. As Americans facing the threat of COVID-19 learn about disease transmission, methods of contact tracing, and the challenges of sustaining social distancing, we need to appreciate both the human costs and the efforts of public health officials a century ago in dealing with a devastating epidemic.
Case Fatality Rate
During the 1918 epidemic, the case fatality rate—the percent of cases that result in deaths—was 3.5% in Virginia (11,344 deaths from 326,195 cases). These figures are suggestive for several reasons:
- • The fatality rate from influenza during the epidemic was much higher than the normal fatality rate from seasonal influenza. The very high fatality rate shocked physicians and public health officials, who did not anticipate that so many patients would die from such a familiar disease.
- • The total number of cases indicates how widely this disease spread during the epidemic. According to these figures, approximately 15%, or about one person in seven, of Virginia’s population became sick with influenza, which is remarkably high for any disease.
- • These figures probably underestimate the total number of cases, because they only include people who became sick enough to go to a doctor or hospital and whose illness was recorded and reported to health officials. Many doctors and hospitals were so overwhelmed at the peak of the epidemic that they stopped reporting cases.
In some locations, health officials later admitted that possibly only one-half of cases were actually reported. If that estimate is true for all of Virginia, it suggests two important qualifications to these numbers: The infection rate could have been twice as high, meaning 600,000 influenza cases, or about one in three in the population—a remarkably high rate of infection. Doubling the number of cases, of course, cuts the case fatality rate in half: Approximately 16,000 deaths from 600,000 cases means that the actual case fatality rate was closer to 1.8%. While this rate is still much higher than the usual fatality rate for seasonal influenza, it is important for situating the total deaths in relation to the number of influenza cases and the total population.
The 11,344 deaths from influenza accounted for 0.5% of the total population of 2.2 million. Even during this deadliest epidemic event in world history, in other words, roughly one of every 200 Virginians died of this disease. To make the same statement in a different way, nearly 200 Virginians survived the epidemic for every one person who died of influenza. Even among those who fell ill with this disease during the epidemic, approximately 30 to 40 survived their illness for every one patient who died. These numbers are important for thinking about how to calculate the costs of the epidemic, because they remind us that both survival and deaths were part of the historical experience, as well as the statistical record.
Deadliest Months
The most-striking measure of the epidemic’s impact was the timing of deaths. In 1918, 21% of all deaths occurred in just one month: October 1918. The last three months of the year—October, November, and December—accounted for 40% of deaths for the year, nearly 80% of all deaths due to pneumonia and influenza, and a remarkable 95% of all influenza deaths.
Furthermore, the effects of the influenza epidemic continued into the following year. In 1919, Virginia recorded 4,525 deaths from influenza, less than half the total of 11,344 deaths from influenza recorded in 1918, but almost 10 times the 540 deaths from this cause reported in 1917 (Virginia State Board of Health Annual Report, 1917).
The timing of deaths in 1919 provides further evidence of the long-term implications of the epidemic. In Virginia, the 8,639 deaths recorded in October 1918 were by far the largest toll in any month in the five years before, during, and after the epidemic. For October 1918, it was more than double the next-deadliest month, January 1919, and four times higher than the average of 2,157 for October in 1916, 1917, 1919, and 1920. Of the 60 months in that five-year period, five of the six deadliest were associated with this epidemic: October, November, and December 1918, and January and February 1919.
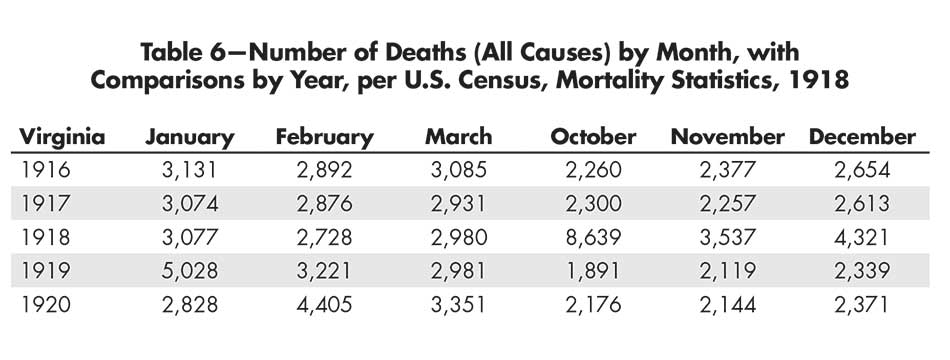
Table 6—Number of Deaths (All Causes) by Month, with Comparisons by Year, per U.S. Census, Mortality Statistics, 1918
The top time series plot in Figure 8 shows the rate of deaths per day per 100,000 in 1918, where the second and third waves of the pandemic are clearly visible as spikes of double and triple the average daily death rate, which was about 1 in 100,000. The middle plot in Figure 8 displays the excess death rate above the average, where monthly fluctuations and trends are visible, as are the spikes. Most of this excess can be explained by influenza and pneumonia.
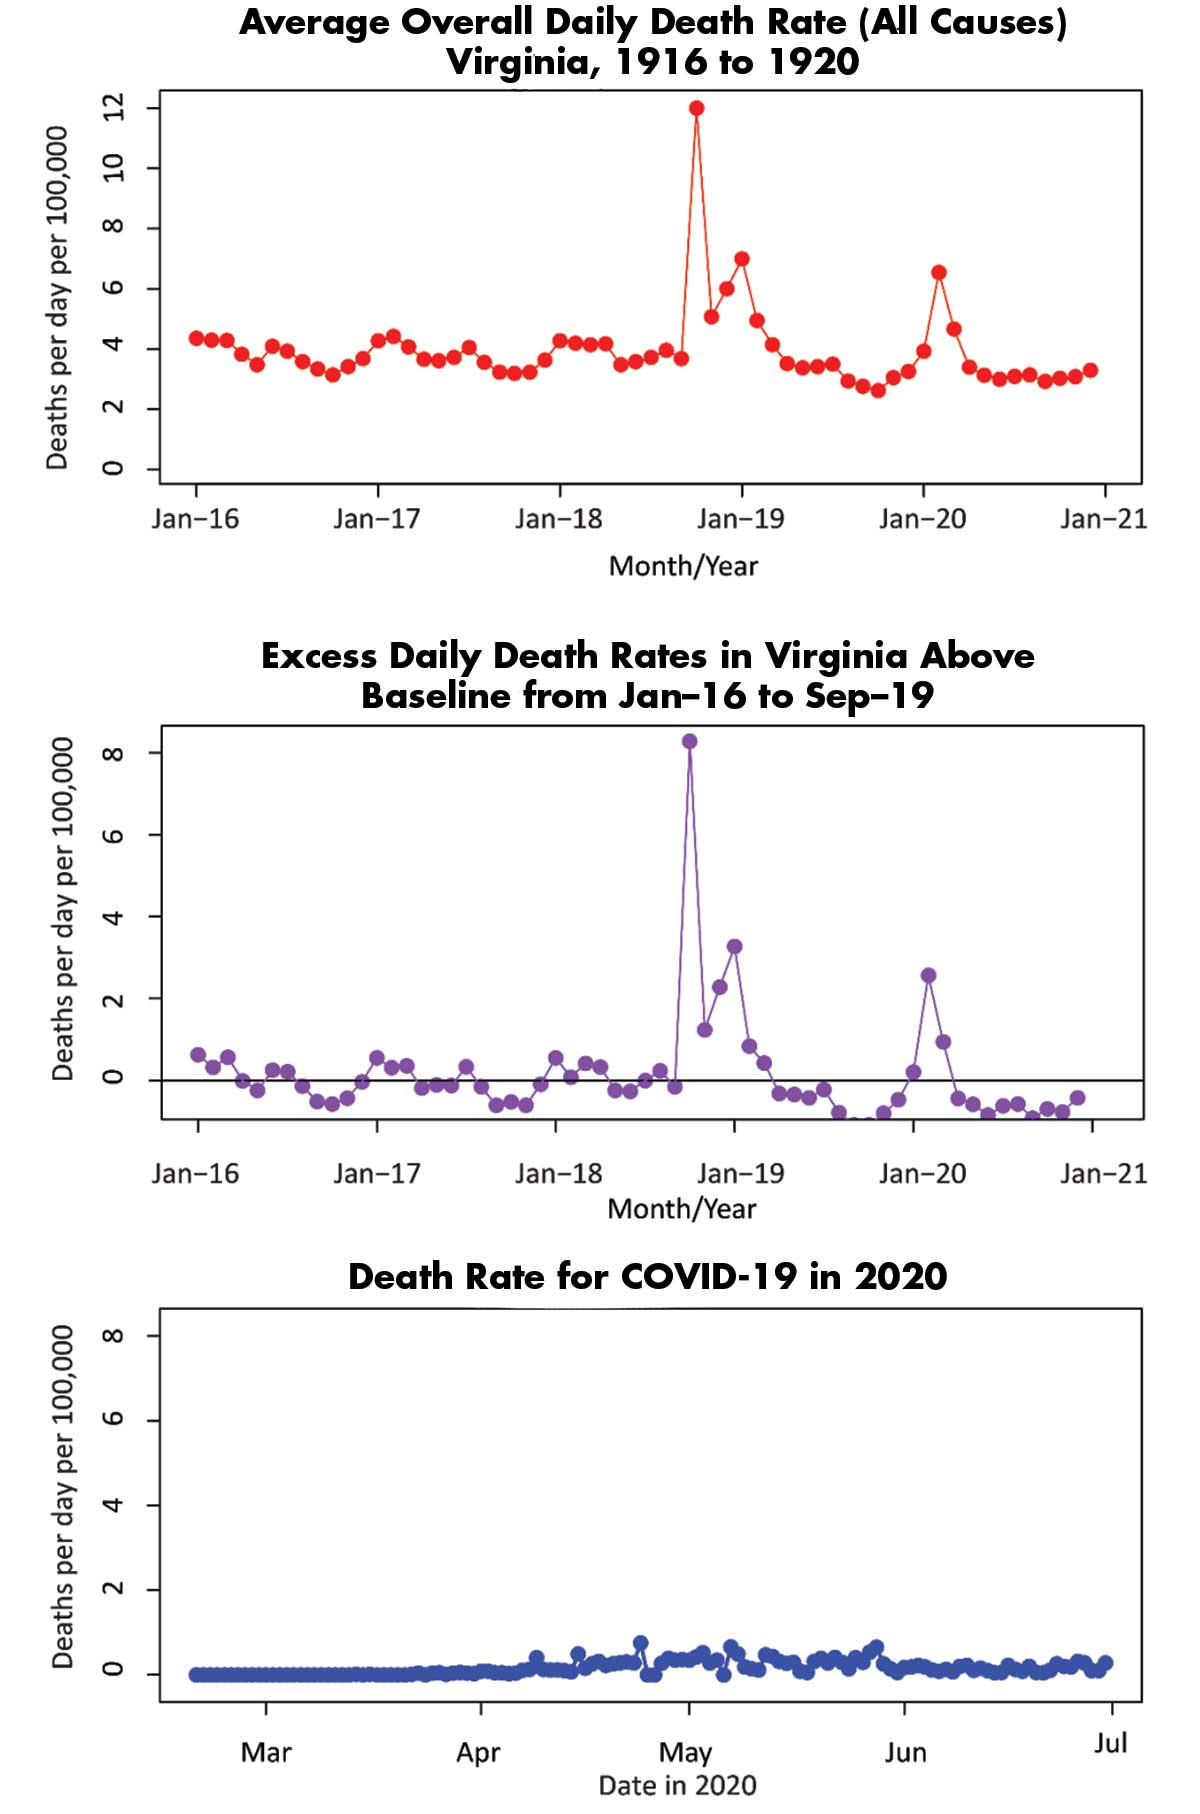
Figure 8. Comparison of death rates from all causes for 1916 through 1920 (top), excess death rate (middle), and COVID-19 death rate in 2020 to date (bottom).
Comparing the 1918 Pandemic to COVID-19 (Thus Far)
Comparisons between the 1918 pandemic and COVID-19 are challenging for a number of reasons.
First, there are clear differences between the two viruses. The 1918 influenza was an H1N1 virus, so in that sense, it was closer to the 2009 “swine flu” outbreak, while COVID-19 is biologically more like the 2003 severe acute respiratory syndrome (SARS) virus of 2003.
Second, the substantial scientific, medical, and public health advances since 1918 should mitigate the morbidity and mortality from these diseases today compared to 100 years ago.
Third, COVID has only been in Virginia for about seven months, so comparing to an annual number from 1918 requires forecasting its death rate. Such a forecast would require strong assumptions about the future course of COVID-19.
Fourth, we are still in the first wave of COVID, where the majority of deaths in 1918 came during the second and third waves.
In spite of such challenges, similarities and differences between the 1918 pandemic and COVID-19 have already been observed. One clear difference is the death rate by age. As shown in Figure 9, the 1918 pandemic-related deaths were concentrated among those under 50, while COVID-19 is concentrated on those over 50 and it is substantially more lethal for people in their 70s and 80s. Also, as shown in Figure 10, COVID-19 death rates are disproportionately higher for African Americans, although the disparity is not as large as it was during the 1918 pandemic (see Figure 4).
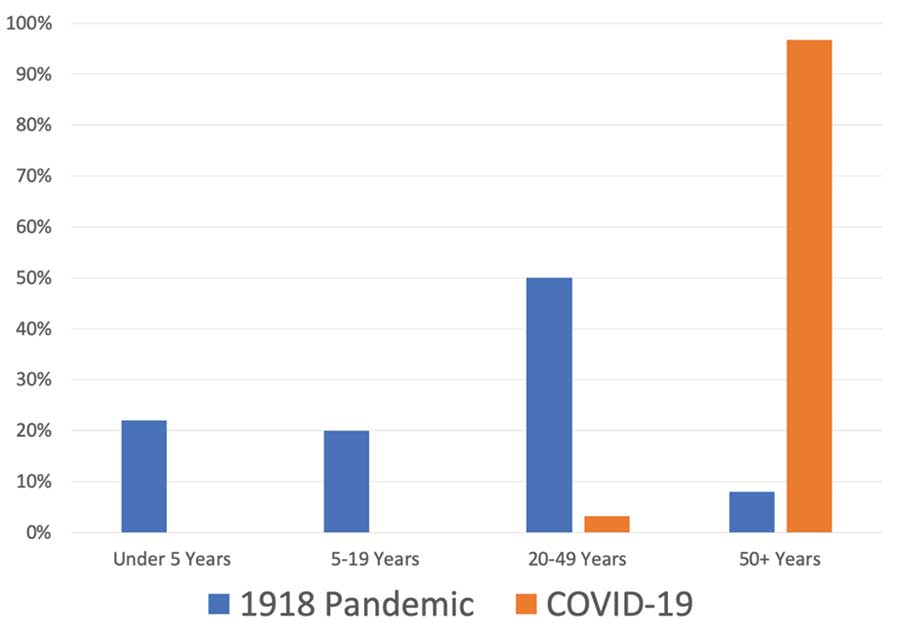
Figure 9. Distribution of death by age category for the 1918 pandemic versus COVID-19.
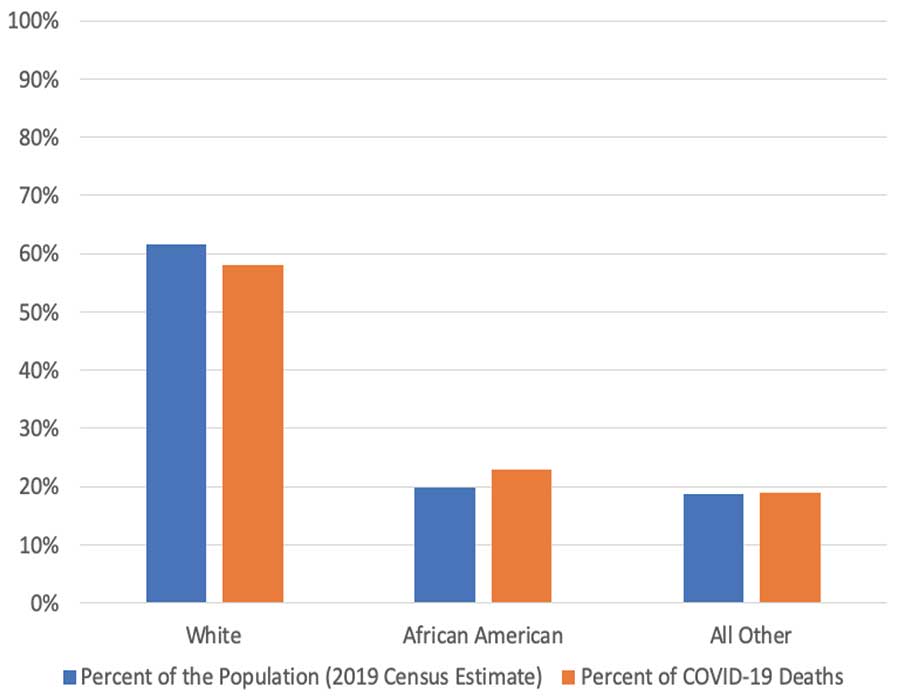
Figure 10. African Americans have a disproportionately higher percentage of deaths attributable to COVID-19 in comparison to their representation in the population, but the difference is less than in 1918 (see Figure 4).
In 1918, Virginia reported 13,484 deaths from pneumonia and influenza. This total accounted for 0.6% of the total population of 2.2 million, or one death for every 163 Virginians.
In 2020, Virginia’s population is 8.6 million. An epidemic with a similar death rate would cause just under 53,000 deaths. As of August 14, 2020, Virginia had reported 2,370 deaths from COVID-19 or just 4.5% of the 1918 death rate. The lower death rate probably reflects both that COVID-19 has been less virulent than the 1918 pandemic and that various non-pharmaceutical interventions (i.e., social distancing measures) have been successful.
The interventions taken to slow the spread of the virus (or “flatten the curve”) may have had three effects: Help keep the healthcare system from being overwhelmed; allow time to develop and test treatments, and eventually a vaccine; and let the virus weaken. There is no guarantee that the virus will weaken, but many viruses do weaken over time, since the death of a host is also fatal for the virus.
In October 1918, the overall death rate in Virginia spiked from about 3 per 100,000 the previous month to 12 per 100,000. The COVID-19 pandemic has not seen such a large spike, but after decreasing for a while, the number of new cases is once again increasing. In late June and early July 2020, the number of cases increased dramatically in the nation, from an average of about 20,000 per day in late May and early June to 50,000 or more as of July and August. This increase is driven in large measure by states that loosened social distancing measures quickly. This has translated into a significant increase in the national death rate, although its effect on other parts of the country, such as Virginia, is yet to be seen.
The bottom plot in Figure 8 shows that the daily death rate through June for COVID-19 in Virginia is substantially lower than the daily death rates for the influenza pandemic of 1918, although the timescale in the bottom plot is so much shorter that we may still be in the early stages of the current pandemic. Figure 11 shows a choropleth map for COVID deaths occurring in the first half of 2020; that is, March through June. Since the shading scale is the same for Figures 6 and 11, a comparison of the plots visually shows how much more virulent the 1918 pandemic was in comparison to what we have experienced to date with COVID-19: COVID-19 has been about 1/10 as deadly as the 1918 pandemic in Virginia…so far.
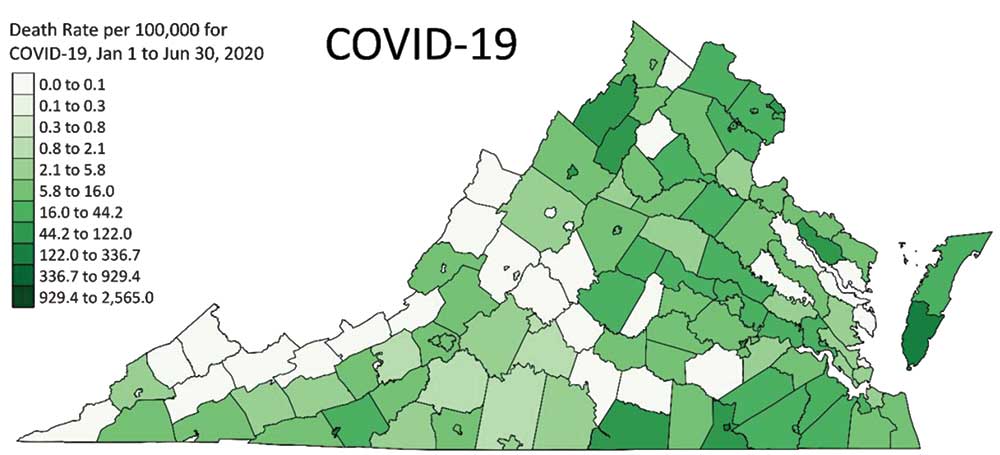
Figure 11. Death rates from COVID-19 per 100,000 in Virginia, 2020.
Some Lessons Learned
As noted, it is important to be cautious about making comparisons between 1918 and today, but some striking parallels and consistencies do suggest relevant lessons learned, including these.
- • In the summer of 1918, the pandemic waned and authorities were quick to say that it had passed, only to have it return even more strongly in the fall. We have already seen that loosening social distancing and other non-pharmaceutical interventions can lead to a resurgence of COVID-19. As we enter the fall, we would do well to keep the 1918 pandemic timeline in mind and be very cautious about avoiding conditions that would lead to a large second wave.
- • As with the 1918 pandemic, COVID-19 started in metropolitan areas and only slowly spread to more-rural locations. However, spread it did and, when the timing of its arrival coincided with public events, such as in Dickinson County, Virginia, the result could be catastrophic. This suggests that more rural areas today would do well not to ignore COVID-19 or underestimate its ability to affect their regions with serious consequences.
- • As in 1918, today we see that COVID-19 disproportionately affects some members of our communities more than others. The reasons for this are likely to have to do with historical inequities in employment and medical care; disparities in comorbidities, such as diabetes, asthma, and hypertension; and other reasons. As we move through this pandemic, we would do well to remember that these inequities from 100 years ago still exist today. We should work to eradicate them once and for all.
In 2020, as they did in 1918, public health authorities struggle to convince the public to change behaviors in ways that could contain the spread and mitigate the impact of infection disease. A placard distributed by the Virginia State Board of Health in October 1918 (Figure 12) will seem very familiar to anyone observing recommendations of public health authorities in 2020: Practice good personal hygiene, cover your cough and sneeze, avoid crowded spaces, wear masks when possible, and stay home if you are sick. Then, as now, there was a great desire to move past the pandemic as people tired of social distancing and wearing masks.
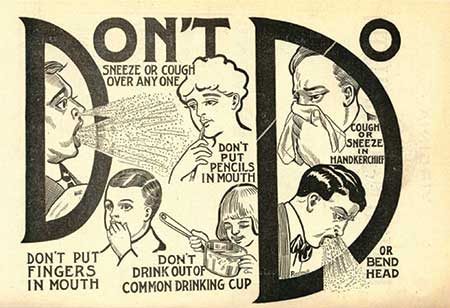
Figure 12. How to Save Yourself and Others from Influenza, October 1918, distributed by the Virginia State Board of Health (Virginia Health Bulletin).
An important lesson from 1918 is that we should not let our guard down too soon nor fall prey to the idea that just because we wish the pandemic would go away, it actually goes away. Rather, it is critically important that we let our knowledge of history, science, and statistics and data guide us through this pandemic.
Further Reading
1918. Flew on the Wings of Death to the Hills. Big Stone Gap Post, p. 1.
Barry, J.M. 2004. The Great Influenza. The Story of the Deadliest Pandemic in History. New York: Penguin Books.
Bristow, N. 2012. American Pandemic. The Lost Worlds of the 1918 Influenza Pandemic. New York: Oxford University Press.
Centers for Disease Control and Prevention. 1918 Pandemic (H1N1 Virus).
Crosby, A. 1989. America’s Forgotten Pandemic. The Influenza of 1918. Cambridge: Cambridge University Press.
Government Printing Office. 2020. State Compendium Virginia, Fourteenth Census of the United States, p. 11. Washington, DC.
https://history.army.mil/curriculum/wwi/docs/AdditionalResources/presentations/Camp_Meade_Flu.pdf.
Morens, David M., Taubenberger, Jeffery K., and Fauci, Anthony S. 2008. Predominant role of bacterial pneumonia as a cause of death in pandemic influenza: implications for pandemic influenza preparedness. Journal of Infectious Diseases 198.7: 962–970. See also https://www.nih.gov/news-events/news-releases/bacterial-pneumonia-caused-most-deaths-1918-influenza-pandemic.
Superintendent of Public Printing. 1920. Annual Report of the State Board of Health and the State Health Commissioner to the Governor of Virginia for the Fiscal Year Ending September 30, 1919.
University of Michigan Center for the History of Medicine. n.d. City Case Study, Influenza Encyclopedia. Richmond, VA.
U.S. Census. 1918. Mortality Statistics, Table 10: Deaths by Cause and Month, 494.
U.S. Census. 1920. Mortality Statistics, 1918, Nineteenth Annual Report, Table 5, Deaths (Exclusive of Stillbirths) in the Registration Area. Washington, DC, 234–235.
U.S. Census. 1920. Nineteenth Annual Report, Table 6: Deaths (Exclusive of Stillbirths) in the Registration Area, Mortality Statistics, 1918. Washington, DC, 254.
U.S. Census. 1920. Mortality Statistics, 1918, Nineteenth Annual Report, Table 8, Deaths (Exclusive of Still Births) in the Registration Area, by Cause of Death from Each Cause and Class of Causes, by Age. Washington, DC, 418–420.
Virginia Health Bulletin. 1918. Vol. 10, No. 8.
Virginia State Board of Health. 1917. Annual Report for 1917, Table IV, Total Number and Rates of Deaths by Cities and Counties, 104-106; Virginia State Board of Health Annual Report for 1919, Table IV, Total Number and Rates of Deaths by Cities and Counties, 106–108.
Virginia State Board of Health. 1918. Annual Report, Table VII, 156.
Virginia State Board of Health Annual Report. 1918. Table IX: Important Causes of Death in Virginia by Years, 162.
About the Authors
E. Thomas Ewing is a professor in the Department of History at Virginia Tech. He teaches courses in Russian, European, and world history. His research on the history of epidemics, including the Russian flu (1889) and Spanish flu (1918), has been published in Influenza and Other Respiratory Viruses, Current Research in Digital History, Computer IEEE, and Medical History. At Virginia Tech, he coordinates the Data in Social Context program, which sustains an interdisciplinary approach of data analytics, computational skills, and critical thinking in the humanities and social sciences. He has received funding from the National Endowment for the Humanities to run workshops on the 1918 Spanish influenza, images and texts in medical history, and viral networks.
Ronald D. Fricker, Jr. is a professor of statistics and an associate dean in the Virginia Tech College of Science. He is the author of Introduction to Statistical Methods for Biosurveillance, published by Cambridge University Press, and co-author with Steve Rigdon of Monitoring the Health of Populations by Tracking Disease Outbreaks and Epidemics: Saving Humanity from the Next Plague, published by the American Statistical Association and CRC Press. He is a Fellow of the American Statistical Association, an Elected Member of the International Statistical Institute, and a Fellow of the American Association for the Advancement of Science.
Steven E. Rigdon is a professor in the Department of Epidemiology and Biostatistics at Saint Louis University. He is also a Distinguished Research Professor Emeritus at Southern Illinois University Edwardsville. He is the author of Calculus, 8th and 9th editions, with D. Vargerg and E. Purcell, published by Pearson; Statistical Methods for the Reliability of Repairable Systems, with A.P. Basu, published by Wiley; and Monitoring the Health of Populations by Tracking Disease Outbreaks and Epidemics: Saving Humanity from the Next Plague, with R. Fricker, published by the American Statistical Association and CRC Press. His research interests include disease surveillance, quality surveillance and control, recurrent events, and statistical methods in sports. He is a Fellow of the American Statistical Association and currently the editor of Journal of Quantitative Analysis in Sports.


I really enjoyed this paper.
It would be great to have the data that you used for the classroom (when we get back to them).
Is it possible to get access?
Thanks, Joe
PS The lack of data references is one of my gripes with Chance.