
Putting the ‘Hot Hand’ on Ice

There is a widespread perception among sports fans that success of players and teams is more likely when recent efforts have also been successful. This belief was first scientifically reported in 1985 by psychologists Thomas Gilovich, Robert Vallone, and Amos Tversky, who found that 91% of basketball fans believe that a player has “a better chance of making a shot after having just made his last two or three shots than he does after having just missed his last two or three shots.”
The term “hot hand” is often used to describe such beliefs. During professional sportas television or radio broadcasts, announcers commonly refer to the hot hand, using phrases such as “hot streaks” or “streaky shooting” or a player being “on fire.” Streaks and “hotness” are an important part of the culture of sports. Perhaps the most famous record in American sports is Joe DiMaggio’s 56-game hitting streak; in the film “Bull Durham,” Crash Davis famously offers clever ways to “respect the streak”; there is a well-known ethos in baseball to never talk about a no-hitter in progress; and in the NHL playoffs, the length of a player’s beard is often seen as superstitiously proportional to the number of playoff wins. In fact, sports fans are so committed to the idea of the hot hand that inefficiencies in the betting market have been shown to arise as a result. NBA teams tend to under-perform relative to the point spread if they enter the game having won consecutive prior games, a reflection of expectations artificially in favor of the streaking team relative to its true ability. Similarly, NFL teams tend to attract a greater share of the betting pool if they have won a number of consecutive previous games against the point spread.
While there is an overwhelming body of evidence demonstrating a belief in the hot hand by players and fans alike, the empirical evidence for the existence of the hot hand in (team) sports is limited. As a result, a number of psychologists have attributed the hot-hand belief to cognitive biases due to the “law of small numbers,” where individuals tend to detect patterns in (short) sequences of random outcomes, which they attribute to causal links between past and future performance, even when such links may not exist.
In basketball, studies have shown that neither field goals nor free throws reveal evidence for the hot hand. The results are actually suggestive of a negative effect on future outcomes after players have made their most recent attempts. In baseball, studies have shown that batting averages are equally likely to be high after “cold” and “hot” streaks, and that team wins are independent of prior results. Recently, Simcha Avugos and co-authors conducted a meta-analysis of 30 hot-hand studies in sports, finding only a small positive, but statistically insignificant (p-value = 0.49), hot-hand effect.
Despite more than a quarter century of the hot hand in sports as an active topic of research, there is no published study analyzing the hot hand in hockey. This oversight may be partially due to the fact that the use of statistics to evaluate players or teams in the NHL is relatively less common than in other sports, especially baseball. However, there are several motivating factors for using hockey as a subject for the study of the hot hand. The phenomenon is unexplored in hockey, which is the team sport with arguably the greatest cultural perception of streakiness in performance. Players’ ice time varies between (and within) games owing to recent goal-scoring performance, fights are strategically instigated to change “momentum” in a game, and it is cliché to attribute Stanley Cup championships to a goalie “catching fire.” Additionally, the psyche of hockey players may be unique in comparison to other sports. As retired NHL defenseman and sports reporter Jim McKenny put it, “Half the game is mental; the other half is being mental.” And perhaps most interesting from a statistical point of view, the NHL data allow for the assessment of shot selection and shot difficulty, which may be important confounding factors in the evaluation of the hot hand.
With these considerations in mind, the question is posed: Is there evidence for the hot hand in
the NHL?
NHL Play-by-Play Data
The NHL maintains play-by-play data for all games (see this memorable game for example). The play-by-play tracks every recorded event during an NHL game, including goals, shots on goal, missed shots, penalty shots, blocks, hits, penalties, face-offs, goals, stoppages, takeaways, and giveaways. For the purposes of this analysis, an attempt on goal is defined as a missed shot, shot on goal, or goal that originates in the offensive zone (the area within the blue line extending 64 feet from the goal line). The data for this study consists of every attempt on goal for every NHL game during the 2011–2012 NHL season.
In order to account for and eliminate potentially confounding game situations, such as penalty shots, power plays, 4-on-4 or 3-on-3 situations, and empty nets, only attempts on goal that occur at full strength with both goalies on the ice are considered. Whenever this article refers to an attempt, it is describing an attempt at goal in a full-strength, non-empty-net, regulation-time situation.
Overall, the data consists of 72,665 attempts on goal made by 912 different players against 89 different goalies resulting in 4,284 goals. For each attempt on goal, the player making the attempt is recorded in addition to the information given in Table 1.
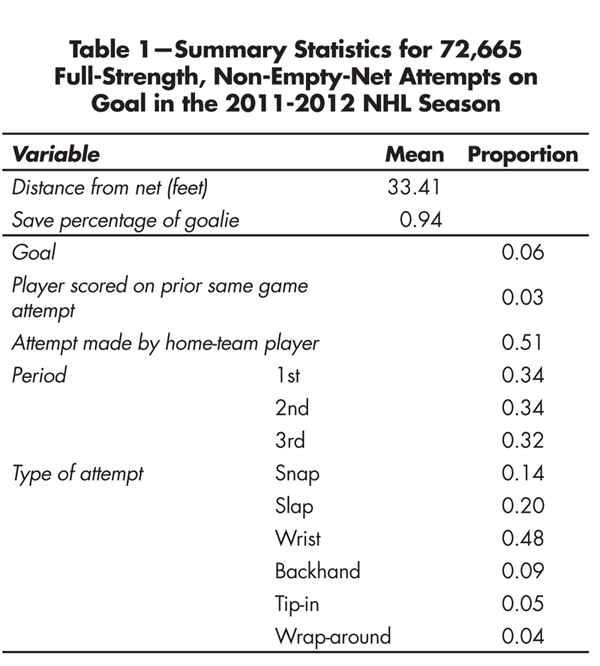
Table 1—Summary Statistics for 72,665 Full-Strength, Non-Empty-Net Attempts on Goal in the 2011-2012 NHL Season
As Table 1 indicates, 6% of attempts result in goals, with the home team generating significantly more attempts. On average, attempts are made from about halfway between the goal line and the blue line. There are fewer attempts in the third period than in the first or second periods. The most common type of attempt is the wrist shot, accounting for nearly half of all attempts. The tip-in and wrap-around are each attempted only about 5% of the time.
Of primary interest for this study is the indicator for whether the player’s prior attempt in the same game resulted in a goal. If the hot-hand phenomenon exists in the NHL, one would expect goals to occur more frequently following successful attempts than unsuccessful attempts. While 6% of attempts are goals, only 3% of attempts occur for which the player’s most recent same game attempt was a goal. This discrepancy is simply a reflection of the relative infrequency of attempts, averaging little more than one attempt per game per player. In many cases, players have no additional same-game attempts after scoring. Additionally, the later in the game a goal occurs, the less likely it is that the player will have a subsequent attempt.
Regression Model
In the academic literature, a number of different statistical procedures have been used to evaluate the existence of the hot hand. The statistical tests include conditional probabilities, serial correlation, logistic regression with an indicator of past success, Markov-switching models, goodness-of-fit for runs of success, and simulation approaches. Unfortunately, most of the more sophisticated methods are not appropriate for detecting the hot hand in hockey. Due to the low number of goals scored over the course of the season for most players, very few runs of goals on consecutive attempts or games are observed, and tests for serial correlations have low power. Moreover, the probability of success is small, and regime-switching models will struggle to detect changes in the probability of success. Because hockey is a dynamic sport with significant changes from game to game due to the opponent and strategic or personnel changes, it is more appropriate to evaluate the hot hand within games, rather than across games.
Let us take a fairly straightforward approach to analyzing the hot hand in hockey, using a regression approach to model the probability of goal scoring with indicator of past success as an explanatory variable. For observed attempts i = 1, … , 72665, let Yi = 1 if attempt i results in a goal, and Yi = 0 otherwise. Define HOTi = 1 if the player making attempt i scored a goal on his most recent attempt in the same game, and HOTi = 0 otherwise. If attempt i corresponds to a player’s first attempt in a game, HOTi = 0.
A simple measure of the hot hand in hockey would compare the probability of an attempt resulting in a goal conditional on the success or failure of the most recent prior attempt. Using conditional probabilities to evaluate the hot-hand belief is a common approach. These conditional probabilities are shown in Table 2 (these results are comparable to the regression model with an empty set of control variables). While the table indicates a slightly larger probability of success conditional on prior success, this relationship is not statistically significant.
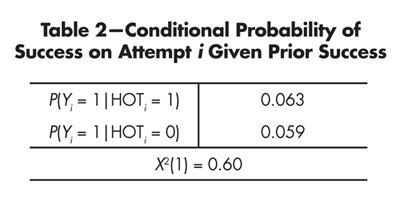
Table 2—Conditional Probability of Success on Attempt i Given Prior Success
The results in Table 2 are potentially very misleading because they fail to account for important characteristics associated with attempt i and the probability of scoring. Consider a simple example. In hockey, defensemen are much less likely to score than forwards. P(Yi = 1) is greater for forwards, and as a consequence P(HOTi = 1) is also greater for forwards. The position of the player is a confounding factor for evaluating the hot hand, and, if omitted, would tend to cause us to overestimate the hot-hand effect. To account for such confounding factors we consider the linear-probability model
Yi = β0 + β1HOTi + Controlsi + εi, (1)
where εi is a well-behaved error term and Controlsi is a set of characteristics associated with attempt i. The primary variable of interest is HOT. The probability of goal-scoring success changes by β1 for an attempt if the same player’s prior attempt in the same game was successful. Inference for the existence of the hot hand in the NHL can be made through inference on β1.
Note that the use of the linear probability model for a binary-response variable, such as goal scoring, violates the usual constant variance assumption of linear regression. As a result, the t-statistics from this model may not truly follow a t-distribution. In order to validate our results, a logistic regression with the same set of covariates was estimated on the data, and the test statistic on HOT (-3.78, not shown) was very similar to the linear regression test statistic (-4.06, shown in Table 3). The choice of a linear-probability model, as opposed to logistic regression, is inconsequential to our overall conclusions, and we choose to pre-sent the results in the context of the linear-probability model because it is more directly interpretable on the probability scale.
The set of control variables will always consist of player-fixed effects, which account for differences in position, player skill, shot selectivity, and other unobserved variables specific to the player making the attempt. We do not additionally include goalie-fixed effects because there are not enough observed instances of the same players making attempts on the same goalies while HOT to reliably estimate both player- and goalie-fixed effects. Because features of the goalie are important confounding factors, affecting both the probability of scoring and the likelihood of a player becoming HOT, we use the goalie’s season-long save percentage as a reflection of an individual goalie’s level of skill. Other control variables include a cubic function of distance from net at the point of attempt, indicators for type of attempt, period of play, and whether the attempting player is at home.
Icing the Hot Hand
Table 3 shows the estimated regression equation for the linear probability of a goal resulting from an attempt, controlling for the potentially confounding factors for HOT. Coefficient estimates and t-statistics are provided. There is statistically-significant evidence that a HOT attempt is associated with the probability of goal scoring, but surprisingly, the effect is negative. Attempts made by players who scored on their most recent attempt are estimated to be 2.0 percentage points less likely to score, accounting for the control variables in the model. Perhaps even more surprising, the estimated impact of HOT is quite large relative to the overall 6% success rate of attempts. This finding is in direct opposition to the hot-hand theory and our basic intuition; however, it is consistent with results presented by Gilovich, Vallone, and Tversky, who show that many basketball players were actually less likely to score on their next shot if they had scored on several previous shots, though the result for basketball players is not statistically significant.

Table 3—Linear-Probability Model for a Goal Resulting from an Attempt on Goal
Recall that the conditional probabilities showed a slight positive hot-hand effect in the raw data. Accounting for player-fixed effects and the other control variables, a more accurate description of the impact of HOT on goal scoring is revealed. In this model, the quality of goalie, distance, and type of shot significantly affect the probability of scoring, whereas the period of play and being at home do not.
How the Hot-Hand Perception Influences Shot Selection
There are several reasons why a negative hot-hand effect might be observed. It may simply be the case that the hot-hand effect is truly negative in hockey, although it is difficult to construct a reasonable narrative for why that would be true. The arguably more likely scenario is that there is some unobserved confounding variable that explains the negative estimate of β1 in our regression. Teams’ offensive and defensive strategies and personnel decisions may change in response to a goal, making further scoring by a particular player more difficult. It may also be the case that players respond to recent past success by becoming more willing to make attempts with a lower probability of success. This claim has recently been tested with NBA data by Bocskocsky, Ezekowitz, and Stein. The authors used player court-position tracking data to assess the difficulty of shot attempts by players who have had recent shooting success. They found that “hot” NBA players were willing to attempt more difficult shots, and that the quality of shot helped explain the negative hot-hand effect originally observed by Gilovich, Vallone, and Tversky.
We will take a similar approach, and the NHL play-by-play data also provide an opportunity to test the hypothesis that players are less selective in making attempts immediately following successful attempts. Consider a two-stage approach. First, we can summarize the quality of an attempt as a function of the distance from goal and the type of attempt using a linear-probability model. Fitted values from this model for each attempt serve as an indication of the quality of the attempt. In the second stage, we can estimate the effect of HOT on the shot quality (as determined in the first stage) using a linear regression with appropriate control variables.
Table 4 shows the results for the first stage of this procedure, a linear-probability model for goal scoring. This regression equation intentionally excludes game-specific characteristics of attempts (e.g. goalie save percentage) because it is intended to measure the quality of an attempt, not elements of difficulty associated with a particular game. For example, a slap shot from 20 feet is assumed to be of equal quality whether the goalie is excellent or poor, but the probability of success is much lower if the goalie is excellent. Accordingly, goalie save percentage is excluded from this regression. We include player-fixed effects to account for player-specific skill; certain players may be more or less likely to score on attempts.
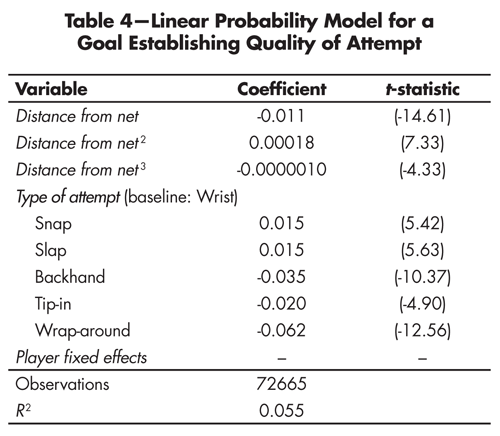
Table 4—Linear Probability Model for a Goal Establishing Quality of Attempt
The quality of each attempt is defined to be equal to the fitted probability of success based on the regression equation in Table 4. Having estimated the quality of attempts, we fit a linear regression of shot quality on HOT, player-fixed effects, and other game-specific control variables. Table 5 shows the estimated regression equation. HOT is a statistically significant predictor for quality of attempt. With a negative coefficient estimate, we conclude that attempts are of lower quality for players having scored on their previous attempt. This result confirms our expectation that players respond to past success by being less selective in making future attempts.
Table 5 also shows that the quality of attempts is lower in the first period than in either the second or third, quality of attempts is lower against more effective goaltending, and the home team is able to generate higher quality attempts.
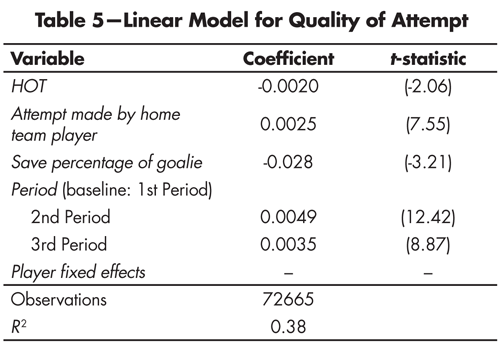
Table 5—Linear Model for Quality of Attempt
There is convincing evidence that players demonstrate an empirical willingness to take lower-quality attempts immediately following goal-scoring attempts. This result alone does not explain the significantly negative hot-hand finding in Table 3, because equation (1) already accounts for the elements of quality incorporated in Table 4. Either there truly is a negative hot-hand effect, or other unobserved characteristics of shot quality explain why the negative hot-hand effect persists even accounting for these variables. Such characteristics could include the angle from the goal to the point of attempt, on-ice personnel for both teams, strategy changes, or defensive positioning at the time of attempt. At a minimum, the results indicate that players are making lower-quality attempts after successful attempts, based on the distance from goal and type of attempt. The attempts may also be more difficult in terms of their unobserved characteristics, not only obscuring potentially positive hot-hand effects but resulting in a significantly negative estimate for the hot-hand effect in equation (1).
Gilovich, Vallone, and Tversky surveyed eight NBA players and found that the players themselves tended to believe in the hot hand. Without conducting a survey of NHL players, this study provides evidence, via revealed preferences from in-game decisions, for an inherent player belief in the hot hand. Players make more difficult attempts following goals, and are less likely to score on those attempts. From the perspective of on-ice strategy, this type of shot selection would be expected to negatively affect player and team performance.
Concluding Remarks
This study provides the first evaluation of the hot hand in professional hockey. In our sample of attempts on goal from the 2011–2012 NHL season, we find statistically significant, negative hot-hand effects. That is, players are less likely to score on attempts immediately following a successful attempt. After scoring goals, players become less selective in choosing to attempt shots on goal. Presumably this willingness to make lower-quality shot attempts is in response to the player’s or team’s inherent belief in the hot hand. Even accounting for observable factors of shot quality, players still exhibit negative hot-hand effects. We believe that the most likely explanation for this result is unobserved characteristics of quality of attempts following goals, but we cannot conclusively rule out a negative hot-hand effect in the NHL.
We discussed several reasons for our choice of statistical procedure. Further exploration of the hot hand in hockey could examine individual player streaks, goal-scoring runs, or serial correlations across shots and games. We conducted a brief analysis of serial correlations of a player’s attempts for all individual players who scored at least 10 full-strength, non-empty net goals during the season. We identified just seven players (approximately 5% of the selected sample) with statistically-significant serial correlations: Patrice Bergeron, Matt Cooke, Erik Karlsson, Ryan Malone, Zach Parise, Mike Ribeiro, and Martin St. Louis. For each player, the serial correlation was positive, consistent with a hot-hand belief. However, because only 5% of the sample was statistically significant, these results may simply be due to Type I error.
There are a few important limitations to the study. Specialty situations (power play, 4-on-4, 3-on-3, empty net) differ substantially from even-strength situations in terms of likelihood of goal scoring and on-ice strategy. We made the decision to eliminate specialty situations from consideration in our analysis. A major implication of this choice is that a player could score a goal on a power play and his next shot would not be considered HOT; likewise, a player could score a goal and if his next shot is on the power play it would not appear in our data set. This decision could limit the impact of the hot hand if scoring goals in specialty situations has the same physiological or psychological impact as scoring goals in non-specialty situations. This limitation is somewhat magnified by the fact that a substantial proportion of goals are scored in specialty situations. In other sports there is rarely an analogous in-game situation where teams play with an unequal number of players. For the sake of comparison, discarding specialty situations in the hockey analysis is a sensible choice. More important, with the data available to us, it would be difficult to control for additional confounding factors due to specialty situations.
Hockey is an extremely dynamic sport. It is a team sport, the pace of play is fast, play is continuous, stoppages in play are relatively rare, and 12 players are on the ice at most times. As a result, hockey is an extremely difficult game to summarize with play-by-play data. Because the data we have available to us is a discretization, with a relatively small number of recorded variables, it is not at all a complete representation of the game. The analysis we have conducted is limited by the data that is available. Baseball is revolutionizing data in sports by collecting positioning data for all players through its Field F/X system, and the NBA is also beginning to collect second-by-second player positioning data. The value of a similar system in hockey is obvious. Presumably there are important unobserved characteristics of attempts that reflect difficulty of attempts. A richer data set could help identify such characteristics, and help further evaluate the hot hand in hockey.
Further Reading
Albright, S. 1993. A statistical analysis of hitting streaks in baseball. Journal of the American Statistical Association 88:1175–1183.
Avugos, S., Köppen, J., Czienskowski, U., Raab, M., & Bar-Eli, M. (2012). The ‘hot hand’ reconsidered: A meta-analytic approach. Psychology of Sport and Exercise, 14(1):21-27. doi: 10.1016/j.psychsport.2012.07.005
Bar-Eli, M., S. Avugos, and M. Raab. 2006. Twenty years of ‘hot hand’ research: Review and critique. Psychology of Sport and Exercise 7:525–553.
Bocskocsky, A., J. Ezekowitz, and C. Stein. 2014. The hot hand: A new approach to an old ‘fallacy.’ MIT Sloan Sports Analytics Conference.
Gilovich, T., R. Vallone, and A. Tversky. 1985. The hot hand in basketball: On the misperception of random sequences. Cognitive Psychology 17:295–314.
Larkey, P., R. Smith, and J. Kadane. 1989. It’s okay to believe in the ‘hot hand.’ CHANCE 2:22–30.
Tversky, A. and T. Gilovich. 1989. The cold facts about the ‘hot hand’ in basketball (PDF download). CHANCE 2:16–21.
Tversky, A. and D. Kahneman. 1974. Judgment under uncertainty: Heuristics and biases. Science 185:1124–1131.
About the Author
Andrew Vesper is a specialist at Deloitte Consulting LLP within the Advanced Analytics & Modeling practice. He joined Deloitte in 2013 after earning his PhD from the Harvard University department of statistics. Areas of interest include sports statistics and applied statistics for business analytics and data science.
Dr. Vesper,
My name is Gordon Driscoll and I am a sophomore at Dartmouth College. I came upon this article while assisting research for a new sports statistics class offered at Dartmouth.
Both the sports statistics professor and I have agreed that papers like yours would be an ideal fit for this new class. Students would read your paper, analyze the methods used, and attempt to replicate your findings using the original datasets. I am e-mailing you to ask if you could send me your original data for this text.
If you have any questions about the class or for what the data will be used, don’t hesitate to e-mail me.
Thanks,
Gordon Driscoll