
Optimism and the Occult Octopus: Favorites Lose, Underdogs Triumph, and Spain Finally Wins the World Cup
“It doesn’t hurt to be optimistic. You can always cry later.” ~ Lucimar Santos de Lima

Spain took home the 2010 FIFA World Cup after defeating the Dutch in the final. Germany came third, and the English turned in a perfect performance. The English Octopus, that is. In a topsy-turvy month of competition in South Africa in the middle of 2010, when footballing giants were sent packing early, unheralded minnows outperformed expectations and the top-ranked team on the planet finally assumed the mantle of a first-time world champion. A cephalopod [Greek plural Κεφαλόποδα (kephalópoda); “head-feet”] named Paul emerged as the unlikely star of the tournament.
The Oracle Octopus had an unblemished track record during the championship, correctly predicting the outcomes for all of Germany’s seven games, plus that of the final between the Netherlands and Spain—a flawless performance that must have been the envy of pundits, punters, bookmakers, and the England football team alike.
Mollusk mania grew to astounding proportions in the wake of the World Cup and generated the kind of passion normally reserved for the sport itself. While some German fans—outraged by the Omniscient Octopus’ ominous omen of the Deutschland’s defeat in the semifinals—posted disturbing death threats in the form of recipes for a calamari cook-out, others showered the psychic cephalopod with an array of accolades, culminating in his own web page on Wikipedia and an invitation to preside as the marquee mollusk at the annual Spanish Octopus Festival in Galicia. The Madrid Zoo even made an audacious attempt to acquire Paul the Octopus (a.k.a. el Pulpo Pablo to his Iberian intimates) in the transfer market, but his then-club, the Oberhausen Sea Life Center, responded with an emphatic nein to the offer for its tentacled talisman. Paul, who had emigrated from Weymouth, England, at an early age, was subsequently accorded the role of an official “ambassador” to England’s 2018 FIFA World Cup bid, prior to his death in October 2010.
Amid the hoopla surrounding Precise Paul’s prescient prognostications, teuthology—or the study of cephalopods—became almost de rigueur. What is the typical track record in sports predictions? How did Paul’s predictions pan out so perfectly? Do octopi actually possess psychic powers? Or was it just sheer luck on the part of the Celebrity Cephalopod?
As the excitement grows to a fever pitch leading up to the 2014 FIFA World Cup in Brazil, we seek to understand the secrets of the Successful Cephalopod in correctly picking the winner every time during the 2010 tournament. Specifically, we examine how mere human mortals stacked up against the Oracle of Oberhausen in their predictions of match outcomes during the 2010 World Cup and likely reasons for any observed differences. In doing so, we contemplate possible behavioral biases driving the selections of armchair pundits that may not have been a factor in the exhilarating exploits of the Magnificent Mollusk. Based on our findings, we propose adjustments to the manner in which match winners are selected to improve prediction accuracy for the forthcoming competition.
The literature on both sports prediction and betting markets is relevant for the analysis in this paper. The first area focuses on non-betting market predictions. It shows the existence of calibration errors, namely that the assessed probability relative to actual probability of winning is attributable to an over-perception or overconfidence in the ability of the favorite to win relative to that of the underdog. The second area of betting markets also emphasizes the identification of the favorite versus the underdog, but through the implication for profitable betting strategies. The latter literature covers the returns or payoffs that can be generated from inefficiencies captured in the market itself; it considers a slightly different dimension to prediction decisions per se, in that there is the added consideration of whether the odds or returns in the betting market efficiently incorporate any behavioral patterns that exist.
The distinction between the two areas of literature is useful. It is especially relevant where a formal betting market is not used or is not available, such as for sports betting pools, individual off-market bets, or sports prediction games. In these situations, the market odds are irrelevant for determining payoffs. For example, where the payoff for predicting the outcome of sporting events is influenced by the entrants in a pool (for pool bets), then not only does over-perception of the favorite occur, but the payoff is further skewed by the type of reward structure specific to the pool (e.g., winner takes all). The empirical evidence suggests that for simple prediction accuracy, betting market predictions are only marginally superior to alternative simple prediction mechanisms and expert polls, where no market exists to correct any prediction bias.
In light of the existing evidence, we focus our analysis on outcomes from the favorite versus underdog phenomenon and the reasons behind those results. Based on consensus prediction data from more than a half million participants from the Yahoo! Fantasy World Cup Football 2010 Prediction Game for the 2010 FIFA World Cup tournament (hereafter “Yahoo! Game”), previously available at http://uk.wc.fantasysports.Yahoo!.com/world-cup, our findings suggest the following:
- (i) The consensus predictions of Yahoo! Game participants were quite accurate statistically, but were nowhere near as prescient as Paul’s was.
- (ii) One-sided consensus predictions of wins/losses for particular teams were most accurate; the accuracy rate declined when the confidence of the collective in a particular outcome was more evenly split.
- (iii) Any bias in confidence appeared to be reflected in collective optimism/pessimism in the ability of the designated favorites/underdogs, that is, in expectation of the number of goals that teams would score relative to actual goals scored. More specifically, collective optimism was largely manifest in the incorrect predictions that either the favorites or the underdogs would win their matches.
- (iv) For matches where Yahoo! Game participants were more evenly divided on which team would win, selecting the perceived “underdog” just before the commencement of a match (as this information was readily available in real time) according to a conceived “spread rule” would have resulted in an increased prediction accuracy rate with a probabilistic accuracy level surpassing even that of Octopus Paul’s.
Data: Paul and the Pundits
Football aficionados typically fancy themselves to be experts on the sport, either overtly or covertly. This was evident during the 2010 FIFA World Cup, where an estimated 570,000 participants entered the Yahoo! Game. Entry into the competition was free and open to international participation; entrants were required to select the outcome of each match through the group qualifying and the knockout rounds of the tournament. The Yahoo! Game essentially pooled a cross-section of “informed” opinions on each team and match throughout the month-long competition. As a result, it provided an interesting window on how armchair pundits collectively assessed the capabilities of individual country teams vis-à-vis their slated opponents.
The basic rules of the Yahoo! Game were relatively straightforward and transparent. They required that:
- For the group-qualifying matches, a selection is made from the three possible outcomes: Team A to win, Team B to win, or a draw.
- For the knockout rounds, a selection be made from only two possible outcomes—Team A to win or Team B to win—irrespective of how the win was achieved (i.e., whether in normal-time, extra-time, or in a penalty shoot-out).
Additionally, participants could choose to forecast the number of goals each team would score in each match. Hence, for the 64 games in the competition, a distribution of the number of expected goals scored by each team would result. With two teams playing one another in each match, each participant in the Yahoo! Game would offer 128 predictions on goals scored, giving 128 distributions in total.
All predictions had to be submitted before each match commenced, and the aggregate prediction data were posted on a real time basis. The captured data would show the following breakdown for the each of the group qualification rounds (Figure 1):

Figure 1. World Cup group stages: The distribution of match outcome predictions on Yahoo! Eurosport Fantasy Sports World Football 2010
- Percentages of predictions for Team A to win, Team B to win, or a draw
- The distributions of the expected number of goals scored by each team (with the most popular predictions in bold)
- The final match result, as well as the actual number of goals scored by each team (highlighted by the shaded boxes) at the end of the game
In the group qualifying stages, matches could either end in a win for either team or a draw. Using the examples from a couple of the Group Round 1 games, the presented data can be interpreted as follows:
- In the match between England and the United States (Figure 1, left panel), 61% of pundits playing the Yahoo! Game predicted an England win; 46% expected England to score a brace of goals, while 47% thought that the U.S. team would at least acquit itself honorably and score one goal. The actual outcome was a one-all draw.
In the match between Germany and Serbia (Figure 1, right panel), Germany was the prohibitive favorite, with 92% expecting a win for the former champions, and only 2% (including Paul) calling for a shock win by the underdogs. A draw was assigned a probability of 6%. Separately, the most popular score line for the anticipated German win was 2–0. Serbia eventually, and unexpectedly, won by a goal to nil.
In the knockout stage games, all matches had to produce a winner, through penalty shoot-outs if necessary. Thus, draws were not an option at this point in the proceedings (Figure 2). Using a semifinal and the third-place matches as examples, the outcomes can be described as follows:

Figure 2. World Cup knock-out stages: The distribution of match outcome predictions on Yahoo! Eurosport Fantasy Sports World Football 2010
- In the Germany-Spain semifinal match, Germany was given a 69% chance of winning; it was largely expected to score two goals, against one for Spain. However, Spain squeaked past by scoring the only goal of the match.
- In the playoff for third place, Germany was heavily favored by 81% of punters; it was expected to beat Uruguay, again by two goals to one. Germany eventually scored three goals to Uruguay’s two.
The rich dataset from the Yahoo! Game allows us to estimate the accuracy of consensus human predictions during this past World Cup vis-à-vis those of the Awesome Octopus. We would also be able to reasonably determine the collective biases—if any—to which human punters may be susceptible, in predicting the outcomes of those football matches. The Yahoo! Game offers incentives to achieve high forecast accuracy through its design of the point scoring system (see sidebar).
Analysis: Statistics and Cephalopods
Everyone wants to be like Paul. The Magic Mollusk achieved eight correct predictions from the eight World Cup matches to which he was assigned. This achievement is quite staggering, statistically. There were a total of 64 matches played during the World Cup, of which 48 were group matches and 16 were knockout round matches. Given that a draw is possible in the group stages the number of possible outcomes is 144 for the group stages, 32 for the knockout rounds and 176 overall. The base chance of getting the outcome right for each group match is ⅓ and for each knockout match is ½ which, in Paul’s case, over the course of three group matches and five knockout matches, the correct prediction of eight out of eight would translate to a probabilistic accuracy of 0.0013, which is based on an exact binomial calculation of achieving eight out of eight successful predictions relative to the appropriate base probability of random chance.
It is important to evaluate the strategy based on the performance or probability of achieving the result relative to the sample size, and not be influenced by the law of small numbers. Focusing on prediction accuracy alone does not take into account the number of events in the sample, and hence the probabilistic assessment of the number of correct predictions. Incorrectly focusing on the result alone (e.g., eight for eight) is a common heuristic, resulting in bias in decisionmaking and fails to take into account the base probability of success which is a factor of the sample size. Paul’s career prediction rate when combining his European Cup and World Cup games is equally impressive. The total career 12 out of 14 (86%) successful predictions is also statistically significant, with again a probability level of achieving 12 or better correct predictions out of 14 trials, close to 0.0013.
This section quantifies and qualifies the aggregate prediction performance of human punters by addressing the following questions:
- How did they perform?
- What collective behavioral biases, if any, did they exhibit?
- How did those biases manifest?
Predictions and Paul
The outcomes of Yahoo! Game consensus predictions clearly could not hold a candle to Paul, although it still performed very well statistically. The Yahoo! consensus predictions were significantly better than random chance for the relevant games, with an accuracy rate of 52% (33 out of 64) for the tournament. This translates to a probabilistic accuracy of 0.0141 (see Table 1, Panel A) (i.e., the probability of doing as well as or better than the observed 33 correct predictions out of 64). Those consensus predictions, as well as Paul’s performance, can be put in perspective by comparing them against some benchmark strategies (Table 1):

Table 1—2010 FIFA World Cup: Outcomes of Match Prediction Models
Note: z-stats (and their associated p-values) are calculated using the normal distribution approximation to the binomial distribution and incorporating a continuity adjustment factor. Exact results using the binomial distribution are very close (p-value within 0.001) to the results presented. For the “All Games” results, the z-stats (and their associated p-values) apply a sample weighted average mean and variance to compute expected probability and standard deviation. As a robustness check, the p-values are simulated numerically using Monte Carlo methods and are within 0.005 of the reported results.
- The “coin toss” or random chance model, which is the model against which the others are assessed and probabilities of predictions determined, assumes that 48 out of 64 matches would have a one-third chance of being correct while the remaining 16 would have a half chance of being right. In other words, an overall prediction accuracy rate of (48/64 × ⅓) + (16/64 × ½) = 37.5% is expected (or equivalent to 24 games out of 64), with a probabilistic accuracy of 0.5000 (see Table 1, Panel B).
- The naive model in Table 1 Panel C simply selects the first team listed (i.e., the “home” team, regardless of the match-up). When applied, it results in a prediction accuracy rate of 41% (26 out of 64), translating to a probabilistic accuracy of 0.3493, which is slightly better than the random chance model.
- The FIFA/Coca-Cola World Rankings model designates the higher-ranked team the winner, except where teams were within five ranking positions of each other, in which case for the group games the match would be considered too close to call and therefore assigned a draw. The rankings, released in May 2010, just before the World Cup, are used. This approach as noted in Table 1, Panel D, would have resulted in a 56% accuracy rate (36 out of 64), with a probabilistic accuracy of 0.0015. As a benchmark, a prediction accuracy rate of 37 or better out of 64 would give almost the same statistical probability relative to chance as that of Paul’s—it is more difficult to consistently select the correct outcome over 64 repeated trials, compared with the eight games Paul picked.
In hindsight, the Yahoo! consensus predictions were accurate more than half the time (33 correct out of 64 games and a probabilistic accuracy of 0.0141). The participants collectively out-predicted the random chance (24 correct out of 64 games, with a probability of 0.5000) and naïve models (26 correct, with a probabilistic accuracy of 0.3493), but were less successful than the Coca-Cola/FIFA World Rankings model (36 out of 64 correct, with a probabilistic accuracy of 0.0015).
The probabilistic accuracy of the Yahoo! Game consensus predictions was possibly influenced by the number of potential outcomes of the decision. The prediction accuracy rate or the knockout games (75%) was significantly higher than that for the three group rounds, (44%) notwithstanding the smaller sample size of the former (Table 1). This is likely due to the number of possible outcomes (three) for the group matches being greater than for the knockout rounds (two), although this should not matter statistically. In the 2010 World Cup, however, outcomes of group matches proved particularly difficult to pick as upsets abounded throughout the group stages.
Confidence and the Calamari
The degree of “confidence” exhibited in the consensus selection of a particular outcome was captured by the proportion of Yahoo! Game participants who made the selection. Given that it is not possible to directly measure the underlying confidence of individual Yahoo! Game participants in the predicted outcome, we assume that the greater/smaller the proportion of participants selecting a particular outcome, the more/less collective confidence there was in that result. To the extent that the Yahoo! Game participants collectively exhibited a systematic tendency to ascribe particular outcomes to matches and were regularly right or wrong in their predictions, this would suggest a general bias in the predictions. In all, there were a possible (48 games × 3 outcomes) + (16 games × 2 outcomes) = 176 outcomes for the tournament. The following steps are employed in our calculations to determine bias:
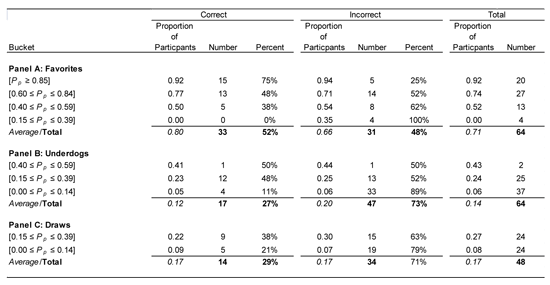
Table 2—2010 FIFA World Cup: Proportion of Participants and Prediction Accuracy of Consensus Selection; Split by Team (Favorite and Underdog)
Note: This table provides the proportion of participants and the prediction accuracy (correct or not correct) of the selected outcome of the Yahoo! consensus selection. The data is provided for the total number and split between whether the selection was either correct or incorrect. Each of the buckets noted is selected so that at least 10% of total observations will be in each and that a reasonable level of observations is spread across each of the buckets. Alternative cut-off points for the various buckets produced results that are consistent with the results presented above.
- The predictions are grouped in “buckets” according to the proportion of Yahoo! Game participants selecting a team to win or draw each match, which we define as Pp . The bucket intervals are determined such that each captures at least 10% of the consensus predictions (Table 2).
- A “favorite” team is defined as that which has the highest proportion of votes for any one match. As an example, Germany was predicted to beat Serbia by 92% of Yahoo! Game participants during the group stages, so this prediction is assigned to the [Pp ≥ 0.85] bucket for favorites (Panel A). Conversely, 2% of participants picked Serbia to win and 6% thought the match would end in a deadlock, each of which is assigned to the [0.00 ≤ Pp ≤ 0.14] bucket for underdogs (Panel B) and for draws (Panel C), respectively. The actual outcome was a massive upset win for Serbia.
- A very high proportion of participants (92%) (i.e., those in the [Pp ≥ 0.85] bucket) predicted wins for particular teams over the course of the competition (Panel A). Those predictions actually materialized 75% of the time, with 92% of participants getting them right.
- The accuracy rate fell to about half when only about three-quarters of participants (i.e., the [0.60 ≤ Pp ≤ 0.84] bucket) picked a particular favorite. Similarly, when the proportion of participants falling into the [0.40 ≤ Pp ≤ 0.59] and [0.15 ≤ Pp ≤ 0.39] buckets showed a preference for the underdog, they too got it right about half the time, on average. The 6% of total participants falling in the [0 ≤ Pp ≤ 0.14] bucket who chose the underdogs to win were incorrect almost 90% of the time.
- Draws were only successfully predicted around 30% of the time no matter the proportion of participants selecting that outcome (Panel C).
These preliminary trends suggest there may be some behavioral biases driving the choices of the Yahoo! Game consensus predictions. There also may be some useful information in predictions derived from the weight (proportion) of participants advocating a particular outcome. The next section attempts to quantify those biases.
Optimism and the Octopus
So what could be a key driver of the inaccuracies in the predictions? We posit that a more detailed assessment of the distribution of the number of goals predicted for each match could shed light on the incorrect predictions of match outcomes.
First, there is clearly a difference in the expected number of the goals by the consensus (GE) relative to the actual goals scored (GA). Here, we define the expected number of goals for a match as the weighted sum of the proportion of participants’ predictions. Using the Germany-Serbia example in Figure 1 and assuming the 3+ goals category equates to three goals as a lower bound, then GE for Serbia is (0*0.56) + (1*0.37) + (2*0.06) + (3*0.01) = 0.52. Our analysis first considers the mean and variability in the number of goals scored (Table 3, Panel A):

Table 3—2010 FIFA World Cup: Estimating Optimism Bias
Notes: Panel A distribution statistics: Provides the distribution of expected (GE) and actual (GA) number of goals. The statistics are calculated for each prediction (or for all teams) and for each match-up (or game). There are 128 predictions for all teams and 64 games. For each match-up, differences in expected/actual goals for favorites versus underdogs are calculated, reflecting the expected winning margin or goal spread.
Panel B forecast accuracy: Contains statistics on pure forecast accuracy (MAD and MSE) of the expected (GE) relative to actual (GA) number of goals. The mean absolute deviation (MAD) is measured as µ|GE − GA| and the mean squared error (MSE) is measured as µ(GE – GA)2.
Panel C actual forecast error (AFE): The AFE or (GE− GA) and then MAFE or µ(GE – GA) preserves the direction or sign of the error and hence captures the directional bias inherent across all the forecasts.
Panel B Spread Prediction Rule: Provides the accuracy of a spread prediction rule in terms of whether the selected favorite was either correct or incorrect. The (Sp) prediction rule continues to selects the favorite based on the criteria of Sp greater than or equal to 0.60, a draw if Sp is less than 0.60 and greater than or equal to 0.50 or the underdog, otherwise (Sp < 0.50). This helps alleviate and control for the incorrect predictions in the Yahoo! Consensus forecasts for the specific area of the distribution where the accuracy in picking the favorites was considered poor [0.41≤ Pp ≤ 0.60]. Generally, incorrect predictions are evident from the increased uncertainty surrounding games where the match-ups were more finely balanced, as reflected in the narrow differences in the assessed probabilities of either team winning.
- When measured across all teams, the average number of goals actually scored of 1.13 is 0.19 fewer than the weighted average number of expected goals of 1.32.
- On a match-up, or per game, as opposed an individual team basis, the competition was actually much tighter—matches produced an average actual goal difference between the perceived favorite and underdog (GAF – GAU) of only 0.45, which can be contrasted to the average expected goal difference between the two teams (GEF – GEU) of 1.07 on a match-up basis. Thus, the difference between the expected and actual goal spreads is 0.62 (i.e., the difference between 1.07 and 0.45).
- The variation in the outcome is much greater for the actual (1.16) relative to the consensus expected (0.67) number of goals scored. Hence, differences in distributions between actual and expected goals for individual teams, as well as games being much tighter than expected on a match-up basis, raise questions about the forecast accuracy and biases in the predicted goal distributions.
Next, we examine the consensus predictions, or forecast accuracy (FA), of expected relative to actual goals. Forecast accuracy may be calculated in two ways (Table 3, Panel B):
- First, we calculate the mean difference between the expected (predicted) number of goals less the actual number scored (i.e., the mean absolute difference (MAD)). The overall MAD in this case is 0.89; the MAD is greater for match favorites (1.04) relative to the underdogs (0.74).
- The second approach is the mean squared error (MSE) or the square of the forecast error. The MSE shows the same pattern. The overall MSE is 1.29 and again the MSE is greater for the favorites (1.76) than for the underdogs (0.83). The MSE places greater weight on the extreme observations than the MAD, revealing that the favorites were sometimes the subject of wildly inaccurate/optimistic consensus predictions.
We subsequently consider the directional bias of a particular prediction by calculating the actual forecast error (AFE), defined as the expected (predicted) less actual number of goals scored, GE – GA (Table 3, Panel C):
- Across all team predictions, the evidence reveals a general preponderance to overt positivism of 0.19 in expectations.
- Clear directional bias exists with Yahoo! Game consensus predictions tending to be very optimistic about the number of goals that would be scored in each match, typically by the favored team (0.50 goals expected above actual), while being pessimistic about the performance of the underdog (0.12 goals expected below actual).
- The total match-up AFE (MAFE) of [(+.50) – (-0.12) =] +0.62 is consistent with the difference in the individual goal spreads between expected and actual. Thus, the consensus bias is accentuated on a match-up basis (i.e., +0.62 as opposed to +0.19 on a team-by-team basis).
Thus, optimism in the overall consensus predictions on goals appears to be linked to the inaccuracies in the Yahoo! Game consensus predictions of match outcomes. In other words, the differences in the outcomes, between the overall expectation that designated match favorites would be victorious and the eventual actual results, appear to be related to over-optimism in the ability of the favorites to score and a lack of belief in the underdogs’ ability to put the ball in the back of the net.
A more granular examination of the data shows that the prediction inaccuracies were largely driven by over-optimism in the expected number of goals that the projected victors would score. When the average actual and expected numbers of goals scored are grouped by the proportion of Yahoo! Game participants making those predictions, according to the same buckets as in the previous section, and by whether the favorite or underdog was selected, a clear pattern emerges (Table 4):
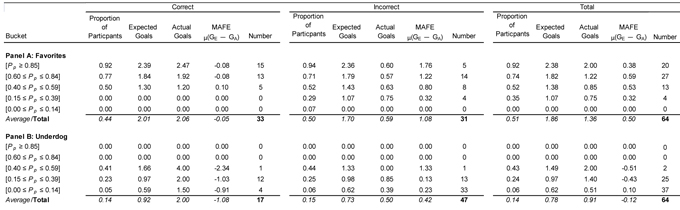
Table 4—2010 FIFA World Cup: Examining Optimism Bias by Prediction Accuracy and Team
Note: This table provides the proportion of Yahoo! Game participants, the expected and actual goals, and the MAFE (mean actual forecast error) split by the prediction accuracy (correct or not correct) of the selected outcome for the Yahoo! consensus selection. The data are provided for the total and split between whether the selection was either correct or incorrect. Again, each of the buckets noted is selected so at least 10% of observations will be in each and that a reasonable level of observations is spread across each of the buckets. Alternative cut-off points for the various buckets produced results that are consistent with the results presented above.
- Incorrect predictions of match outcomes for either the favorites (MAFE of 1.08) or underdogs (MAFE of 0.42) to win are typically reflected in the collective optimism in the number of goals scored.
- Correct predictions of favorites winning are matched by relatively accurate projections of goals scored (MAFE is -0.05 in Table 4, Panel A).
- Correct predictions of underdogs winning are usually accompanied by substantial under-estimates of goals scored (MAFE is -1.08 in Table 4, Panel B).
Extensions: Matching the Magic of the Mystical Mollusk
Ultimately, the key question is whether the behavioral biases underlying the consensus predictions actually affect the ability to correctly select the outcome of each match. If so, then adjusting for such biases could potentially improve predictive ability to rival Paul’s. To summarize, our findings thus far are that: (i) the Yahoo! Game consensus predictions are relatively accurate but could be improved in order to match Paul’s performance; (ii) lop-sided consensus predictions of wins/losses for particular teams show a high accuracy rate, which declines along with the confidence of the collective in a particular outcome; (iii) on average, Yahoo! Game participants as a group appear to have been perhaps overly-optimistic in the ability of match favorites to score and under-optimistic in the underdogs; and (iv) at a more granular level, the over-optimism actually applies to incorrect predictions of either favorites or underdogs winning their matches.
We now use the above findings to develop a “rule” for improving the accuracy of match predictions by applying the following steps:
- We first define Sp as the difference in the proportions of Yahoo! Game participants choosing a particular winner versus the loser for each match on a match-up basis (i.e., the “spread”).
- The individual match spreads are subsequently assigned to 20-percentile buckets in order to capture at least 10% of observations in each bucket and ensure a sufficient and reasonable number of observations in each bucket.
- The accuracy of the prediction (correct or incorrect) related to each individual spread/match is classified in and summed across each designated bucket.
The results highlight the prediction accuracy across the spread distribution (Table 5, Panel A). For large spreads—where there is a large proportion selecting one team to win and a very small proportion selecting its opposition to win—the prediction accuracy is very high (Sp ≥ 0.81 has a 74% accuracy). However, prediction accuracy deteriorates as the spread narrows (0.00 ≤ Sp ≤ 0.20 has only 29% accuracy), suggesting the following:

Table 5—2010 FIFA World Cup: Prediction Accuracy Using Spread Prediction Rule
Notes: Panel A Yahoo! Game Consensus: Provides the Yahoo! Consensus forecasts prediction accuracy in terms of whether the selected favorite was either correct or incorrect. The prediction accuracy is decomposed by number of participants making the selection of the win of the favorites (Pp) relative to the underdogs (Pp), or the spread (Sp). The spreads are grouped into various buckets using a similar criteria as before where at least 10% of overall observations should be in each bucket and there is approximately an even spread across the buckets.
Panel B Spread Prediction Rule: Provides the accuracy of a spread prediction rule in terms of whether the selected favorite was either correct or incorrect. The (Sp) prediction rule continues to selects the favorite based on the criteria of Sp greater than or equal to 0.60, a draw if Sp is less than 0.60 and greater than or equal to 0.50 or the underdog, otherwise (Sp < 0.50). This helps alleviate and control for the incorrect predictions in the Yahoo! Consensus forecasts for the specific area of the distribution where the accuracy in picking the favorites was considered poor [0.41≤ Pp ≤ 0.60]. Generally, incorrect predictions are evident from the increased uncertainty surrounding games where the match-ups were more finely balanced, as reflected in the narrow differences in the assessed probabilities of either team winning.
- The consensus prediction bias of overwhelming favorites does not detract significantly from successful prediction outcomes.
- Consensus prediction accuracy abruptly worsens around the [0.41 ≤ Sp ≤ 0.60] bucket, which is also where the most logical gains for decisionmaking could likely be made from “adjusting” for any collective behavioral bias.
- Consensus prediction accuracy is weaker for the smaller-spread buckets, which is not surprising as participants clearly feel that the teams are more evenly matched for those particular games. The selection of the winner in these instances is incorrect more than half the time.
We subsequently propose a rule for improving the selection of the winning team in the following manner: Select the observed consensus favorite where Sp ≥ 0.60 and the consensus underdog where Sp < 0.50. Select a draw when 0.50 ≤ Sp < 60. The results are not sensitive to the specification of the cut-off rate for the draw. Back-testing of this rule shows a marked improvement in the prediction accuracy for match-ups that fall into these buckets (Table 5, Panel B). The overall prediction accuracy goes up from the Yahoo! Game success rate of 33 out of 64 games (52% accuracy, with a probability of 1.41%) to 39 out of 64 games (61% accuracy, with a probability of 0.01%) which is an improvement on the Coca-Cola/FIFA Rankings model prediction accuracy rate of 36 out of 64 games (56% accuracy, with a probability of 0.15%) and even outstrips the likelihood of Octopus Paul’s performance (100% accuracy, with a probability of 0.13%.)
Concluding Remarks
The perfect performance of Paul the Octopus in successfully picking the winner in every match involving the German team plus the final during the 2010 FIFA World Cup spurred octo-mania as football fans collectively came up short against the Tentacled Titan. The collective success rate of the Yahoo! Game entrants was better than chance (52% accuracy) but not as high as that which would have been achieved using the simple technique of relying on the Coca-Cola/FIFA World Rankings (56%) or Paul’s perfect performance. However, Paul’s achievement on a probabilistic basis (0.0013) was better than what would have attained using the Coca-Cola/FIFA World Rankings information (0.0015) and that of the Yahoo! Game participants’ consensus predictions (0.0141).
We first consider the role of confidence and optimism exhibited by the Yahoo! Game participants as a group and discover some clear trends. The participants’ consensus selection of match winners tended to have a high accuracy rate where collective confidence was very one-sided towards the favorites. Accuracy declined when participants were more divided between teams. The selections could be explained by participants’ optimism in the ability of their chosen teams—irrespective of whether they are the favorites or underdogs—to score.
We propose a prediction rule on the basis of our findings on collective confidence and optimism evidenced by Yahoo! Game consensus predictions of the outcomes in the World Cup matches. In instances where the difference (“spread”) in the proportion of participants selecting the favorite relative to the underdog is less than 0.60 and greater than or equal to 0.50, we advocate going with a draw and selecting the perceived underdog in the case where the spread is below 0.50. This spread decision rule would have improved the prediction accuracy rate by 9% to 61%, with an attendant probability of 0.01%. This result would have surpassed even the achievements of Paul the Octopus.
Disclaimer: The views expressed herein are those of the authors and should not be attributed to the IMF or The World Bank, their executive boards, or their management.
Further Reading
Brailsford, T. J., S. Easton, P. K. Gray, and S. F. Gray. 1995. The efficiency of the Australian football betting market. Australian Journal of Management 20(2):167–196.
Clair, B., and D. Letscher. 2007. Optimal strategies for sports betting pools. Operations Research 55(6):1163–1177.
Gray, P. K., and S. F. Gray. 1997. Testing market efficiency: Evidence from the NFL sports betting market. Journal of Finance 52(4):1725–1737.
Goel, S., D. M. Reeves, D. J. Watts, and D. M. Pennock. 2010. Prediction without markets. Electronic Commerce 10(June 7-11):357–366.
Lichtenstein, S., and B. Fischhoff. 1997. Do those who know more also know more about how much they know? The calibration of probability judgments. Organizational Behaviour and Human Performance 20(2):159–183.
Lichtenstein, S., B. Fischhoff, and L. D. Phillips. 1977. Calibration of probabilities: The state of the art. In Decision making and change in human affairs, eds. H. Jungermann and G. deZeeuw, 275–324. Amsterdam: D. Reidel.
Murphy, A. H. 1995. The coefficients of correlation and determination as measures of performance in forecast verification. Weather Forecast 10(4):681–688.
Murphy, A. H. 1988. Skill scores based on the mean square error and their relationships to the correlation coefficient. Monthly Weather Review 116(12):2417–2424.
Oskamp, S. 1965. Overconfidence in case-study judgments. The Journal of Consulting Psychology 29(3):261–265.
Tversky, A., and D. Kahneman. 1971. The belief in the ‘law of small numbers.’ Psychological Bulletin 76(2):105–110.
About the Authors
Jason Mitchell is a financial officer and financial market data specialist in the controllers structured finance section at The World Bank. His responsibilities include implementing the control function and evaluating the organization’s borrowing and derivatives portfolios. Prior to joining The World Bank, Mitchell held academic positions in Australia, Hong Kong SAR, and the United States. He has a PhD in international finance and professional qualifications in both accounting and risk management.
Li Lian Ong is a deputy division chief in the monetary and capital markets department at the International Monetary Fund (IMF). She is involved in financial sector surveillance work relating to member countries. Ong has a PhD in international finance and undergraduate majors in accounting and finance.


