
Benford’s Law and County-Level Votes in US Presidential Elections

On December 2, 2020, a month after the US presidential election, President Donald Trump stated, “It is statistically impossible that the person, me, who led the charge, lost [the election].” In the election’s aftermath, Trump and many of his supporters argued that statistical irregularities in various vote totals proved election results in some states were illegitimate.
Many arguments in this vein were put forward; some were unserious and could be quickly dismissed, but others required mathematical effort to evaluate. An argument of the latter type is that Trump’s county-level votes in Pennsylvania follow Benford’s law, while the votes of his opponent, Joseph Biden, do not, and this provides evidence of voter fraud in Pennsylvania. This argument raises the question, “Can we apply Benford’s law to presidential county votes in order to detect electoral foul play?”
What Is Benford’s Law?
First, we must understand Benford’s law. Suppose we take a naturally occurring numeric data set such as the population of each of the 2,109 towns in Pennsylvania according to the 2010 census and consider the leading digit of each population. We might expect the leading digits are uniformly distributed, where approximately 1/9th of the town populations have a leading digit of i for each 1 ≤ i ≤ 9. However, the distribution of leading digits is not at all uniform. Instead, a population is much more likely to have a small leading digit than a large one: 30.7 percent of the populations have a leading digit of one, 18.5 percent a leading digit of two, and so on, with the percentages decreasing until the leading digit of nine occurs for only 4.4 percent of the populations.
Surprisingly, many real-life data sets (such as the number of employees at American companies or the total number of COVID cases by county in the US as of November 20, 2021) have distributions of leading digits that are similar to the Pennsylvania town population distribution.
Benford’s law formalizes this observation by stating that for some naturally occurring data sets, the probability that the leading digit is i is log (1 + 1/i). The population data from Pennsylvania towns matches these Benford probabilities pretty closely.
Many data sets do not follow Benford’s law. For example, exam scores in a large calculus section (where a possible score lives in the standard range of 0 to 100) will almost never follow this law, as few scores start with a one. This raises the question: What kind of data follows Benford’s law? Before analyzing a data set, is there a way to know if the data can be expected to follow a Benford distribution? There is no known complete list of necessary and sufficient conditions for a naturally occurring data set to follow Benford’s law; however, some necessary—or close to necessary—conditions are known.
For example, a (mostly) necessary condition for a naturally occurring data set to follow Benford’s law is that the numbers in the data set span several orders of magnitude. The smallest town in Pennsylvania had a population of 10 in 2010, while the largest had a population of 1,526,006, and thus the populations of towns in Pennsylvania span two to seven digits. Therefore, before we analyze the populations of Pennsylvania towns, we can reasonably expect this data will follow Benford’s law. Similarly, county votes for a major presidential candidate in each state usually span three to seven digits, and thus there is some a priori hope that such data will follow Benford’s law. For more general information about Benford’s law, including the types of data for which the law might apply, see Benford’s Law: Theory and Applications by Stephen Miller.
In the aftermath of the 2020 presidential election, the most prominent argument for electoral fraud that involved Benford’s law stated Biden’s precinct-level vote totals in cities like Chicago and Philadelphia did not follow Benford’s law (while Trump’s did). As many others have pointed out previously, this argument fails immediately because, among other issues, precinct-level votes generally do not span multiple orders of magnitude. If we consider Biden’s precinct-level vote totals for a particular city, the majority of that data consists of three-digit numbers. Thus, there is no reason to expect precinct-level votes to follow Benford’s law and the argument fails. However, because county votes span several orders of magnitude, we cannot so quickly dismiss the county-level Benford argument.
Figure 1 shows the leading digit distribution for Trump’s (resp. Biden’s) county votes in Pennsylvania in red (resp. blue). The black bars show the predicted Benford distribution for Pennsylvania’s 67 counties. The height of the black bar for digit i is 67log(1 + 1/i), which is the expected number of county vote totals with leading digit i for a Benford distribution in Pennsylvania. Trump’s votes seem like a good Benford fit, while Biden’s do not.
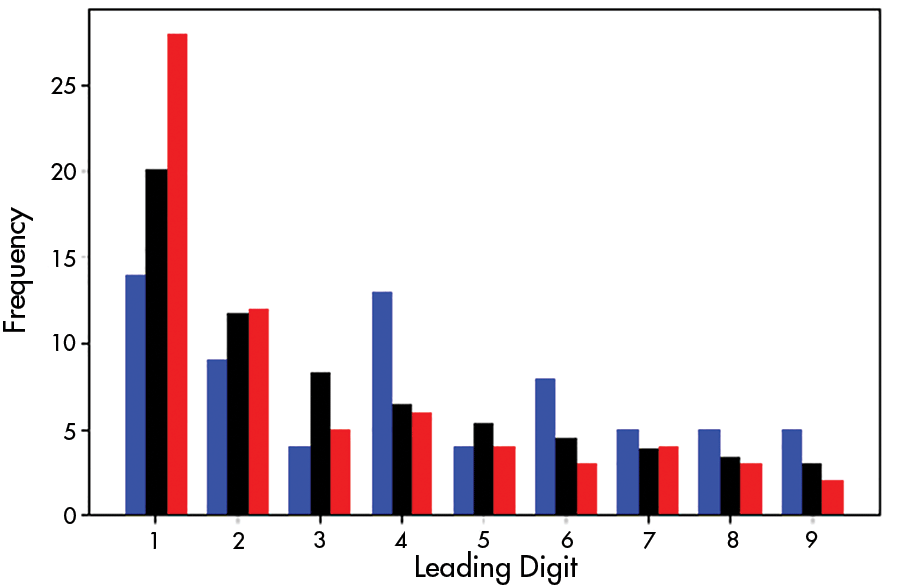
Figure 1. The frequency of leading digits of county votes for Biden in 2020 (blue) and Trump in 2020 (red) in Pennsylvania. The black bars show the expected Benford distribution.
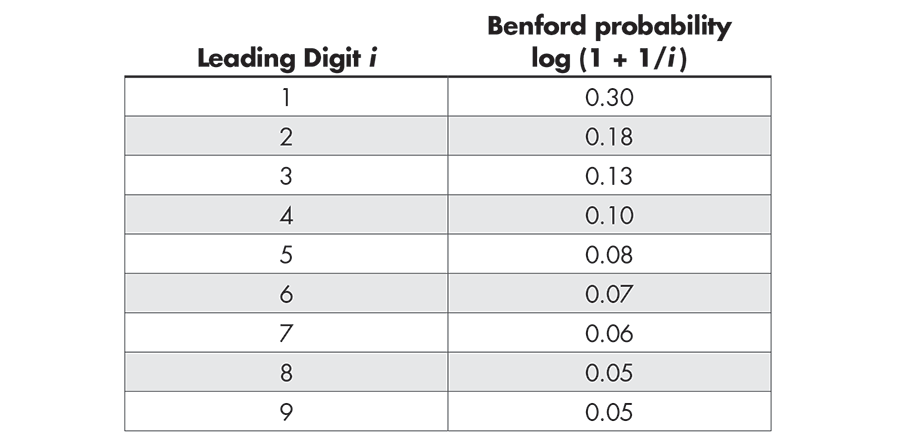
Table 1—Benford Probabilities for the Leading Digit Distribution
The argument under consideration states the failure of Biden’s Pennsylvania county votes to follow Benford’s law is an indication of voter fraud in Pennsylvania. This argument rests on the following three premises:
- Premise One: County-level votes for a major presidential candidate in each state should follow Benford’s law.
- Premise Two: Biden’s county votes in Pennsylvania are anomalous or out-of-bounds with respect to Benford’s law.
- Premise Three: A failure of county votes to follow Benford’s law indicates fraudulent activity.
To assess the county-level Benford argument, we evaluate each of these premises.
Do Presidential County Votes in Each State Follow Benford’s Law?
We investigate this question by examining county votes state-by-state for the two major presidential candidates in past US presidential elections and determining if they follow Benford’s law. Of course, we must be precise about what we mean for a particular vote distribution to “follow Benford’s law” to do this. How do we make rigorous the observation that Trump’s county votes in Pennsylvania are more “Benford-like” than Biden’s?
First, we decide which elections to examine. From the seven most recent presidential elections (1996–2020), we consider all states with at least 40 counties. Since each election has a choice of Republican or Democratic vote totals, we define a data point to be a choice of state, year, and party, totaling 448 such choices. Each data point has a county-vote leading digit distribution that can be compared to what Benford’s law predicts.
We compare the leading digit distribution of a given data point to the corresponding predicted Benford distribution using the χ2 goodness-of-fit test, a standard statistical test used to compare an observed distribution to an expected distribution for categorical data. Let n be the number of counties in a state and let Oi denote the number of counties in which votes for a given candidate have leading digit i. Let Ei = n · log(1 + 1/i) be the expected number of counties in which votes have leading digit i, as predicted by Benford’s law. Then, for each particular data point, we calculate the χ2 test statistic:
![]()
The smaller the χ2 value, the better the fit of the observed distribution is to the expected Benford distribution. Table 2 provides the leading digit information for presidential county votes in Pennsylvania. From this data, we calculate χ2 = 5.68 for Trump’s county-level votes and χ2 = 16.69 for Biden, confirming that Trump’s votes are a better Benford fit than Biden’s.
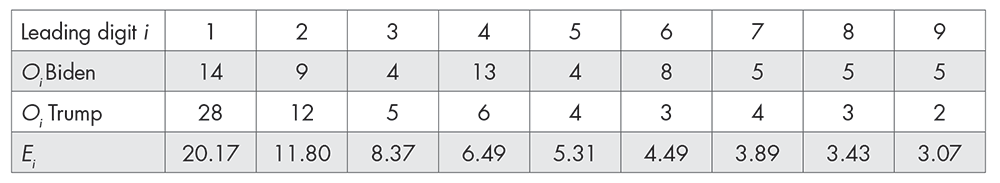
Table 2—Leading Digit Distribution of County Votes for Trump and Biden in Pennsylvania
For context, if the Oi were approximately uniformly distributed in Pennsylvania, then χ2 > 30. If χ2 > 15.51 for a given data point, then we can say with statistical significance at the 5 percent level that the Oi do not follow a Benford distribution. However, as with most cutoffs in statistics, the choice of 5 percent is essentially arbitrary. A distribution with χ2 < 15.51 might not look particularly Benford-like, even though we can’t formally reject the null hypothesis that the distribution is Benford.
To evaluate Premise One, we calculated the 448 χ2 values for each of our data points. Sixty-four of these values (36 Democratic and 28 Republican) are larger than the 5 percent significance cutoff value of 15.51, thus 14.3 percent of our data doesn’t follow Benford’s law according to the χ2 goodness-of-fit test. Furthermore, many of the data points with χ2 < 15.51 do not look particularly Benford-like.
The median χ2 value of the 448 we calculated is 9.88, meaning a ‘typical’ outcome in our data is something like the 2020 Republican votes in Tennessee shown in Table 3, where χ2 = 9.77. If we were inclined to find this data suspicious, we would observe that the dramatic dip at O3 and the increasing values at the tail of the distribution produce a histogram that doesn’t look like a good Benford fit, even though χ2 < 15.51.
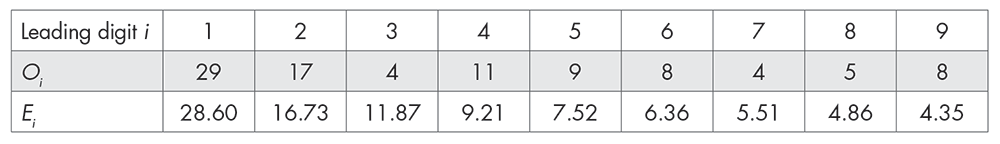
Table 3—The Leading Digits of Trump’s 2020 County Vote Totals in Tennessee (Oi Row), and the Predicted Benford Distribution (Ei Row)
Thirty-seven percent of our data points satisfy 9.77 < χ2 < 15.51, meaning that a large percentage follow Benford’s law in the sense that we can’t reject a Benford fit at the 5 percent significance level, but they can have individual digits that drastically deviate from what Benford predicts (for Tennessee, consider i = 3) and have histograms that can look strikingly different from the classic Benford histogram.
The χ2 goodness-of-fit test measures how well a leading digit distribution fits the corresponding Benford distribution. To investigate Premise One, we could also analyze how well an individual observed digit Oi matches the predicted Benford digit Ei. Instead of considering the overall digit distribution, we could focus on individual digits, testing the null hypothesis Oi / n = Ei / n for each i. This requires a straightforward hypothesis test for a proportion using z-statistics and is common in Benford analysis. For examples of this kind of analysis (and further explication of χ2 tests in a Benford context), see Mark Nigrini’s classic paper, “A Taxpayer Compliance Application of Benford’s Law.”
We performed the individual digit test for the 4,032 Oi values in our data set; 200 of our 448 data points contain at least one digit i such that Oi / n deviates from Ei / n with statistical significance at the 5 percent level. Thus, 45 percent of our data points do not follow Benford’s law in the sense that there exists an i where the observed proportion of county votes with leading digit i significantly deviates from the Benford expectation, even though many of these data points satisfy χ2 < 15.51. This occurs for Trump’s 2020 vote totals in Tennessee, where we do not reject the null hypothesis that the overall leading digit distribution follows Benford’s law, but the proportion of Trump’s vote totals that begin with leading digit three does significantly deviate from the Benford prediction at the 5 percent significance level.
Based on data from recent presidential elections, we determine that county vote totals are Benford-like in general, but we can’t expect every county vote distribution to be a close Benford fit. Therefore, Premise One is somewhat true.
Are Biden’s County Votes in Pennsylvania Anomalous?
Is Biden’s χ2 value of 16.69 in Pennsylvania anomalous or suspicious in some way? Of the 448 data points, 29 Democratic and 23 Republican satisfy χ2 > 16.69. Thus, while Biden’s value is on the high end of the data, it is not an outlier. Biden’s county-level votes are also not anomalous for Democratic county votes in Pennsylvania; see Figure 2, which displays recent χ2 values for county-level vote distributions for both major presidential candidates in Pennsylvania and four other states.
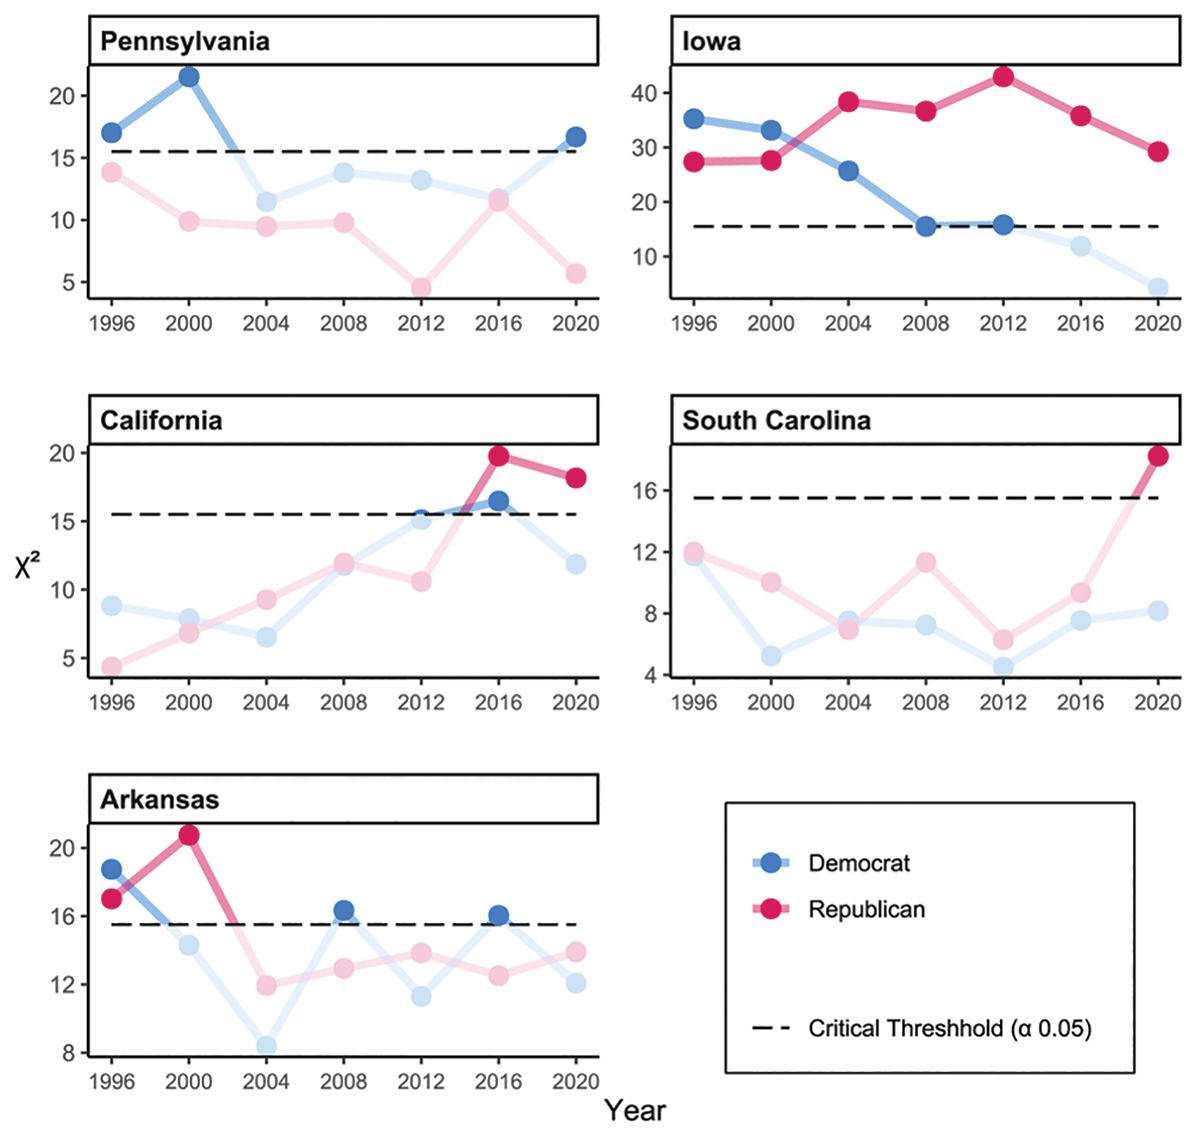
Figure 2. χ2 values for county-level vote distributions for the two major presidential candidates in five states
In recent years, Democratic votes tend to produce large χ2 values in Pennsylvania. It is not clear why this is the case. Some states tend to have high χ2 values for either Republican or Democratic votes, and this can perhaps be explained by factors like the geographic distribution of voters. For example, χ2 values for the Republican candidate in Iowa are large, spanning from 27.36 all the way up to 42.95. In this state, Republican county vote totals are sometimes a worse Benford fit than an unBenford-like uniform distribution. These numbers might indicate that Republican voters are geographically distributed in such a way that county votes won’t produce a Benford distribution.
As an aside, we note Biden’s county-level votes in states other than Pennsylvania do not raise any χ2 red flags with respect to Benford’s law. Across all the states we examined, Biden’s median χ2 value was 7.55 (well below the median value of 9.88 for all data points) and his largest value was 16.86. By contrast, Trump’s median value across the 2016 and 2020 elections was 10.34 and he achieved nine χ2 values larger than Biden’s maximum. If Biden’s Benford-fit in Pennsylvania were cause for concern, then many of the county vote totals for Trump would raise similar red flags.
It is possible that Biden’s Pennsylvania votes are Benford-anomalous in ways other than a high χ2 value. For example, Biden’s distribution has exactly one statistically significant digit, i = 4, where we reject the null hypothesis Oi / n = Ei / n. Across our 448 data points, there are 46 that contain two or more statistically significant digits, and thus Biden’s Pennsylvania distribution is not anomalous in this respect.
Alternatively, some people who found Biden’s Pennsylvania data concerning were bothered by the spike in Biden votes at digit four, where O4 = 3.25 · O3, claiming such a dramatic increase over a previous digit is suspicious. To test this, we searched our data points to find all instances in which there exist i > j such that Oi ≥ 3.25 · Oj and Oj > 0. There are 92 such instances, 47 Republican and 45 Democratic, and thus such spikes are not uncommon. For example, in Indiana in 2020, O8 = 2 while O9 = 11 for the Republican votes. In Michigan in 2020, Trump’s county votes create a slowly building spike at the tail end of the leading digit distribution, with Oi values of 22, 13, 11, 10, 8, 2, 3, 6, 8.
Biden’s Pennsylvania distribution has features like a high χ2 value that aren’t exactly common in our data, but also aren’t anomalous. It is possible that we could find a convoluted condition with respect to which Biden’s county-level Pennsylvania performance is anomalous, but then we would be grasping at straws to justify a predetermined conclusion. We conclude that Premise Two is false. With respect to Benford’s law, Biden’s 2020 county vote data in Pennsylvania is not suspicious.
If an anomalous χ2 value were cause for concern, then President Trump’s votes in states such as California or South Carolina (see Figure 2) would raise red flags. This leads to our final premise.
Does a Benford Failure Indicate Fraudulent Activity?
Even if premises one and two were true, the county-vote argument under consideration requires that a statistical ‘irregularity’ (e.g., a failure to conform to Benford’s law) is an indication of fraudulent activity. However, there are several reasons other than fraud why vote totals might fail a particular statistical test.
For example, the Democratic χ2 value for Arkansas in 1996 is 18.75, which is a bit of an outlier for Arkansas Democratic values (see Figure 2). It is possible this large value means there was Democratic fraud in Arkansas AR in 1996. On the other hand, 1996 is the only year in our data set in which the Democratic candidate was from Arkansas, and 1996 featured a strong performance (relative to the rest of our data) by a third-party candidate. Without further investigation, we can’t know if a particular statistical irregularity was due to fraud or other factors such as relatively strong or weak third-party performance, relatively high or low voter turnout, disruptions caused by a pandemic, etc.
Furthermore, Premise Three contains an assumption that goes unstated, but is clearly implied: Anomalous votes are an indication of fraudulent activity by the party that received those votes. This implicit assumption is false. (Trump received five of the 20 largest χ2 values in our data set, so this is fortunate for him.) For example, Trump claimed that, in swing states like Pennsylvania, corrupt election officials threw out his ballots and corrupted voting machines switched Trump votes to Biden. If these claims were true, we would see statistical irregularities in Republican votes, and this would not imply that fraud was committed by Republicans. A failure to follow Benford’s law can, in some circumstances, be an indication of foul play, but it is fallacious to say that such a failure in an electoral context necessarily implies voter fraud by a particular party.
Conclusion
The argument that the failure of Biden’s county-level votes in Pennsylvania to follow Benford’s law is an indication of voter fraud is interesting and cannot be dismissed entirely. The argument rests on three premises, which we investigated using recent presidential election data. Unfortunately, for proponents of the argument, the premises went 0.5 out of 3 and the argument fails. However, the argument allowed for all sorts of data-crunching fun that included the use of χ2 goodness-of-fit tests, hypothesis tests for a proportion, and outlier analysis. In this sense, the argument succeeds. Feel free to play with the data yourself.
Even though Benford’s law has not been successfully applied to detect fraud in US presidential elections, we note this law can be used to detect fraudulent behavior in other contexts. Famously, Benford’s law has been used to detect accounting and financial fraud and been deemed admissible for use in a court of law for such purposes.
In closing, we remark that while Benford’s law is not useful as a fraud-detection tool for county-level votes in US presidential elections, prior research suggests it can be used to help detect fraud in other elections. For example, Walter Mebane in his CHANCE article “Fraud in the 2009 Presidential Election in Iran?” has made a strong argument that the version of Benford’s law that specifies frequencies for second digits can be used to detect fraud in the 2009 Iranian presidential election. At first glance, this might be good news for people who would like to use Benford’s law to detect fraud in Biden’s votes; however, we invite the reader to verify that Trump’s 2020 county vote totals in Pennsylvania fail the second-digit version of Benford’s law spectacularly, while Biden’s do not.
About the Authors
Brooks Groharing graduated from William Jewell College in 2021, earning a BA in data science with a bioinformatics emphasis. His primary focus is on computational biology, though he has a broad enthusiasm for applying statistical methods to interesting problems. He really enjoys making graphs.
David McCune is an associate professor of mathematics at William Jewell College. His research focus is the mathematics of elections, with an emphasis on apportionment theory. He earned his PhD in algebra from the University of Nebraska-Lincoln in 2011.
Dear Sirs,
Excellent article.
In the Tennessee example for Premise 1 wouldn’t the Bonferroni adjustment be appropiate? You are doing 9 tests instead of 1 and would have a greater chance of a Type 1 error.
The appropiate alpha would be .05/9 or .0055.
While Tennessee’s leading digit #3 would still be way “out-of-bounds”, I am wondering how many of the 200 anomalies that you found would still be anomalies if the alpha was .0055 and not .05?