
Building and Teaching a Statistics Curriculum for Post-Doctoral Biomedical Scientists at a Free-Standing Cancer Center

The past decade has seen significant improvements in the way human tumors are characterized. The ability to collect small- and large-scale data on several aspects of the human genome has increased considerably. Several statistical software packages are available today, including the R programming language, which is an open-source tool, and GraphPad Prism, which has a drop-down menu for analysis and should be available to most cancer researchers through institution-wide licenses.
These packages are democratizing scientific research by empowering every biomedical researcher to analyze data and make data-informed decisions rapidly. Thus, by many measures, cancer research and oncology practice are in a golden age.
Yet, there are flaws in the current biomedical system that threaten the future of cancer research and oncology drug development. Although science has long been regarded as “self-correcting,” there is growing concern that the system for ensuring reproducibility of scientific research is failing and has to be restructured, as Drs. Francis Collins and Lawrence Tabak outlined in 2014 in Nature magazine.
A pernicious influence of these failures in oncology is the alarmingly high attrition rate of cancer drugs. A 2011 study by Hutchinson and Kirk noted that only 5% of the agents identified as having antitumor activities in preclinical cancer studies reach market authorization. A recent statistical review of more than 400,000 clinical trials conducted between 2000 and 2015 (Wong, et al. 2018) found the success rate in oncology, defined as translation of drugs from preclinical studies to market authorization, to be as low as 3.4%.
Moreno and Pearson said in 2013 that today, cancer drug development is seen as an enormously costly and inefficient process that fails to translate to significant patient benefit. Media narratives of poor reproducibility of preclinical science and its impact on attrition rates of cancer drugs also puts cancer research at risk of losing public trust and public support, which are necessary ingredients for sustaining progress in science and human health.
The National Institutes of Health (NIH) and other scientists have examined and identified a complex array of factors contributing to lack of reproducibility among preclinical cancer studies and high attrition rates for cancer drugs.
Education in statistics could help. Some of the issues include: (i) misuse or misunderstanding of statistical design such as lack of blinding, randomization, replication, and control; (ii) using incorrect or suboptimal tests; (iii) confusion between standard deviation and standard error; (iv) reporting p-values that are inconsistent with the test statistic; (v) p-hacking; (vi) analyzing dependent measurements as if they are independent; (vii) not specifying how replicates were treated in the analysis; (viii) lack of power calculation; (ix) and not reporting details of the experimental design and which statistical tests were used, as well as whether assumptions of the tests used were examined.
Some of these factors can cause invalid and unreplicable results directly, such as items i, v, and vi. Others make it difficult for a reviewer or reader to judge the adequacy of the analysis (such as vii, viii, and ix) or create confusing and unclear results (like iii and iv).
Training preclinical cancer researchers in these areas of statistics is a necessary step in the right direction to begin to address reproducibility issues currently being faced in cancer biomedicine.
Identifying Needs
With this in mind, the authors sought to develop, implement, and evaluate a statistics curriculum for preclinical scientists at the Memorial Sloan Kettering Cancer Center (MSK). The authors conceived and implemented the curriculum when both were biostatistics faculty members at MSK.
The objective of the curriculum development was to create a statistical training program for early-career cancer researchers conducting preclinical laboratory research. The broad goals of the course were to: (i) enhance researchers’ general understanding of foundational statistical concepts and provide tools to address the issues above and (ii) provide researchers with an enriching and insightful experience in statistical methods for preclinical cancer studies through problem-based learning and inquiry-oriented strategies.
Before delving into the process used to develop this statistics curriculum, it is useful to understand the institution where it was developed, and why it was needed.
MSK is a free-standing cancer center in New York City, and the Sloan Kettering Institute (SKI) serves as its experimental research arm. Although they are housed under one umbrella and collaborations are often across the enterprise, there are important distinctions between MSK and SKI that are relevant to learning opportunities and scope of research.
Junior and training clinicians and clinical fellows at MSK have myriad educational opportunities to learn about issues (analysis, sample size calculation, data collection) related to clinical study and trial design on a patient level. Several of these opportunities are part of National Institutes of Health (NIH) training programs, and others have been absorbed into a yearly symposium or series of didactic lectures in a disease area. Yearly and ad hoc lectures on study design or aspects of statistical analysis are also routine. Furthermore, clinical disease areas are assigned to a biostatistician and thus, are well-supported in most research endeavors that involve statistical analysis and study design.
SKI comprises more than 100 laboratory investigators, 400 post-doctoral research fellows, and 300 PhD and MD/PhD graduate students, with formal cross-collaborations with institutions in the surrounding area, including Weill Cornell and Rockefeller University. A main focus of SKI investigators’ research is laboratory-based, and less so on patient-level data.
There are many resources in these institutions. However, it is important to note that, while training in statistics has been integrated into clinical education as noted for MSK, it has not been a mandatory requirement in most graduate programs in the biomedical sciences, including SKI, although this has been changing over the past several years for new students, according to Weissgerber, et al.
Embedded in laboratories, post-doctoral fellows at SKI are constantly designing and running experiments. They are junior scientists who are working with their principal laboratory investigators on ground-breaking experimental questions that are becoming increasingly complex with the rise of exciting scientific and technological innovation and discovery.
Yet, until a few years ago, they did not have adequate resources for learning and practicing statistics. In most situations, fellows use point-and-click software with limited understanding of the options, and low reproducibility. Submitted papers often come back from journals with extensive comments, many related to issues of statistical analysis and design, before being considered acceptable for publication. Moreover, statistical issues faced by laboratory scientists are different from those faced by clinicians designing trials and studies.
Sensing this gap, Dr. Ushma Neill, vice president of the SKI Office of Scientific Education and Training (OSET), reached out to the MSK biostatistics department for support in February 2016. OSET is dedicated to enhancing the academic, collegial, and professional environment for all post-graduate scientific trainees at MSK. Its overall mission is to prepare post-doctoral researchers with the training and skills they need to pursue rewarding careers in academia, industry, and other professional positions.
With this understanding, MSK biostatistics staff embarked on a mission to create a training course in statistics tailored for cancer biomedical researchers. The goal was to ensure the course met the needs of students while supporting the overarching research aims of the laboratory in which a student was embedded.
Scientific discovery is a primary goal for students and their research labs. Students are keen to learn about identifying the right test statistics to use for analyses. Research laboratories are keen for their students to learn about developing research questions, designing statistically rigorous experiments, and critiquing their own research and that of others. We wanted to establish a course that would train students in both experimental design and data analysis methods, and that could be disseminated to others beyond MSK.
The course was meant to be rigorous enough to provide post-docs with tools for how to think about their research problems from a statistical point of view, but without the extensive readings, homework, and coding workshops that are usually entrenched in traditional semester-long courses designed for students in degree-granting programs.
Creating the Course
Brainstorming and stakeholder input
Right away, we identified three groups of stakeholders from whom we wanted to solicit feedback about what to include as topics and teaching materials (Table 1): post-doctoral scientists who would actually take the class; laboratory principal investigators with whom the post-docs are embedded and train; and biostatistics faculty who have worked with biomedical scientists and could identify common statistical issues in biomedical cancer research. We set out to solicit feedback from these three groups of stakeholders in 2017 and again in 2018. The process of acquiring this multi-faceted feedback and creating and adapting the curriculum to address this feedback, was extensive and lengthy, but critical.
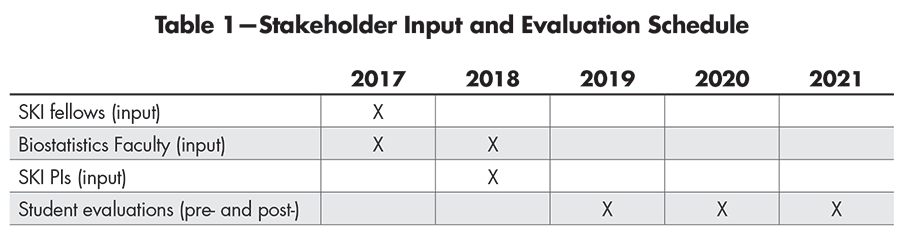
Table 1—Stakeholder Input and Evaluation Schedule
After reading several articles by SKI scientists published in high-profile science journals and considering statistical factors that have been revealed as contributing to a lack of scientific reproducibility, we provided post-docs with a list of possible statistics topics and open-ended questions about what they would want to achieve in an eight-week lecture-style statistics course. This important feedback identified topics such as hypothesis testing and experimental designs, sample size and power, biological and technical replications, interpreting p-values and confidence intervals, and computing in R, among others (Table 2).
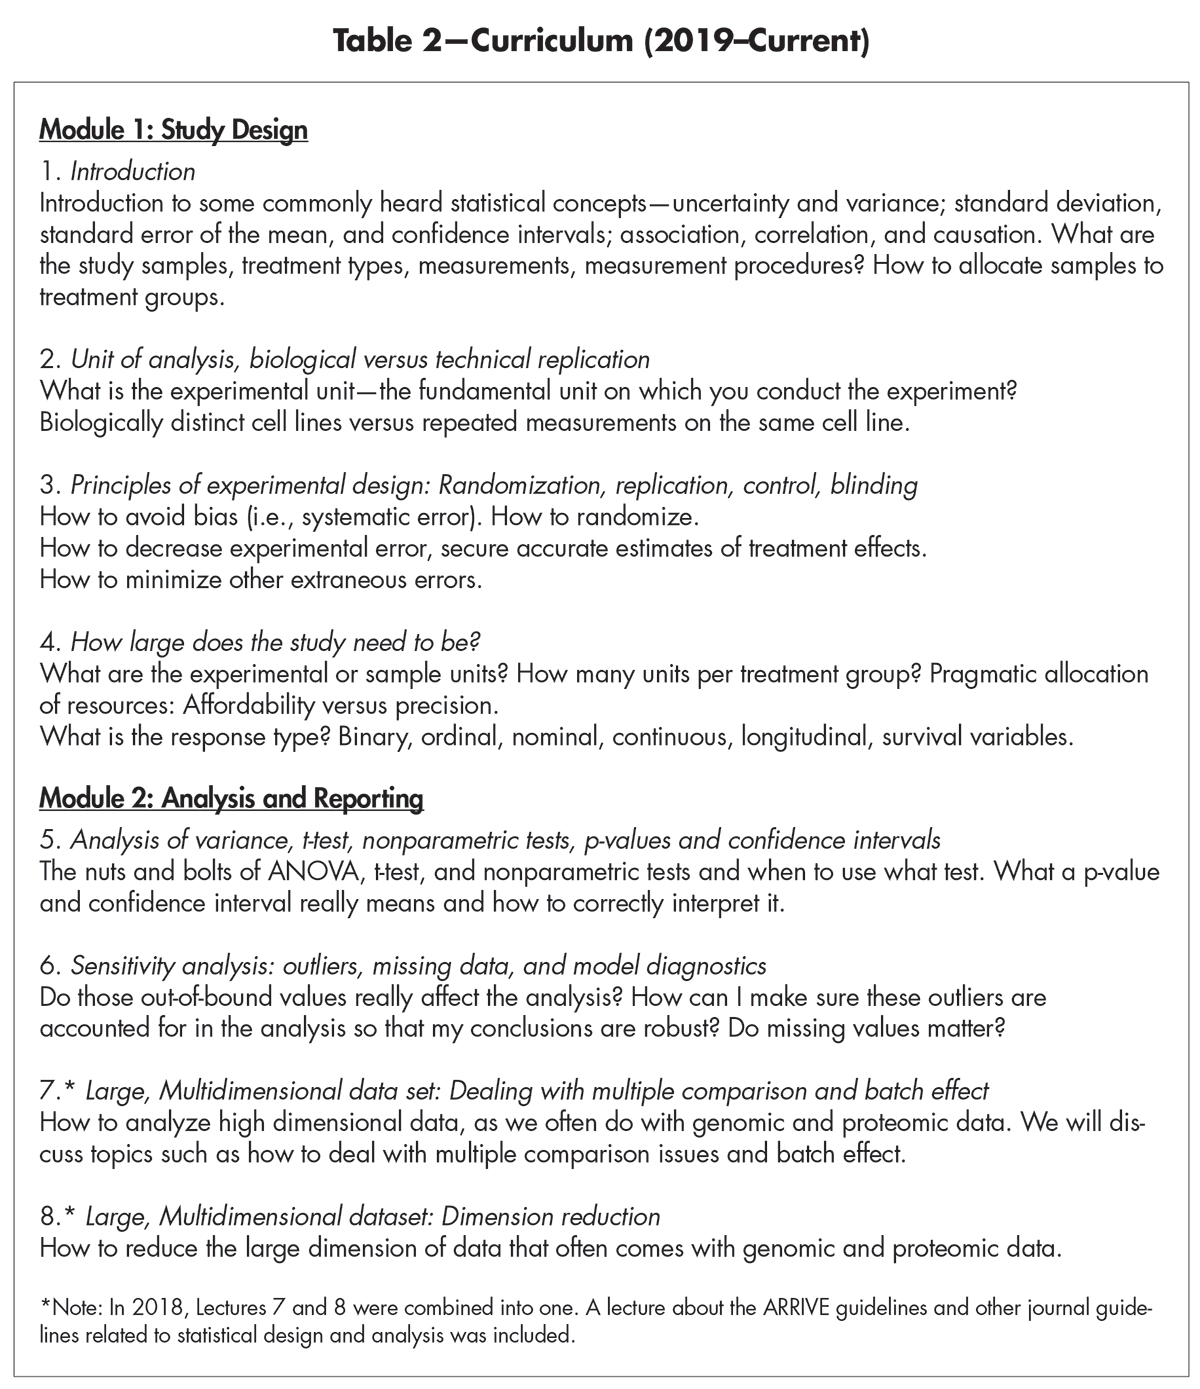
Table 2—Curriculum (2019–Current)
A short email survey to the biostatistics faculty and SKI laboratory principal investigators yielded further input. Respondents suggested including a lecture discussing the ARRIVE guidelines, a checklist of recommendations to improve the reporting of research involving animals, and high-tier journal statistical guidelines that should be considered before manuscript submission. Additional input included computing examples in each lecture.
From all this input, the goals of the course became clearer: to provide a template that post-docs could use to think critically about their own research questions and work, as well as to critique the work of other scientists scientifically.
The first course was designed to include eight lectures, with each focusing on a basic statistics issue of importance to SKI scientists and illustrated with concrete examples. In the first offering of the class in 2018, data analysis skills were not a primary focus because this limited course was only one under an umbrella of lectures offered by OSET and tailored for post-docs.
The statistics course would focus on overarching statistics concepts used in biomedical science and, by nature, would not go in depth on any one topic. Lectures on computing in R and other statistical software were being offered concurrently and taught separately by other faculty under this umbrella.
Materials for the Course
A series of readings for the course included, first, selected technical readings from the Nature Methods Points of Significance column—two-page readings on a single statistical topic, written with biomedical scientists in mind. Topics include error bars, significance, and p-values among many others. We also included three manuscripts published by SKI scientists in high-tier journals, such as Nature Medicine, that report results from comprehensive and contemporary laboratory experiments. The methods, graphs, and tables from these three papers were interweaved in each lecture as concrete illustrations of the topic that day.
Finally, “fun readings” were also included—lay articles, short stories illustrating concepts in uncertainty and genomics, as well as links to blog posts, podcasts, and other hands-on resources. (A listing of all materials is available from the authors by request.)
Evaluate and Adapt
The course has been taught yearly since 2017. In 2020 and 2021, the course was taught partially or wholly virtually, due to the COVID-19 pandemic. The first year provided informative evaluations of the curriculum, which in 2019 resulted in a finalized, adaptable, and transferable curriculum. Here are the evaluation strategies used each year.
After offering the course in 2017 and 2018, we asked 18 questions via SurveyMonkey. These questions were helpful in refining the curriculum. Example included: Did the topics align with the needs of your biomedical research work? If there is one topic you want to be included that we missed, what would that topic be? What aspects of statistical design in your own research will you change based on what you learn in these lectures?
These survey results provided actionable feedback, such as eliminate the ARRIVE and journal statistical guidelines lecture; include GraphPad Prism in the lectures; conduct a data analysis in class; and add a lecture about analyzing large data sets. The journal guidelines lecture was found to be uninspiring and as result, we felt could be better taught by example throughout the course.
With this input and additional informal feedback from the biostatistics and SKI science faculty, the curriculum was adapted to include examples in Prism, a point-and-click statistical software used by many biomedical scientists in the research community; the lecture on journal guidelines was eliminated; and a lecture on large data with an example in R software was included as its own lecture. It is important to note that the purpose of adding PRISM examples to the curriculum was not to teach how to use PRISM, but rather to motivate and communicate statistical design and analysis concepts by leveraging student familiarity with PRISM and its many options.
SurveyMonkey results from the adapted 2018 course indicated that the students wanted to have hands-on experience and “more engaging” lectures. They also wanted more data analysis. These comments were more complex to address, especially since this limited course was not designed to have computing and data analysis as a focus. After thinking through this feedback, the course was further refined by the addition of interactive R Shiny apps. With the programming help of MSK biostatistician Axel Martin, these interactive apps were included in each lecture to provide a hands-on activity that illustrated important statistical concepts.
For example, one of eight apps was created to illustrate the central limit theorem. Students can change the number of experimental units and distribution type to understand how the distribution of the means looks under different scenarios (not shown). Figure 1A shows a screenshot of the app used to demonstrate traditional statistical concepts of power and type I error. The app allows the user to input different effect sizes, standard errors, and errors.
Figure 1B shows a screenshot of the multiple comparisons app, which illustrates the role of multiple comparisons, which is a crucial issue, especially in large biomedical genomics data. It is particularly an issue in preclinical studies where sample sizes are small and the number of comparisons is large. Users can choose different types of multiple correction options to see how p-values change when adjusted for multiple correction.
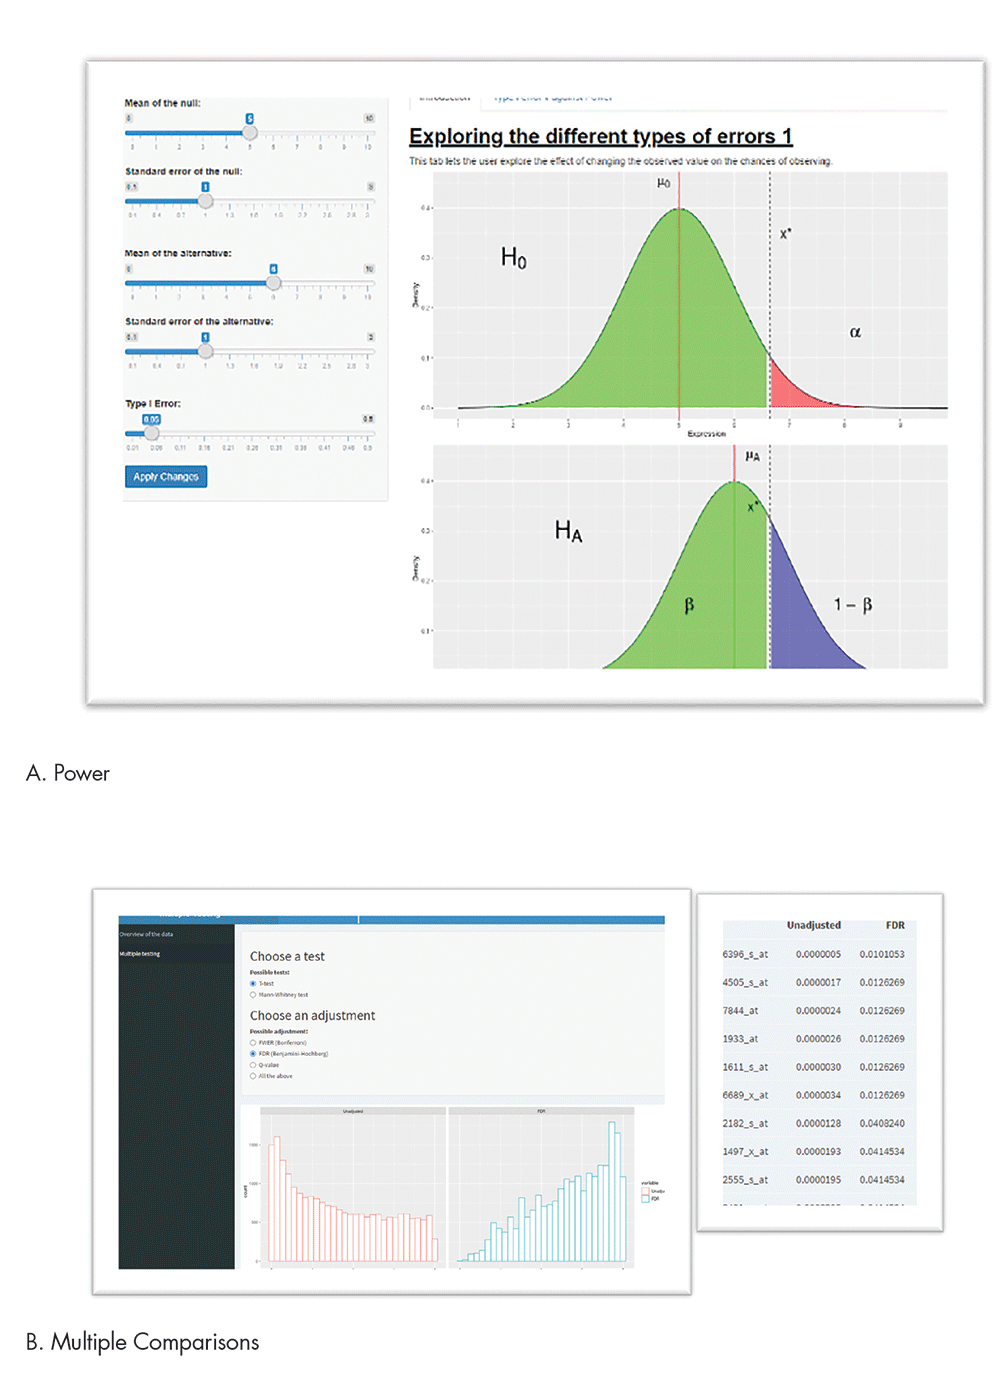
Figure 1. Selected apps.
In the histogram that is outputted, the p-values from a large number of tests are shown in a red histogram, illustrating a lot of small p-values on the left-hand side. Once adjusted for multiple comparisons, the blue histogram shows the number of comparisons with small p-values has reduced considerably, pushing p-values to the right to be closer to 1. Users can also get a table of adjusted and unadjusted p-values to see the magnitude of p-values before and after adjustment for multiple comparisons.
Finalized Curriculum and Lecture Structure
Table 2 provides the topics of each lecture. The first four lectures are devoted to study design, while the last four lectures focus on analysis.
Each lecture begins with a brief recap of the previous one(s), with particular attention to the interesting issues and questions that arose. The lecture topic of the day was introduced by first raising a hypothetical research question related to the lecture. Students were asked for their thoughts, and we then introduced the topic conceptually in a lecture using PowerPoint slides and accompanying R Shiny apps for 40 minutes. An additional 20 minutes allowed us to discuss the topic practically in the three selected published journal articles disseminated to students before the course, and in screenshots taken from PRISM.
Open discussion and questions rounded out the lecture. The open discussion often brought up topics and questions pertinent to students’ current research. A common question is whether to use standard error, confidence interval, or standard deviation to exhibit variability.
At times, topics brought up during discussion and afterward were expanded on in later lectures. For example, a student brought up the topic of time-to-event endpoints. Although this was not part of the curriculum, we spent 20 minutes on Kaplan-Meier estimates and censoring in a later lecture.
The course curriculum with Shiny apps has been taught in 2019 (Patil and Satagopan), 2020 (Patil and Audrey Mauguen), and 2021 (Mauguen and Kay See Tan). In 2019, we replaced the SurveyMonkey evaluation with a two-stage evaluation system to identify topical improvements in knowledge using a pre-/post-assessment system. This evaluation system was developed with Dr. Bill Trochim of Cornell University. In Stage 1, we asked students to fill out a survey before beginning the course. The evaluation takes the format as seen in Figure 2. In essence, students graded their understanding of different topics before the start of the course and identified the level of understanding desired at the end of the course. For example, under measures of uncertainty, and before starting the course, a student was asked to self-evaluate their understanding of standard deviation, standard deviation of the mean, and confidence interval. They were also asked what understanding they hoped to achieve at the end of the course.
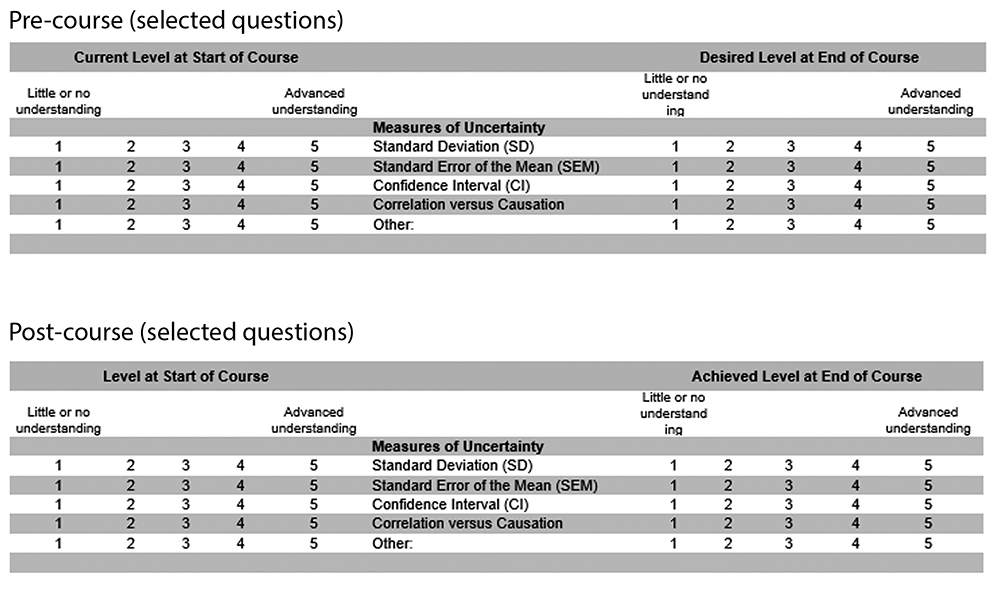
Figure 2. Pre- and post- evaluation format (2019–current).
In the second stage of the evaluation, students were asked to complete a similar survey, but with slightly different question stems. With all the course material in hindsight, that survey asked what their level of understanding was at the start of the course and what they felt they achieved at the end of the course. In 2019 and 2020, patterns were similar: Understanding was low at the start, and student understanding at the end of the class increased. However, there is still some room for improvement because actual understanding did not fully meet the understanding desired (Figure 3).
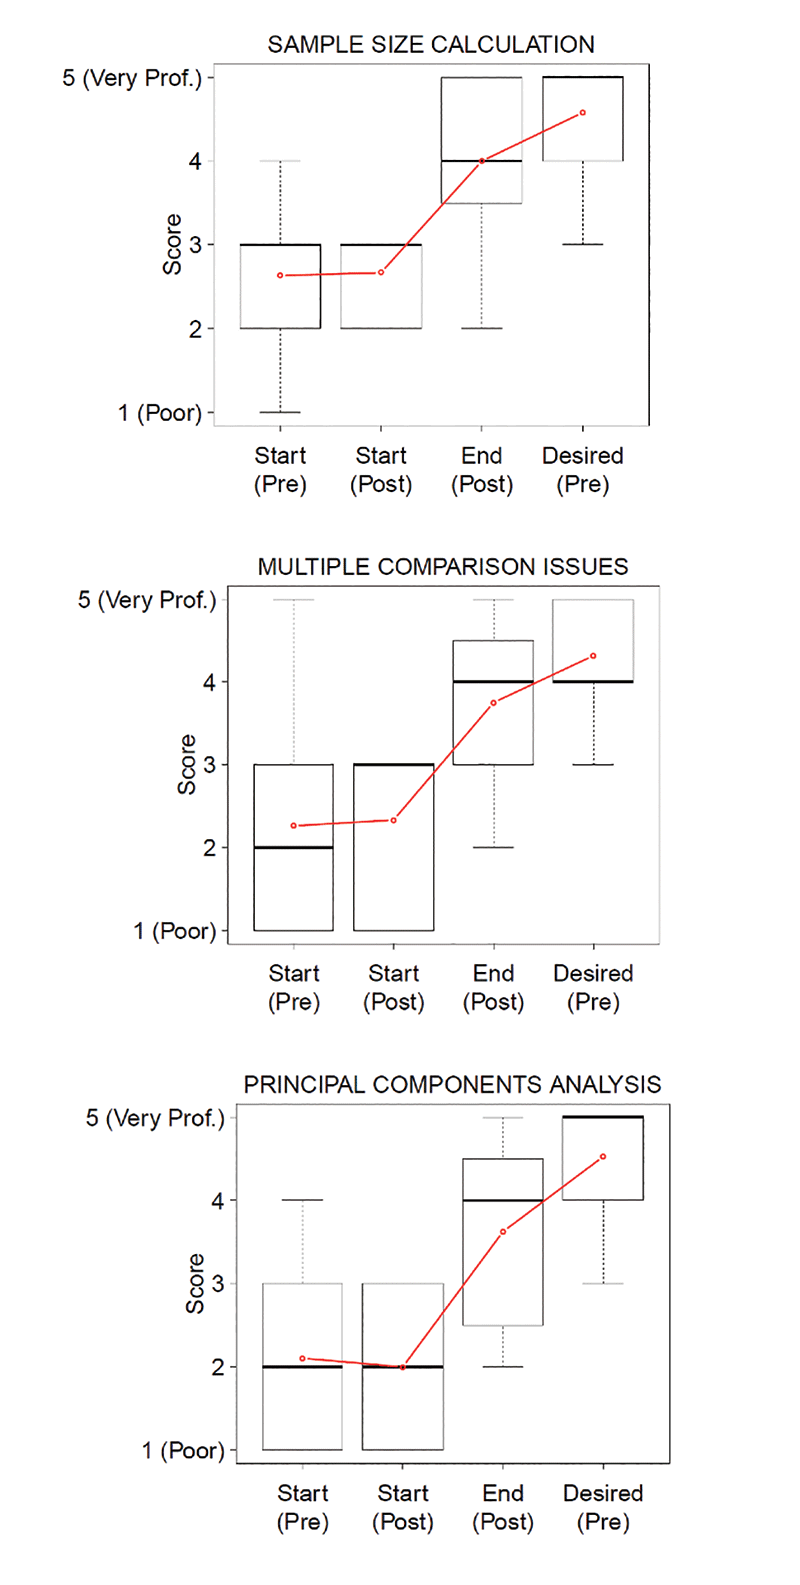
Figure 3. Selected results from pre-/post-surveys, 2019.
Further, these are self-reported understandings. The second-stage evaluation included an evaluation of the apps, as well as open-ended questions about what students thought was missing or what they especially liked. We asked whether the apps kept the student adequately engaged, and if the apps helped them learn the design and analysis concepts better. Most students (over 80%) in both years replied “yes” or “somewhat” to these two questions.
Challenges
There were several challenges in creating this short course.
First, the course was designed for an in-person format, and thus was limited to 25 students a year. However, there are more than 500 post-docs at MSK. Although we plan to record the lectures, how to scale up this curriculum and still allow small group discussion is not easily solved.
Second, MSK is a free-standing cancer center where faculty biostatisticians are often not funded or provided with percent effort for teaching courses that do not contribute to a degree-granting curriculum; post-docs fall into this non-degree-granting category.
Third, students come with diverse levels of statistical knowledge and have different computing needs.
Fourth, the research questions and laboratory experiments to collect data to answer them can be wildly varied.
With NIH R25 support (CA244071), we were able to secure effort and time to do this work, and we plan to make all materials available to all educators. We hope that these materials, along with the extensive notes written for each lecture, will make it easier for biostatisticians to provide a conceptual, yet practical, short course in applied statistics for biomedical scientists.
Conclusion and Discussion
The biomedical research community recognizes the significant role of training in statistical methods as a critical step for addressing the goals of advancing biomedical research. Drug development for human cancers relies heavily on published literature emanating from preclinical research, especially for new targets and biology that inform human clinical trials. Hence, the results of preclinical studies must be robust to withstand the demands and challenges of tumor heterogeneity in human clinical trials.
Today, academic institutions offer online statistics training programs for biomedical researchers, including Coursera courses from Johns Hopkins University and MOOC courses from Harvard University. These have the advantage of simultaneously targeting several thousands of biomedical researchers from around the world. The online nature of these programs allows a researcher to learn at their own schedule and pace. These courses focus primarily on analyses of Big Data emerging from the rapidly evolving high throughput genomics technologies. They offer training in regression techniques, data normalization methods, multiple testing correction, cluster analyses, and cutting-edge penalized regression analyses and machine learning methods to analyze large data sets.
However, preclinical cancer researchers have unique needs that may not be entirely addressed by these online courses. Preclinical cancer researchers often work with a small number of animals and cell lines. Data from these studies often have outliers, missing values, and repeated or longitudinal measurements that are not independent. Study design is a crucial part of preclinical work. Statistics coursework for preclinical cancer research has to address different types of designs (such as clustered and non-clustered study designs, stratified designs); blinding; randomization; replication; control; data visualization methods; strategies for handling sample attrition and outliers; and additional statistical considerations such as bootstrapping, permutation tests, and Bayesian statistics. A successful statistics course for preclinical cancer researchers also has to aid in recognizing when more-sophisticated analyses are required and when to consult a statistician.
The key step involved identifying relevant stake holders and obtaining their input. From this input, it became clear that students come to class with different needs, different research questions, and different computing backgrounds. Data examples used throughout the class had to reflect this.
In addition, post-docs are not traditional students solely devoted to coursework. Homework assignments, exams, long readings, and a full semester of classes would not be appropriate. To keep students engaged while meeting the overall goals of the course, innovative teaching tools were created.
Also critical to developing this curriculum were the student evaluations. These evaluations helped identify topics we may have missed and where we could improve. Based on this formal feedback and the informal feedback from discussions during and after each lecture, we were able to adapt the curriculum and add material students were actively engaged in, and thus we hope, promote robust and reproducible modern biomedical research.
Further Reading
Collins, F.S., and Tabak, L.A. 2014. NIH plans to enhance reproducibility. Nature 505(7485), 612–613.
Hutchinson, L., and Kirk, R. 2011. High drug attrition rates—where are we going wrong? National Review of Clinical Oncolology 8(4):189–90.
Moreno, L., and Pearson, A.D. 2013. How can attrition rates be reduced in cancer drug discovery? Expert Opinions in Drug Discovery 8(4):363–8.
Weissgerber, T.L., Garovic, V.D., Milin-Lazovic, J.S., Winham, S.J., Obradovic, Z., Trzeciakowski, J.P., and Milic, N.M. 2016. Reinventing biostatistics education for basic scientists. PLoS Biology 14(4):e1002430. PMCID: PMC4825954.
Wong, C.H., Siah, K.W., and Lo, A.W. 2018. Estimation of clinical trial success rates and related parameters. Biostatistics kxx069. https://doi.org/10.1093/biostatistics/kxx069.
About the Authors
Sujata Patil and Jaya Satagopan developed this curriculum while faculty members at the Memorial Sloan Kettering Cancer Center. Patil is currently section head of cancer biostatistics at the Cleveland Clinic. Staggopan is a professor of biostatistics and associate dean for faculty affairs at the Rutgers School of Public Health.


