
Pathways to Increasing Trust in Public Health Data
An Exploratory Analysis of Quality Issues and Potential Remediation for Data Collected Using the Community Health Toolkit

Digital tools make it easier to collect data about patients and the care they receive, and health workers can use these data to improve the coverage, speed, and quality of health services. Community Health Workers (CHWs) are typically recruited from the communities they serve to provide door-to-door care among their neighbors, and increasingly are collecting digital data during routine care visits, thanks to the proliferation of low-cost digital health tools such as smartphones with open source health applications.
While there is mounting evidence that digital tools can strengthen community health systems, the full impact of these technologies has not yet been realized because data collected by CHWs are often considered of low quality and unreliable for data-driven decision-making.
Numerous studies in a range of lower-income settings have documented data quality concerns, as have recent reports by working groups such as the Frontline Health Workers Coalition. When mistrust in the quality of data becomes a norm, the resulting lack of “data trust” can have an impact on decision-making throughout the whole health system, particularly where community health services account for a majority of all primary care visits. While identifying and taking action against inconsistent or problematic data (referred to interchangeably as “IoP” and “IoP data”) is not the only solution to increasing data trust, it is a key part of any solution that attempts to break the data quality vicious cycle (Figure 1).
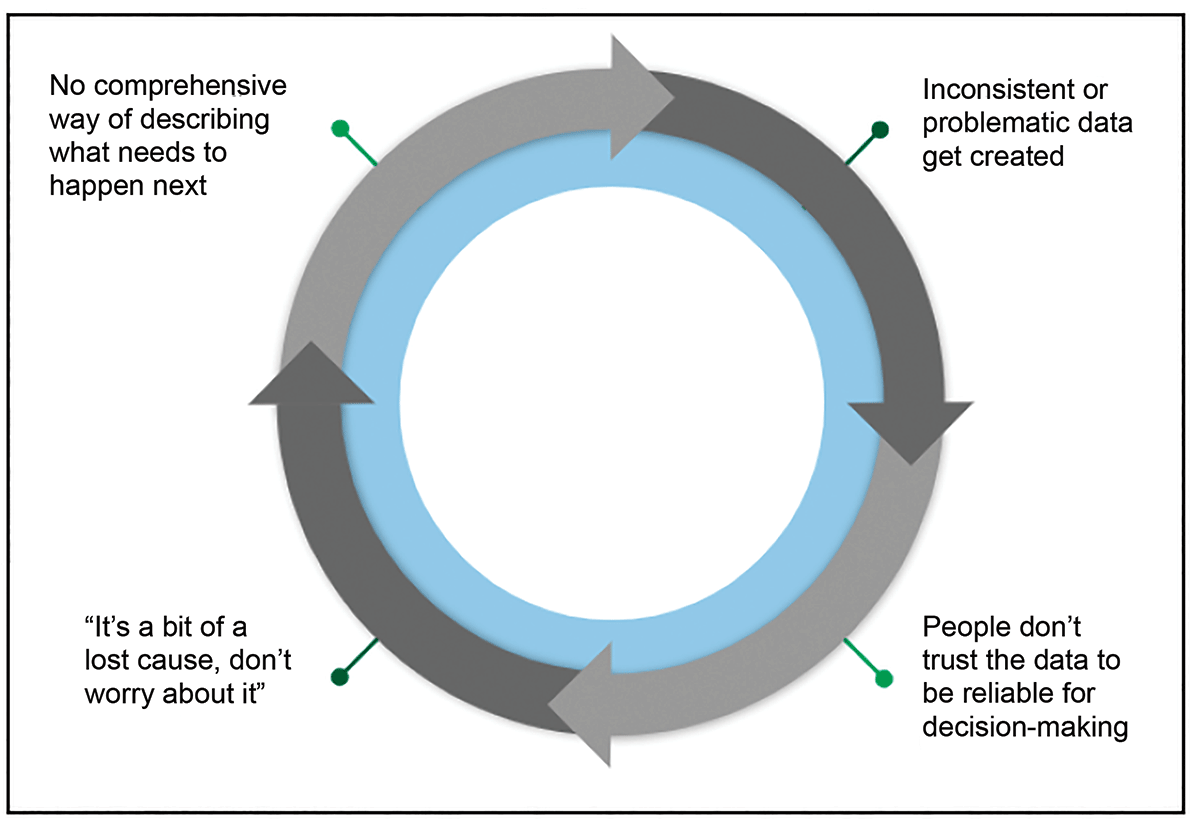
Figure 1. Data quality vicious cycle.
A vicious cycle, as defined by Oxford Languages, is “a sequence of reciprocal cause and effect in which two or more elements intensify and aggravate each other, leading inexorably to a worsening of the situation.” In the case of data trust, creating inconsistent or problematic data leads to mistrust, which leads to data disuse and disinterest in remediation, which leads to a lack of data-driven explanation of what has to happen next, which leads to the continued creation of inconsistent or problematic data.
Breaking this vicious cycle is a matter of great urgency. A raft of community health leaders, humanitarian experts, and data scientists have stated unequivocally that community health data are valuable, and that incorrect data have health consequences. A March 2019 statement from the United Nations Statistical Commission is a sobering example: “Every misclassified or unrecorded death is a lost opportunity to ensure other mothers and babies do not die in the same way. When it comes to health, better data can be a matter of life and death.”
A great deal of research on this topic focuses on delineating the problem and simply imploring practitioners to do better, but remarkably little research and development has focused on designing new tools and leveraging technological advances that might make it easier for health systems to establish data trust. There is a specific need for a unified methodology for assessing data quality and identifying IoP data in a comprehensive fashion—and for this work to come from trusted, sector-leading organizations. Solutions for IoP identification are critical to improving data trust by taking actions that encourage data remediation, behavior change, or improvement of tools used to collect data.
Colleagues at DataKind and Medic see identifying IoP and acting on that information as key to advancing healthcare research and corresponding policy. Therefore, this solution must be considered sustainable, accessible, and part of a well-maintained software infrastructure.
The Community Health Toolkit (CHT) is a collection of open source technologies, open access design and technical resources, and a community of practice focused on digital tools for community health. Medic is a steward of continuously undertaking research and design to improve the CHT with the aim of improving care in the hardest-to-reach communities. As an internationally recognized global good that is adaptable for various geographies and contexts, with a strong user community and demonstrated effectiveness, the CHT is well-positioned to house open source tools for identifying IoP.
Ongoing design research focuses on creating a digital public good for IoP identification. Achieving this end involves designing IoP within community health data and taking a platform-provider approach to identifying and contextualizing IoP through three examples. A proposed open source digital health toolkit can identify pathways for remediating IoP within community-collected data.
Design Context
This analysis focused on examining the eight most consistently used health forms and two metadata tables, representing a majority of the health encounters supported by a standard CHT application. (The forms are Family Surveys, Health Forums, Pregnancy Registrations, Pregnancy Visits, Pregnancy Referral Follow-Ups, Postnatal Care, Assessments, and Assessment Follow-Ups. A detailed description of how the forms are configured and used in CHT apps can be found in the CHT documentation).
Data used in this study were collected on the CHT platform as part of routine operations by BRAC, a nonprofit organization that operates nationally in Uganda. Spanning three years of collection, the data set contained more than 7.7 million health encounters recorded in eight health forms representing activities undertaken by 4,135 CHWs, and included a total of 787,580 individuals, and 394,917 households served. All data were stored in a relational database, and client data continue to be protected following Medic’s data security protocols.
Deidentified data were approved for secondary implementation research use and presentation in aggregate at a pan-deployment level. All schema-level IoP testing was configured in the CHT PostgreSQL database (Figure 2.) All data models were developed using Python.
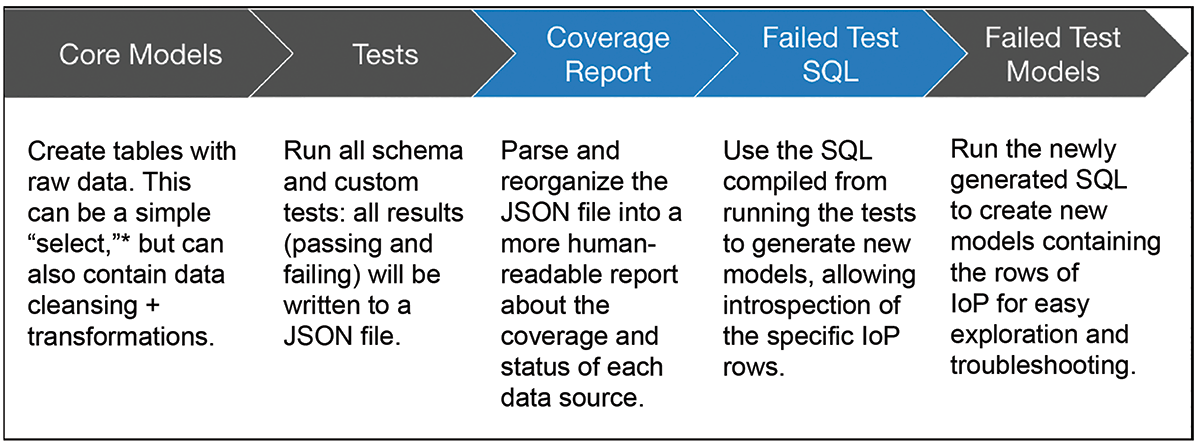
Figure 2. Visualization of core testing framework.
Defining Data Quality for Community-Collected Digital Health Data
This study defined data quality in three dimensions—completeness, accuracy, and timeliness—as adapted from definitional materials prepared by the National Institutes of Health (NIH) Collaboratory Phenotypes, Data Standards, and Data Quality Core.
Data completeness refers to the presence of the necessary data for monitoring or analysis and may be captured by the percent of missing values or percent of records for which all of the fields needed to calculate a metric are available.
Data accuracy is the degree to which a recorded value agrees with the true value attempted to be captured and may be assessed by the percentage of values known to be errors or the rate of implausible values.
Data consistency is the agreement among data from different sources, such as those from paper and digital records or those from the community and the hospital. Consistency is typically evaluated by comparing metrics calculated from different sources and quantifying the differences among them.
Data defined as “IoP” are identified as atypical in one or more of the dimensions of data quality and defined by the level at which the data quality issues arise. Inconsistent data often occur in the forms of outliers, missing values, and/or duplications that are isolated to a few records, while problematic data signal an inherent flaw in the data collected that hinders achieving insights about and taking action with the data.
When problematic data are identified, the usual result is a redesign of how data are collected or a training intervention with users to change behavior at the point of collection.
Problematic data differ from inconsistent data in their scale. Inconsistent data are measured by a few incorrect inputs; problematic data result from an entire field being miscalibrated and, therefore, unreliable for data analysis. For example, if a CHW mistypes today’s date when entering a pregnant patient’s birthdate, that value would be inconsistent; it would be outside the bounds of possibility that a patient at age 0 would be pregnant. However, if a CHW’s tablet is miscalibrated and defaults birthdate fields to “January 1, 1970” (a common computer default date), the wrong value is structural rather than isolated, and the entire birthdate field becomes unreliable for analysis.
There is a connection between inconsistent and problematic data. Uncovering inconsistencies in analyses often leads to identifying more structural data problems and patterns in application or platform design. Thus, tooling that allows for identifying and monitoring data can also be used for finding, prevention, or early warning of problematic data.
Identifying Areas for Potential Remediation
Working from a library of 160 tests for IoP data, pan-deployment thematic issues were identified that align with the three major domains of data quality. As expected, data from all eight health forms exhibited issues with accuracy, completeness, and timeliness.
While certain issues were identified that could have been recognized individually by casual reviewers (e.g., spelling errors, incorrect information being input into specific sections), some IoP findings were only readily identified by analyzing data across the platform. Specifically, this study looks at the distribution of diagnostic measures to identify anomalous records, the flow of encounters across multiple treatment steps, and the relative performance of health workers based on components of performance management.
Using statistical and data science approaches at a platform level makes it possible to identify inconsistent and problematic data that would be far less visible without such a holistic perspective. This level of analysis in turn makes it possible to improve data trust at a platform level, through actions such as data remediation, data collection process improvements, product improvements, and training activities.
Example 1: Miscalibrated Health Measurement Tools
Accuracy is a key dimension of data quality, and miscalibrated tools can produce inaccurate results, which lead to problematic data, even if the data collection process itself is completed successfully. CHWs have multiple measurement tools to support their daily activities that could include smartphones, thermometers, scales, timers, and stethoscopes; these tools produce measures that are key diagnostic indicators for patients. A miscalibrated measurement device could lead to a misdiagnosis and subsequent inaccurate treatment, which has the potential to cause negative health impacts or limit socio-economic opportunities due to misdiagnosis.
Part of the IoP assessment involved examining the median temperature readings recorded by CHWs during patient visits and found that a significant percentage of CHWs conduct regular healthcare assessments and record abnormally high or low median temperatures.
Normal, healthy human temperatures typically range from 36.8 to 38.0 degrees Celsius. While health workers may have higher average readings than a random sample (because they often see sick patients), temperatures greater than 40.2 or less than 34.6 are implausible. Aggregating to the CHW level allows for some extreme values for very sick patients, but will still capture systematically high or low readings for each thermometer.
The data showed only 60% of health workers had median readings between 36.8 and 38.0. Figure 3 suggests it is likely that some CHWs carry miscalibrated thermometers, a finding that is particularly salient given the need for regular temperature monitoring during the COVID-19 pandemic. In community-focused care, this analysis could prompt regular tool “trade-in” practices so CHWs are regularly provided with calibrated tools. It could also prompt training for CHWs to recognize abnormal tool readings and compare to other assessment points, and/or prompt a data collection intervention that might limit temperature input options.
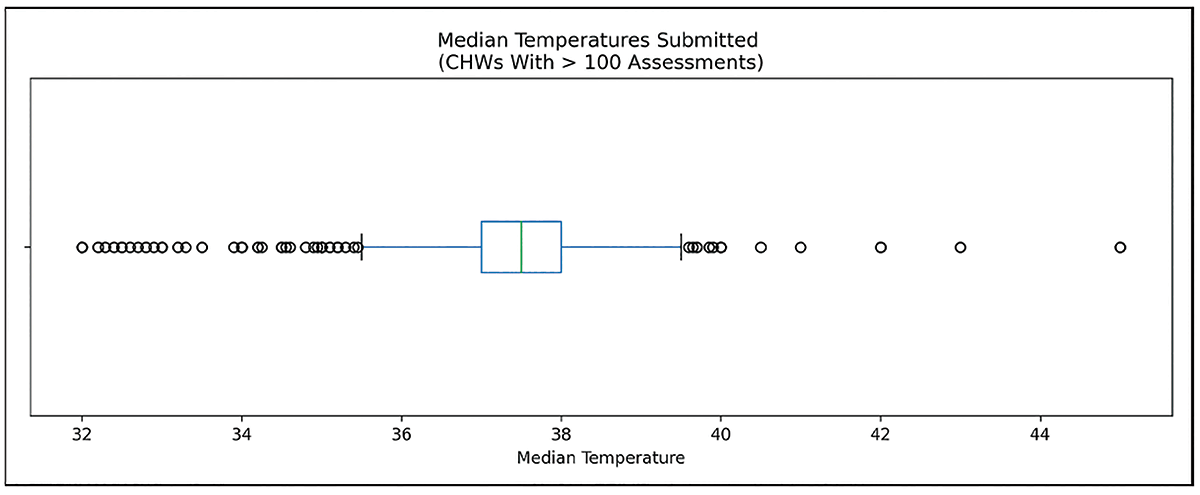
Figure 3. Temperature records submitted by CHWs with >100 temperature assessments. Human body temperature records would normally be expected to be distributed around 37 degrees C.
Example 2: Incomplete or Problematic Data for Complex, Multi-Step Care Pathways
This example uses Sankey charts to show the pattern of behavior of an individual or resource through expected checkpoints and identify IoP patterns that could encourage follow-up information collection and care activities. These diagrams are visualizations through connection points (nodes) with flows called links, and they show the relative volume (e.g., traffic, energy) flowing through nodes. They are particularly useful tools for demonstrating and interrogating complex relationships, such as multiple paths or many-to-many relationships. As a statistical tool, they demonstrate the relative size of a particular flow by a proportional arrow width and the structure of the confining system.
In community-focused care, this analysis can reveal points in the care cascade where patients drop out or are lost to follow-up. There are opportunities to use these findings to inform product improvements for digital tools aimed at addressing loss to follow-up. For example, an automated text message could be sent to remind patients to go to the facility for follow-up if they require a visit to a health facility but miss the initial follow-up window.
An example from maternal and child health demonstrates the value of using a Sankey diagram for analysis. Maternal and child health is a key focus of the United Nations’ Sustainable Development Goal 3: “Ensure healthy lives and promote well-being for all at all ages and initiatives across global health are focused on ensuring appropriate prenatal, birth, and postnatal care.”
One area of key community health treatment is managing antenatal care for facility-based childbirth. Incomplete and delayed data can contribute to higher risks of death or complications with childbirth, a lack of available or prepared health facilities for births, delayed or missing postnatal care, and other issues. Figure 4 shows an example of a patient care journey from initial pregnancy diagnosis through birth outcome.
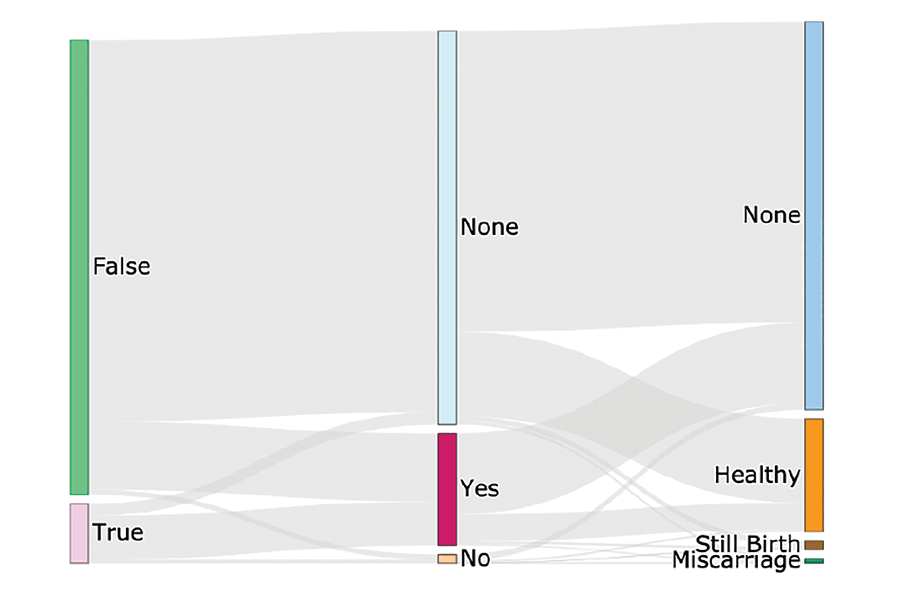
Figure 4. Sankey diagram of health outcomes for the provided antenatal care example.
Starting at the leftmost node, it shows that patients are either diagnosed as pregnant and recommended for follow-up prenatal care (True) or not (False). Moving to the middle node, there is no information about follow-up visits recorded for a majority of patients. This outcome would be expected for those not recommended for follow-up care, but there are no data for some recommended for care, and nearly 7,000 patients recommended for follow-up care do not receive it (a distinct record from “none”). Flowing to the final (rightmost) node for birth outcome, a large portion of patients (75%) who received prenatal care have no birth outcome data recorded, while healthy birth outcomes are recorded for a number who had no documented prenatal care.
To a degree, these data surely reflect some real gaps in access to care; the data also probably reflect gaps in knowing about what care CHWs and nearby clinics actually provided.
The key interpretation of this example is that missing data were identified, as well as data that ran counter to expectations of birth outcomes, both of which are IoP that warrant further investigation and potential action, such as using deductive imputation to record birth outcomes after a later post-natal care encounter.
Example 3: Use of Digital Tools Among CHWs, Leading to Cluster-Specific Data Quality Issues
Among industries, segmentation has been a clear way to identify, track, and manage worker performance. CHWs are often not specialized, similar counts and types of care encounters, diagnoses, and referrals among CHWs working in similar communities could be anticipated; in other words, similar timeliness and consistency of data would be expected.
However, anecdotal data show that care delivery varies by CHW, and distinct patterns, or archetypes, of care delivery could be anticipated that could be indicators of (or indicated by) IoP.
The K-means clustering technique can be used to understand this potential segmentation. K-means clustering is an approach that seeks to use a data set’s own properties to determine specific groups, or clusters, of data points. This technique is executed by choosing the number of clusters (represented by the “K” in K-means). The algorithm determines the center of each cluster (a “centroid”) so it is equal to the arithmetic mean of each of the points belonging to that cluster, and each point in a cluster is closer to its own centroid than another cluster’s centroid.
This study identified four distinct CHW profiles. Four clusters was the optimal grouping because they (K = 4) created a minimal distance score between cluster centers and associated data points without complicating interpretability.
These four clusters are divided primarily into two principal components (representing 65% of the variance between clusters) and cluster based on activity performance, and provide indications of how CHWs perform task completion. These four clusters are separated as shown in Figure 5:
- • Cluster 0: Submits fewer forms than expected per active day.
- • Cluster 1: Serves a high ratio of patients with fever, coughs, and diarrhea (i.e., seems to visit sick patients); often marks patients as exhibiting danger signs.
- • Cluster 2: Submits an expected number of care assessments and submits fewer pregnancy forms than other clusters.
- • Cluster 3: The most-active CHWs, in terms of both number of days active and forms submitted per day— works more days than expected and submits more care information per day worked.
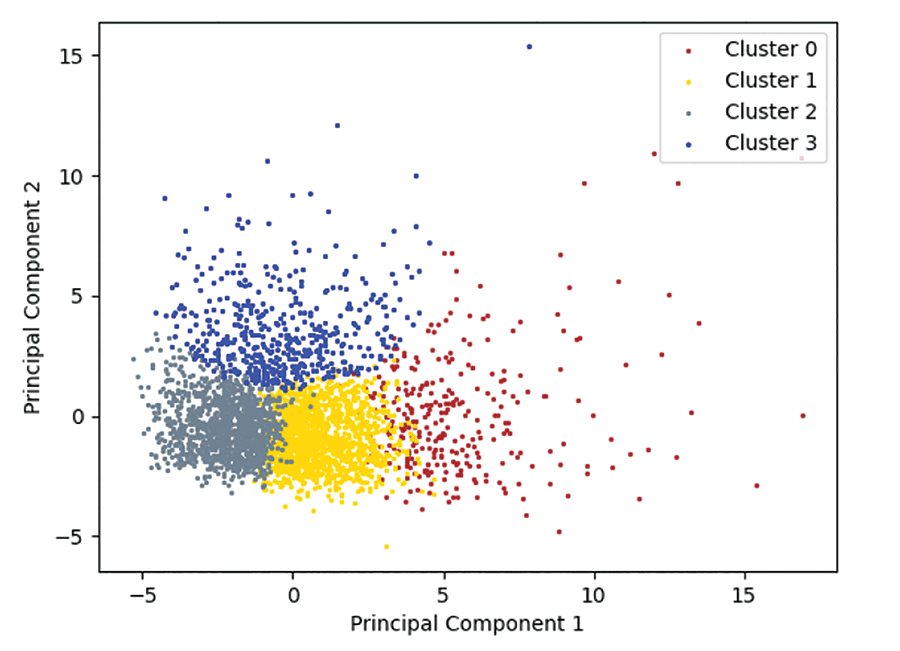
Figure 5. K-means clusters based on CHW activity patterns.
This type of analysis may help with identifying IoP data by, for example, driving health systems to understand whether health workers like those in Cluster 0 serve different populations (smaller or with fewer health issues) or do not have what they need (pay, time, equipment, or safety) to meet the health needs of their communities. In the first case, there are no IoP data problems; however, in the second, the health system is missing key information about the health of the communities served.
These types of findings can be used to provide specific training, instruction, or similar coaching to adjust CHW activity patterns and encourage accurate and timely task completion. CHW supervisors can use such findings to target particular subsets of the CHW cadre for additional training and support to resolve issues of missing information (missingness) in data collected.
Discussion
For community-based care providers, the ability to target treatments has the potential to be transformative, particularly in contexts with fragmented connections to more-formal sites of care.
However, predictive algorithms for care delivery are unlikely to succeed if the underlying data are inconsistent or problematic. In other contexts, there have been inconvenient, disheartening, and devastating health outcomes of deploying algorithms based on weak data. If the underlying data are of acceptable quality, but assumed to be IoP, and thus not trusted, that is equally problematic for the successful implementation of precision public health, because data-driven care recommendations will not be based on a foundation of data trust.
Two recommendations build on the results of this exploratory study: 1) Create a software toolkit for IoP identification and remediation at a platform level; and 2) ensure that IoP tools and guidance are modular and adaptable so they can be deployed in diverse digital health ecosystems around the world.
Creating a Platform-Level Software Toolkit for IoP Identification
This study demonstrated the importance of identifying IoP data in community health and clearly shows that IoP could be identified at a platform level, and that the IoP identification could be used for remediation, with remediation as an area of clear importance for disrupting the data quality vicious cycle.
It bears mentioning that most community health programs still use paper-based information systems, and that data quality issues may be far worse in paper systems than digital ones. For example, in a prior analysis, Medic found that the average mean percentage of monthly care encounters with key missing data was 37.2% in a health system that relied on paper-based data collection. This number fell to 2.9% in the 16 months after adopting a CHT app (data available from the authors upon request). Platform-level analysis of granular digital data allows for deeper scrutiny of IoP issues; software systems also have processes that greatly streamline the pathway to remediation.
A key in the pathway to data trust is the basic reproducibility of this approach. Most health systems in lower-income settings analyze data quality through processes that involve a host of access and aggregation steps, and rely heavily on case-by-case judgment of data analysts—a process that is less reproducible as a whole. By contrast, this approach relied on creating more than 160 statistical and performance tests, and software designed to automate much of the process of running these tests.
The reproducibility of the approach has a range of benefits, including greater ability to operationalize the results of this testing process to add value to CHWs and their patients.
A platform-level IoP toolkit also can be expanded in three ways. First, this study focused on maternal, newborn, and child health data, which are among the most-common kinds of data generated by CHT apps. Future studies should be expanded to additional workflows supported by CHT apps, including infectious and non-communicable diseases, referral and prescribing systems, and workforce management data, where a broader range of IoP might be identified and addressed.
Data visualizations and real-time dashboards should be incorporated into the software, not only used as a post-hoc analysis for research purposes. These tools would allow community health teams to monitor changes in IoP over time and drive practical, thoughtful conversations about IoP remediation. Rather than the common practice of investigation or remediation happening on an individual case basis, these tools would allow users to monitor and investigate problems in many locations and times using visualizations and statistical techniques that would flag anomalies and deviations from anticipated values.
An IoP toolkit should include software improvements that center on data trust. Rather than waiting for IoP testing at a database level to identify potential issues, additional rules can be built into select health forms deployed on the CHT that would not capture specific problematic data (e.g., not recording more live births than children actually born).
All three of these recommendations would help grow the utility of a platform-level data trust toolkit.
Designing Modular, Open Tools to Streamline the Process of Scaling Up
A shift from analysis to remediation of IoP data is an important opportunity for future work, and it is deeply important to approach this shift in a human-centered manner. While the first IoP example focuses on the performance of CHW equipment, the second and third examples speak in complex ways to the available data and to the activities and performance of health workers.
Practically speaking, systems designed to increase data trust might reveal that some health workers are inactive or underperforming in specific, recurring ways. In an institutional context, actions taken to address such issues could have consequences for their employment and social standing among their peers. These actions might also result in pushback from health workers, and have the unintended consequence of reducing trust in or enthusiasm for the use of data and technology in health care.
To create a cultural shift in data trust in a politically aware manner, health systems should provide ongoing training and support focused on data quality. It is important for these sessions to target not only frontline health workers, but also the supervisors, data analysts, and health systems managers who may play important roles in IoP data remediation. Through data trust training sessions, CHWs and other stakeholders would have the opportunity to discuss the impact of data quality, along with the tools used to identify and address IoP.
A truly human-centered training approach would support CHWs in championing good data practices and increase data trust among their peers, rather than viewing greater managerial control as the only means of improving CHW performance.
In considering the pathway to scaling for data trust, it is also important to remember that findings related to IoP data in one digital health system may have implications for other systems. For example, if a community health information system supports interoperability or routine data exchange with a hospital medical records system, conversations about IoP data at the community level could raise unanticipated questions about data quality and use in the hospital setting.
Health systems often generate similar data from different sources, such as data about immunization rates or antenatal care completion based on community outreach vs. aggregation of records from clinics and hospitals. If disparate systems present divergent numbers, or one system begins to scrutinize IoP in a way that might change such numbers, the path to data trust in one system could have consequences for the perception of data trustworthiness in another. That creates a need to design data quality tools in a way that streamlines adoption within a digital health ecosystem as a whole and pays attention to the political realities of implementation.
The Digital Public Goods Alliance defines digital public goods as “open source software, open data, open AI models, open standards, and open content that adhere to privacy and other applicable laws and best practices, do no harm, and help attain the Sustainable Development Goals.” Endorsed by the UN Secretary-General’s Roadmap for Digital Cooperation, the public good vision includes a premise that such tools can support a more-thriving digital health ecosystem, with greater local ownership, reduced vendor lock-in, and an increased pace of innovation.
This study designed data quality tools that might be deployed as “baked into” the CHT. The CHT is recognized as a public good, which gives this work a clear path to scale and sustainability.
Medic and DataKind see an opportunity to deploy this approach, the library of data quality tests, and perhaps even the same tooling for automating testing with other public goods. To do so, the toolkit must be sufficiently modular and adaptable for use with different kinds of data sets and a range of software architectures.
This work builds on and contributes to a growing movement to monitor data quality—a movement that spans industries and is supported by open source tools such as Great Expectations, dbt, and Frictionless Data, and the communities that have developed around these tools. If successful, demonstrating the utility of the data quality toolkit with other public goods could streamline the process of integrating it into the digital health ecosystem and ultimately transforming the norms and practices to advance data quality and increased data trust.
Conclusions
Precision public health needs a foundation of data quality to be done responsibly. This study has identified apparent systemic data quality issues in routine data and highlights areas where data trust can be improved. These select results start to fill the frontline health sector’s demand for precise information about data quality issues. Unique among data quality initiatives in global health, the study demonstrated the feasibility of a reproducible, platform-level approach that uses a range of data science techniques to test for and remediate inconsistent or problematic data.
This approach raises the bar for data quality review and remediation in the public health sector. With the demonstration of successful IoP identification at a platform scale comes a call to action: committing to building health initiatives involving predictive algorithms and other novel approaches to data-driven care on a strong foundation of systematically tested and trustworthy data. Such a commitment opens up exciting new avenues for research and development, while affirming the duty of care that will surely prove essential if statistics, data science, and AI are to advance progress toward sustainable development goals.
Further Reading
Birnbaum, B.E., DeRenzi, B., Flaxman, A., and Lesh, N. 2012. Automated quality control for mobile data collection. ACM DEV 12.
Buehler, B., Ruggiero, R., and Mehta, K. 2013. Empowering Community Health Workers with Technology Solutions. IEEE Technology and Society Magazine 32(1), 44–52.
Frontline Health Workers Coalition. 2016. Prioritizing Community Health Worker Data for Informed Decision-Making.
Holeman, Isaac, and Kane, Dianna. 2020. Human-centered design for global health equity. Information technology for development 26.3: 477–505.
Ismail, Azra, and Kumar, Neha. 2021. AI in Global Health: The View from the Front Lines. Proceedings of the 2021 CHI Conference on Human Factors in Computing Systems: 1–21.M
Regeru, Regeru Njoroge, Chikaphupha, Kingsley, Kumar, Meghan, Bruce, Otiso, Lilian, and Taegtmeyer, Miriam. 2020. “Do you trust those data?”—a mixed-methods study assessing the quality of data reported by community health workers in Kenya and Malawi. Health Policy and Planning 35(3):334–345.
Verdezoto, Nervo, Bagalkot, Naveen, Akbar, Syeda Zainab, Sharma, Swati, Mackintosh, Nicola, Harrington, Deirdre, Griffiths, Paula. 2021. The Invisible Work of Maintenance in Community Health. Proceedings of the ACM on Human-Computer Interaction 5:CSCW 1:1–31.
Zozus, Meredith N., Hammond, W. Ed, Green MD, Beverly B., Kahn MD, Michael G., Richesson, Rachel L., Rusincovitch, Shelley A., Simon MD, Gregory E., Smerek, Michelle M. 2014. Collaboratory Phenotypes, Data Standards, and Data Quality Core. Assessing Data Quality for Healthcare Systems Data Used in Clinical Research.
About the Authors
Caitlin Augustin is responsible for delivering DataKind’s core offerings, ensuring that high-quality, effective data science interventions are created in partnership with social sector leaders. Before joining DataKind, she was a research scientist at a digital education company and an engineering professor at New York University. She is engaged with Central Florida’s nonprofit community and the organizer of the Orlando Lady Developers Meetup. Augustin holds a BSIE and a PhD from the University of Miami.
Isaac Holeman co-founded the nonprofit organization Medic to build open source software for health workers in hard-to-reach communities; today, Medic serves as the technical steward of the Community Health Toolkit open source project. Holeman leads Medic’s research efforts as their Chief Research Officer. As a multi-disciplinary researcher-practitioner, his expertise is in human-centered design and implementation research, health equity, doorstep care, and new models of precision global health. With support from a Gates Cambridge Scholarship, Holeman completed PhD studies focused on global health and human-centered design.
Phil Azar is a data scientist who believes statistics should be simplified and analytics be accessible. Before DataKind, he worked as a data scientist for a large retailer, research analyst for a media company, and math teacher. A lifelong learner, he keeps up with the latest in machine learning, data science, and civic tech.
Mitali Ayyangar has been working in humanitarian and international development for over a decade. She brings expertise in community engagement, program operations, and shared learning to DataKind and serves as the lead on its portfolio of projects in community health work. Before joining DataKind, she was a program manager for community-based health and disease surveillance with Médecins Sans Frontières in Sierra Leone, Ethiopia, and South Sudan.
Helen Olsen is senior manager of monitoring and evaluation (M&E) and leader of Medic’s Responsible Data portfolio. Before joining Medic, Olsen was an associate program officer in the global health division of the Bill & Melinda Gates Foundation and a project officer on the Global Burden of Disease Study of the Institute for Health Metrics & Evaluation. She is a National Science Foundation Graduate Research Fellow and has an MA in geography from Rutgers University and a BA in geography and public health from the University of Washington.
Erika Salomon is a data scientist focused on empowering social good organizations to operationalize data in low-resource settings. Salamon has a PhD in social psychology from the University of Illinois and 10+ years of experience in conducting research and applying models in public sector, nonprofit, academic, and applied settings, including public health, criminal justice, and education.


