
OutSMARTing Superbugs
When a 43-year-old woman (Patient 0) was transferred to the National Institutes of Health (NIH) Clinical Center in Bethesda, MD, from a New York hospital in June of 2011, after developing complications from a lung transplant, there was a more-serious concern: She was colonized with Klebsiella pneumoniae carbapenemase (KPC), a dangerous strain of bacteria. Klebsiella species commonly reside in the human gastrointestinal tract and pose little threat in cases of an infection, given currently available antibiotics, but this particular strain was immune to all of the common antibiotics—even those typically used as a last resort to treat the most-serious infections.
Transferring Patient 0 to the NIH Clinical Center was a strategic decision. At the NIH Clinical Center, known as “America’s research hospital,” laboratory discoveries are translated into treatments to improve the nation’s health. At any one point in time, about 1,600 clinical research studies are underway at the NIH Clinical Center.
When Patient 0 arrived at the NIH Clinical Center, the staff was aware of her KPC infection. They implemented enhanced contact isolation measures to prevent the spread of the bacteria. After 24 hours in the intensive care unit (ICU), she was placed in the isolation unit, gloves and gowns were required for anyone entering her room, and all equipment was diligently sterilized. These precautions seemed to pay off…for a while.
Despite the strict adherence to the contact isolation protocol, cultures collected in August 2011 from a 34-year-old male patient confirmed a second case of KPC colonization at the NIH Clinical Center. On August 15, another case was discovered. On August 23, another. On August 29, yet another. Although Patient 0 survived, each of these last four patients died. Experts at the NIH Clinical Center were scrambling for answers. They could not treat the infections effectively and they did not know how it was spreading.
With further implementation of strict contact isolation measures and exhaustive cleaning and sterilization of equipment, the outbreak was finally contained by the end of 2011, but not before 18 cases had been identified, with 11 of those patients dying—despite the NIH Clinical Center being one of the most uniquely prepared and resourced centers to prevent and confront such outbreaks. But outbreaks of such infections can occur anywhere and anytime.
Antibiotics
Roughly 50% of deaths in 1900 in the United States were attributed to infectious diseases. Today, it is closer to 5%. In large part, this is due to the introduction of antibiotics, one of the most-significant medical achievements of the 20th century. The mortality rate for bacterial endocarditis, an infection of the inner lining of the heart, was about 100% before antibiotics, and 25% after the introduction of antibiotics. The mortality rate for bacterial meningitis—inflammation of the protective membranes covering the brain and spinal cord caused by bacteria—was greater than 80% before antibiotics, and less than 20% after the introduction of antibiotics.
Antibiotic Resistance
Antibiotic resistance is an evolution at the micro-organism level. With widespread use of antibiotics, bacteria are forced to change genetically to survive. This leads to resistant strains of bacteria. Antibiotic resistance happens in four steps: (i) There are a lot of germs in nature, a few of which are drug-resistant; (ii) antibiotics are applied that kill bacteria causing the illness but also other bacteria that protect the body from infection; (iii) given reduced competition with other germs killed by the antibiotics, the drug-resistant bacteria grow and take over; and (iv) some bacteria give their drug-resistance to other bacteria, creating additional problems.
Superbugs
Superbugs are bacteria that have become resistant to even the most-powerful antibiotics. They are now one of the world’s most-serious health threats. Carbapenem-resistant Enterobacteriaceae (CRE), which invaded the NIH Clinical Center, are one form of superbug, but there are many types. The Centers for Disease Control and Prevention (CDC) recently completed an assessment of antibiotic resistance threats (Table 1) that categorizes pathogens into hazard levels.
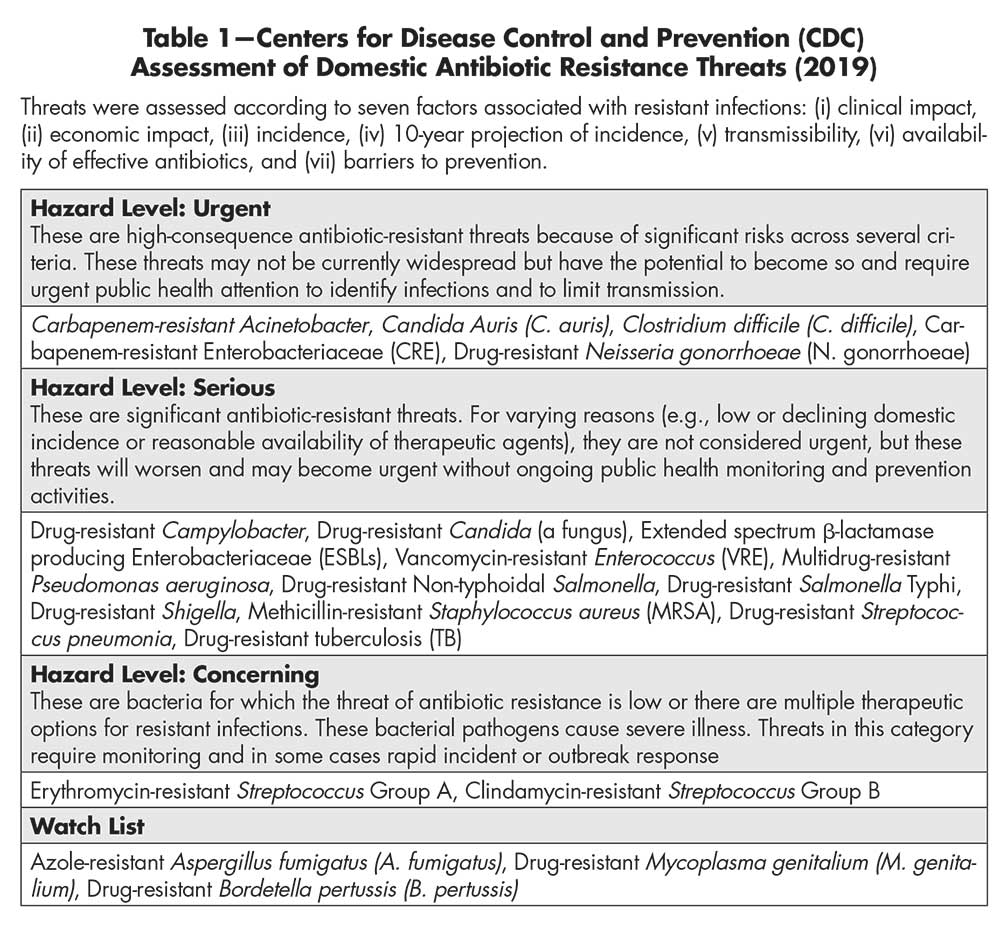
Table 1—Centers for Disease Control and Prevention (CDC) Assessment of Domestic Antibiotic Resistance Threats (2019)
Superbug outbreaks are becoming a regular part of the news cycle. According to the CDC, in the United States, more than 2.8 million people acquire serious bacterial infections that are resistant to antibiotics designed to treat those infections, with at least 35,000 dying as a result. In the European Union, about 33,000 people die from these infections annually. According to the Interagency Coordination Group on Ant microbial Resistance (IACG), drug-resistant diseases already cause at least 700,000 deaths globally per year.
In addition to undermining our ability to fight infectious diseases, antibiotic resistance threatens the safety and effectiveness of many medical procedures that rely on having effective antibiotics, such as chemotherapy for cancer, dialysis for renal failure, neonatal care, ICU care, and surgeries such as organ transplantation.
Treating Bacterial Infections
The treatment of bacterial infections is not based on a single decision. Rather, it is dynamic: based on a sequence of decisions, with adjustments of therapy made over time. Adjustments are personalized: tailored to individual patients as new information about those patients become available. There are two major decision points regarding treatment selection: empiric and definitive therapies.
Clinicians select empiric therapy based on their best judgment, given the often-limited information that is immediately available upon recognition of the clinical syndrome. Definitive therapy is selected once the organism identification, antibiotic susceptibility testing (AST) results, tolerability, and clinical course of the patient are known, frequently occurring 48 to 72 hours after AST has been ordered.
Traditional antibiotic trials often compare drugs or drug combinations for definitive therapy when drug susceptibilities are known. In the face of unknown information, like AST results, clinicians would benefit from understanding which strategy or sequence of decisions—based on up-to-date information at each step of the way—would optimize patient outcome and experience. Our trial design framework would provide better information for decision-making in clinical practice.
COMPASS and SMART COMPASS
COMparing Personalized Antibiotic StrategieS (COMPASS) is a trial design that compares strategies consistent with clinical practice. Strategies are decision rules that guide empiric- and definitive-therapy decisions.
There is a distinction between a strategy and the treatment(s) received. Patients on the same strategy can receive different treatments, due to different short-term responses or AST results. The short-term response or the AST acts as the tailoring criterion for directing patient treatment at the definitive stage. The tailoring criterion could incorporate a short-term clinical response—for example, toxicity, which may require a change in therapy.
For treating serious bacterial infections, when there are multiple empiric-therapy and definitive-therapy options, a Sequential Multiple Assignment Randomized Trials for COMparing Personalized Antibiotic StrategieS (SMART COMPASS) provides a way to evaluate the options. Sequential randomization provides the opportunity to create new strategies, which differ with respect to definitive therapy selection, and compare them in a randomized setting. Trial participants requiring therapy adjustment at the definitive-therapy stage based on the tailoring criterion can be re-randomized to the definitive-therapy options to determine the optimal adjustment path and overall strategy.
To illustrate the key features of a SMART COMPASS design, consider the example in Figure 1. Eligible trial participants include those with an infection at or in a specific body site, such as the bloodstream or urinary tract. Suppose that patients are initially randomized to one of the two empiric treatments: E1 or E2. The short-term response, or AST result, then acts as the tailoring criterion for directing further treatment at the definitive stage.
If a patient is randomized to E1 at the empiric stage and is responding well, or the AST result indicates susceptibility to E1 (+), then the patient will remain on E1 (path (a)). Otherwise, the patient will be re-randomized to D1 or D2 at the definitive stage (path (b) or (c)). If a patient is randomized to E2 at the empiric stage and is responding well, or the AST result indicates susceptibility to E2 (+), the patient will remain on E2 at the definitive stage (path (d)). Otherwise, the patient will be re-randomized to D3 or D4 at the definitive stage (path (e) or (f)).
With this design, four treatment strategies (S1–S4 denoted sequentially in yellow in panels A–D of Figure 1) are embedded in this SMART COMPASS.
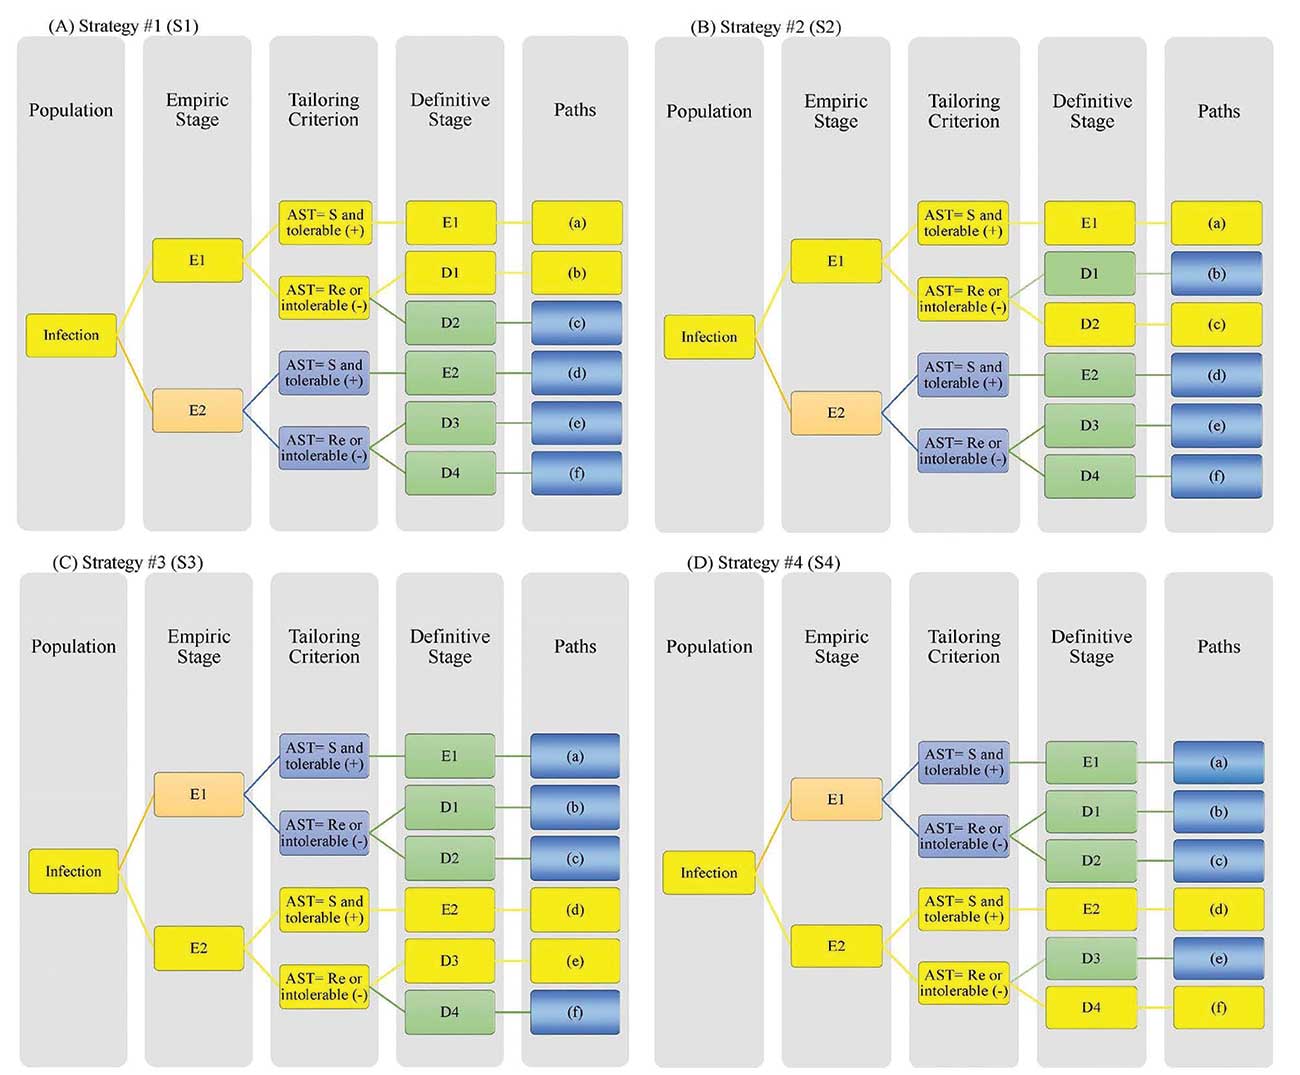
Figure 1. Schema of a SMART COMPASS comparing four strategies (S1–S4). Each panel highlights a distinct strategy in yellow. (A) In S1 (paths (a) and (b)), the patient receives empiric therapy E1. For definitive therapy, if AST indicates Re or E1 is not tolerated (-), then the patient receives D1 (path (b)). Otherwise, the patient remains on E1 (path (a)). (B) In S2 (paths (a) and (c)), the patient receives empiric therapy E1. For definitive therapy, if AST indicates Re or E1 is not tolerated (-), then the patient receives D2 (path (c)).Otherwise, the patient receives definitive therapy E1 (path (a)). (C) In S3 (paths (d) and (e)), the patient receives empiric therapy E2. For definitive therapy, if AST indicates Re or E2 is not tolerated (-), then the patient receives D3 (path (e)). Otherwise, the patient receives E2 (path (d)). (D) In S4 (paths (d) and (f)), the patient receives empiric therapy E2. For definitive therapy, if AST indicates Re or E2 is not tolerated (-), then patient receives D4 (path (f)). Otherwise, the patient receives E2 (path (d)). Abbreviations: AST=antibiotic susceptibility testing; S=susceptibility to empiric therapy; Re=resistance to empiric therapy.
Research Questions that Can Be Addressed with SMART COMPASS
SMART COMPASS can be used to evaluate multiple research questions (Table 2). Figure 1 provides illustration.
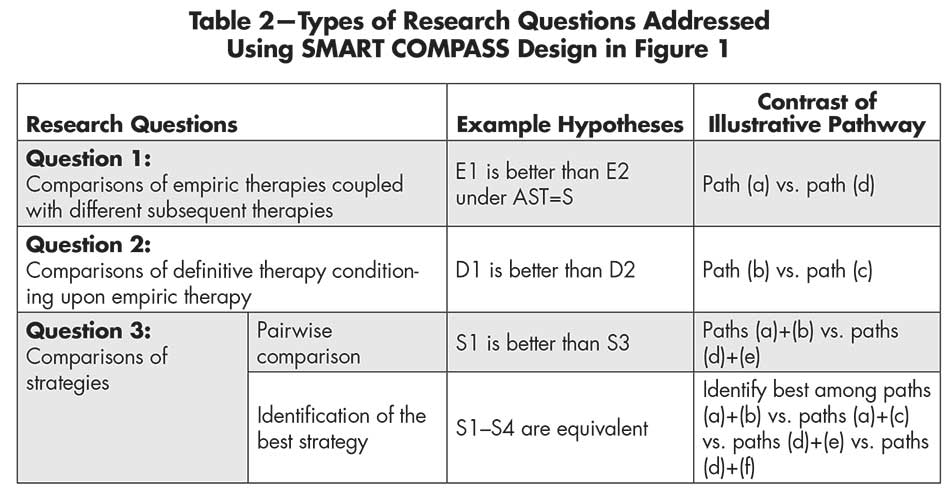
Table 2—Types of Research Questions Addressed Using SMART COMPASS Design in Figure 1
One research question is how empiric therapies compare when coupled with different subsequent therapies. Note that definitive-therapy options for patients on empiric therapies E1 and E2 may be similar or dissimilar. The empiric therapies can be compared unconditionally by averaging over subsequence definitive therapy (paths (a)+(b)+(c) versus paths (d)+(e)+(f)).
A second research question is what definitive therapy should be used for those who have a particular response to a given initial empiric therapy. Consider patients who start with E1 but for whom it is discovered that E1 is a bad choice (the bacteria is resistant to E1, or they cannot tolerate E1). This is a well-defined group of patients, and a clinician must make a decision about what to do with this new information. Within SMART COMPASS, whether definitive therapy D1 or D2 should be used can be evaluated by comparing paths (b) and (c).
Last but most importantly, there is probably interest in identifying the best strategy. Each of the four strategies in Figure 1 could be compared in a pairwise manner (six possible comparisons: S1 versus S2, S1 versus S3, S1 versus S4, S2 versus S4, and S3 versus S4). To identify which of the four strategies results in the best outcome requires implementing an analysis that would compare all four strategies.
Statistical Inference for Strategy Comparisons
Consider the design from Figure 1. Sequential randomization provides efficiencies compared to a traditional, four-arm, randomized trial, where each trial participant is randomized exactly once to one of the four strategies at the start of the trial. The efficiency stems from the fact that data from individual patients can contribute to evaluating multiple strategies.
For example, any patient receiving E1 throughout (path a) contributes to both S1 and S2. However, sharing participants adds complexity for estimating the mean response and associated standard error for a strategy.
The procedure can be illustrated by comparing S1 and S3. Consider a clinical trial with a continuous primary endpoint and a common known variance σ 2 among strategies. A total of n participants are randomized at the empiric stage, and they might be re-randomized at the definitive stage, depending on their short-term responses or AST results. Different paths will collect varied numbers of participants, leading to unequal contributions to the different paths ((a)–(f)). Paths (a) and (b) in the S1 panel could simply be used directly, but this is inefficient because it does not use those patients in S2 who had the path (a) and can contribute to the estimations associated with S1. To obtain an unbiased estimate of the overall response for the S1 using the path (a) information from S2, the observations must be weighted.
For simplicity, suppose that randomization ratio is 1:1 at both the empiric and definitive stages. Further, assume π1 (or π2) is a known rate of participants who have a good response or whose AST result indicates susceptibility to E1 (or E2), and are thus not re-randomized at the definitive stage.
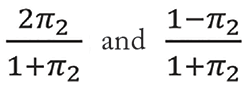
These two response rates are generally unknown. There are
![]()
and
![]()
participants relocated to paths (a), (b), (d), and (e), respectively. Then, paths (a) and (b) should be weighted with
![]()
in S1 and paths (d) and (e) with
![]()
in S3, respectively. Figure 2 illustrates such a sample size allocation procedure.
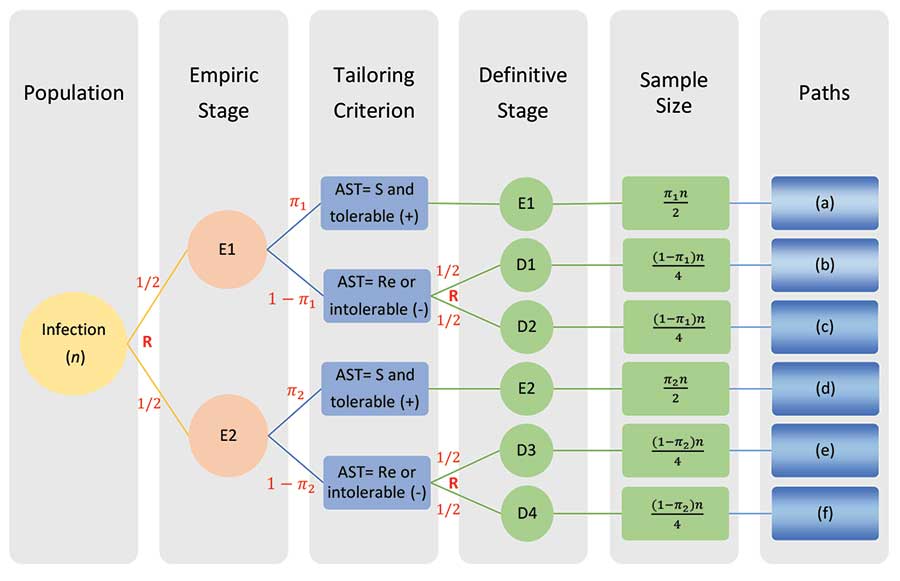
Figure 2. The sample size allocation procedure in SMART COMPASS trial in Figure 1.
Abbreviations: AST=antibiotic Susceptibility Testing; S=susceptibility; Re=resistance; R=randomization.
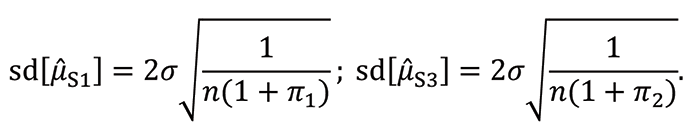
μ̂S1 can be calculated as an estimate of the mean of S1 by combining the means of paths (a) and (b) with weights
![]()
The means of paths (a) and (b) with weights
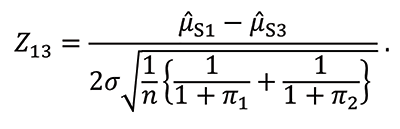
are also used to calculate μ̂S3 as an estimate of the mean of S3. Their standard deviations are:
To test for the mean difference between S1 and S3, form the test statistic Z13, which is approximately normally distributed for large samples:
If a trial is designed to evaluate the mean difference between S1 and S3, the sample size n required to achieve the desired power 1-β at the significance level of α for one-sided test is calculated by:
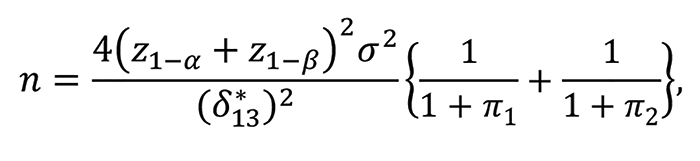
where z1-α and z1-α are the 100(1-α)th and 100(1-β)th percentiles of the standardized normal distribution, respectively, and δ*13 is the clinically meaningful difference in means between S1 and S3.
If it is desirable to identify the best strategy, then a procedure is needed to control for family-wise error rate (FWER) associated with multiple testing. Figure 3 illustrates sequential testing procedure for the SMART COMPASS design in Figure 1. The procedure begins by ordering the estimated mean values μ̂S(1), μ̂S(2), μ̂S(3), and μ̂S(4), where μ̂S(4) < μ̂S(3) < μ̂S(2) < μ̂S(1).
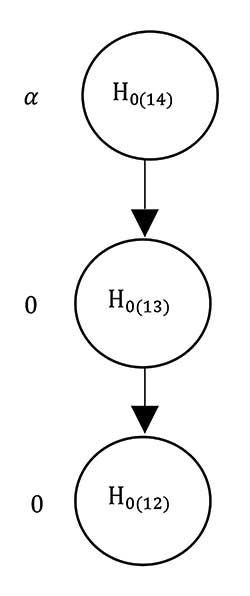
Figure 3. Graphical display of the multiple testing procedure for the SMART COMPASS trial in Figure 1. Start by ordering the mean values μ̂S(1), μ̂S(2), μ̂S(3), and μ̂S(4), where μ̂S(4) < μ̂S(3) < μ̂S(2) < μ̂S(1). The associated three null hypotheses are H0(14), H0(13), and H0(12) for the comparisons of S(1) with S(4), S(3), and S(2), respectively. The order in which hypotheses are tested is H0(14) → H0(13) → H0(12). Each test is carried out at the significance level of α as long as significant results are observed in all preceding tests.
There are three null hypotheses—H0(14), H0(13), and H0(12)—for the comparisons of S(1) with S(4), S(3), and S(2), respectively. The order for testing hypotheses is H0(14) → H0(13) → H0(12).
Each test is carried out at the significance level of α as long as significant results are observed in all preceding tests. When designing a trial to identify the best strategy with this procedure, the most-convenient approach for sample size determination is the maximum value of sample sizes calculated for each pairwise comparison of strategies.
Example: Management of Bloodstream Infections
Bloodstream infections, often arising secondarily to localized infections at specific body sites, are a major cause of morbidity and mortality, occurring in approximately 5% of all patients admitted to ICUs, where the case-fatality rate associated with bloodstream infections reaches 35 to 50%.
One potential etiology of bloodstream infections is Staphylococcus aureus (S. aureus), a common bacterium that spreads in healthcare facilities and the community. Some forms of S. aureus—for example, methicillin-resistant S. aureus (MRSA)—can cause difficult-to-treat staph infections because of resistance to common antibiotics. MRSA has emerged as one of the most-common hospital-acquired pathogens. In the United States in 2017, there were an estimated 323,700 cases in hospitalized patients and 10,600 deaths.
S. aureus bloodstream infection does not have a defined, optimal treatment strategy. Current standard-of-care treatment for S. aureus bloodstream infections involves extended durations of potentially toxic antibiotics, long-term intravenous access, and blood draws for drug monitoring.
When treating patients with complicated S. aureus bloodstream infections, an important clinical question is identification of the best management strategy for the completion of therapy. Options include continuing, switching, or intensifying initial therapy, depending on the clinical response. SMART COMPASS could be used to evaluate strategies (Figure 4). Trial participants with the presence of MRSA in the blood would be randomized to vancomycin or daptomycin, two powerful antibiotics used to treat serious infections such as those caused by MRSA when other antibiotics may not work, for initial therapy. Follow-up cultures would be obtained, per the standard of care, to determine whether MRSA presents in blood.
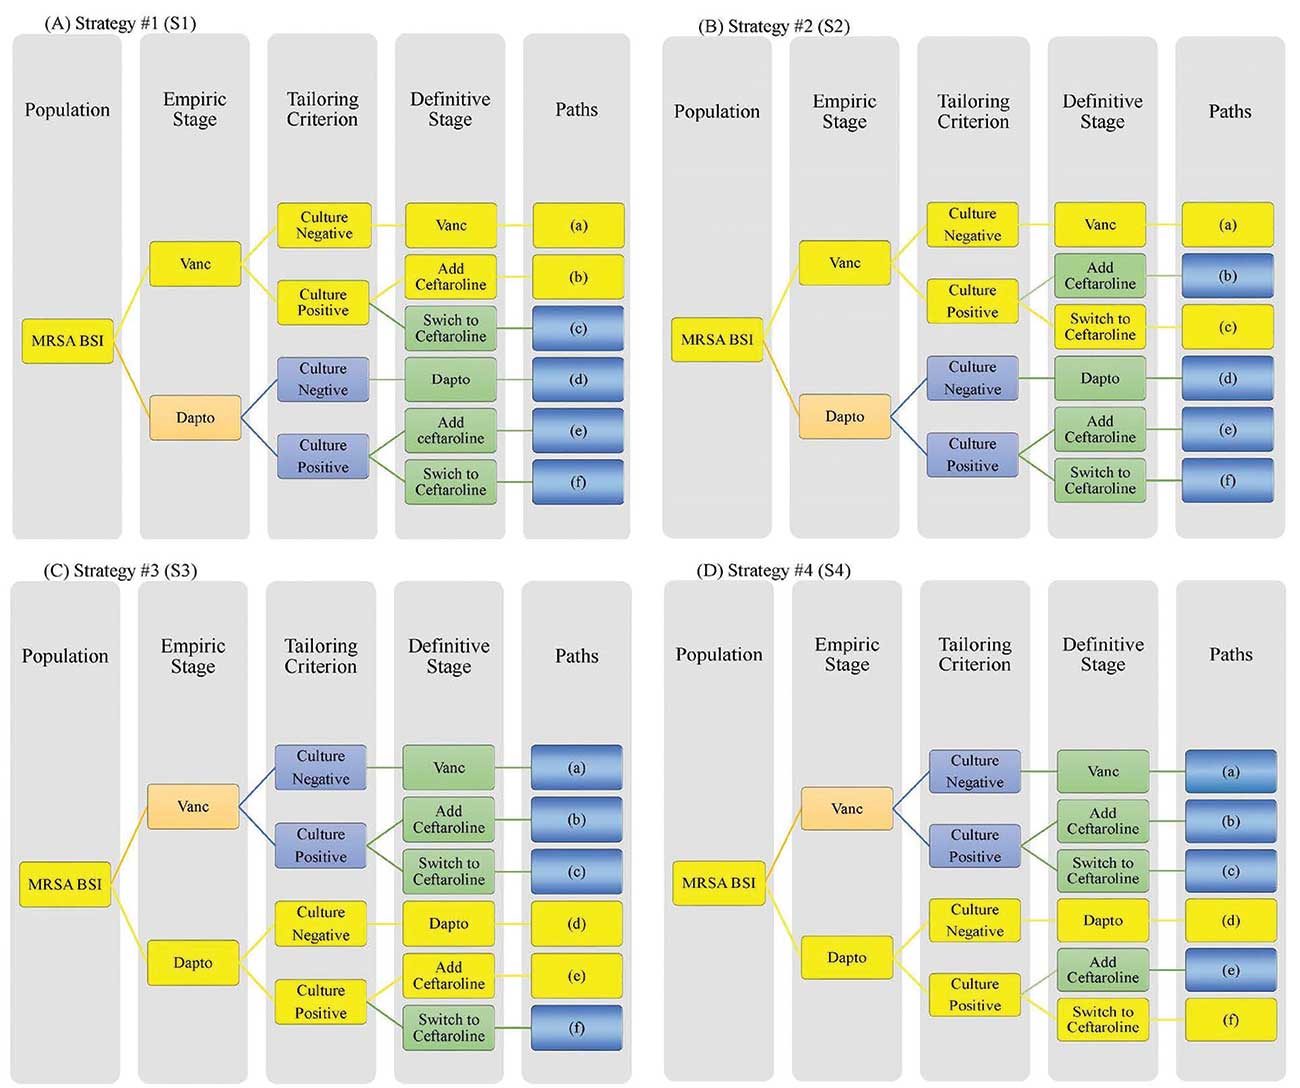
Figure 4. Example of Gram-positive SMART COMPASS trial, comparing 4 strategies (S1-S4). Each panel highlights a distinct strategy in yellow. (A) S1 uses vancomycin, with or without ceftaroline. Initial therapy uses only vancomycin; for definitive therapy, if a follow-up blood culture is positive, then ceftaroline should be added. Otherwise, continue only vancomycin. (B) S2 uses either vancomycin or ceftaroline. Initial therapy uses only vancomycin; for definitive therapy, if a follow-up blood culture is positive, then ceftaroline should be used instead. Otherwise, continue only vancomycin. (C) S3 uses daptomycin, with or without ceftaroline. Initial therapy uses daptomycin; for definitive therapy, if a follow-up blood culture is positive, then ceftaroline should be added. Otherwise, continue only daptomycin. (D) S4 uses either daptomycin or ceftaroline. Initial therapy uses daptomycin; for definitive therapy, if a follow-up blood culture is positive, then ceftaroline monotherapy should be used instead. Otherwise, continue only daptomycin. Abbreviations: BSI, bloodstream infection; Dapto, daptomycin; MRSA, methicillin-resistant Staphylococcus aureus; SMART COMPASS, sequential, multiple-assignment, randomized trials for comparing personalized antibiotic strategies; Vanco, vancomycin.
If the follow-up cultures were negative, then the initial, randomized agent would be continued. If the follow-up cultures were persistently positive, then trial participants initially on vancomycin would be re-randomized to: (i) add ceftaroline (another powerful antibiotic that may be effective for infections caused by MRSA) or (ii) switch to ceftaroline. Trial participants initially on daptomycin would be re-randomized to: (i) add ceftaroline or (ii) switch to ceftaroline. This produces a trial evaluating four strategies.
Discussion
Most clinical trials evaluate a single clinical decision using a single stage of randomization. However, the clinical management of patients is a dynamic process—a sequence of decisions with tailored therapeutic adjustments made over time and based on available information at the time. Thus, it is important to evaluate and identify optimal strategies for sequential decision-making.
In the treatment of bacterial infections, there are two major decision points regarding treatment selection: empiric and definitive therapies. SMART COMPASS is a design tailored to evaluate strategies of treatment through the empiric and definitive stages. It is valuable in the setting of antibiotic resistance, when therapeutic adjustments may be necessary at the definitive stage due to resistance.
Traditionally, antibiotic trials address definitive therapy questions in a select population to attain licensure while empiric questions receive short shrift. SMART COMPASS illustrates how creativity in statistical design can advance a field by providing a framework to address important questions that were not previously being addressed. Similar creativity in study design and analyses may help address important questions about potential treatments and diagnostics in the COVID-19 pandemic. By understanding the characteristics of the disease, potential treatments, and patient populations, study designs can be customized to address important research questions.
Further Reading
Centers for Disease Control and Prevention. 2019. Antibiotic resistance threats in the United States.
Evans, S.R., Follmann, D., Liu, Y., Holland, T., Doernberg, S.B., Rouphael, N., Hamasaki, T., et al. 2019. Sequential Multiple Assignment Randomized Trials for COMparing Personalized Antibiotic StrategieS (SMART-COMPASS). Clinical Infectious Disease 68:1961–67.
Superbug Statistics | Stats + Stories Episode 102. 2019.
World Health Organization. 2017. Global Priority list of antibiotic-resistant bacteria to guide research, discovery, and development of new antibiotics. Tacconelli-Magrini.
About the Authors
Xiaoyan Yin is a biostatistics PhD student at George Washington University and works as a biostatistician in the Diabetes Prevention Program Outcomes Study (DPPOS). Her research interests are multiple comparisons and group sequential designs. She has experience in competitive programming, market investigation and analysis, and mathematics.
Toshimitsu Hamasaki is a research professor at the George Washington University Biostatistics Center and the Department of Biostatistics and Bioinformatics. He is the editor of Statistics in Biopharmaceutical Research. Hamasaki is a fellow of the American Statistical Association and an elected member of the International Statistical Institute. He received the Distinguished Article Award from the Japanese Society of Computational Statistics and the Hida-Mizuno Prize from the Behaviormetric Society of Japan.
Dean Follmann is chief of the Biostatistics Research Branch at the National Institute of Allergy and Infectious Diseases (NIAID), a role he has held for the past 16 years. He has authored or co-authored more than 250 peer-reviewed research articles and received numerous awards, including the Department of Health and Human Services Secretary’s Award for Distinguished Service and Best Paper in Biometrics 2009, and is an elected Fellow of the American Statistical Association in 2003. He serves on committees and advisory boards for the U.S. Food and Drug Administration, National Institutes of Health, and several academic departments. His current research interests focus on statistical methods related to vaccinology.
Scott Evans is a professor and founding chair of the Department of Biostatistics Bioinformatics and director of the George Washington University Biostatistics Center. He is a recipient of the Mosteller Statistician of the Year Award and the Robert Zackin Distinguished Collaborative Statistician Award for contributions to the AIDS Clinical Trials Group (ACTG); an elected member of the International Statistical Institute (ISI); and a Fellow of the American Statistical Association (ASA), Society for Clinical Trials (SCT), and Infectious Disease Society of America (IDSA).


