
The Graphical Birth of Plate Tectonics

“The greatest value of a picture is when it forces us to notice what we never expected to see.”
— John W. Tukey
Throughout the course of history, humankind has developed many ways of answering important questions, with different methods rising to the fore for different questions. Methods of data visualization, however, stand alone in their power to not only answer questions but also suggest new ones previously unthought-of. The most-dramatic example of this is the birth of plate tectonics.
More than 400 years ago, just after the first maps of the entire world were drawn, observant people noticed that if South America and Africa could be slid across the Atlantic Ocean, they would fit together almost perfectly, like pieces of a jigsaw puzzle (see Figure 1). The Dutch mapmaker Abraham Ortelius (1527–98) commented on this in his 1596 geography book Thesaurus geographicus. In 1620, Francis Bacon (1561–1626) also remarked on the fit, suggesting that the complementary shapes were too similar to have occurred by accident.
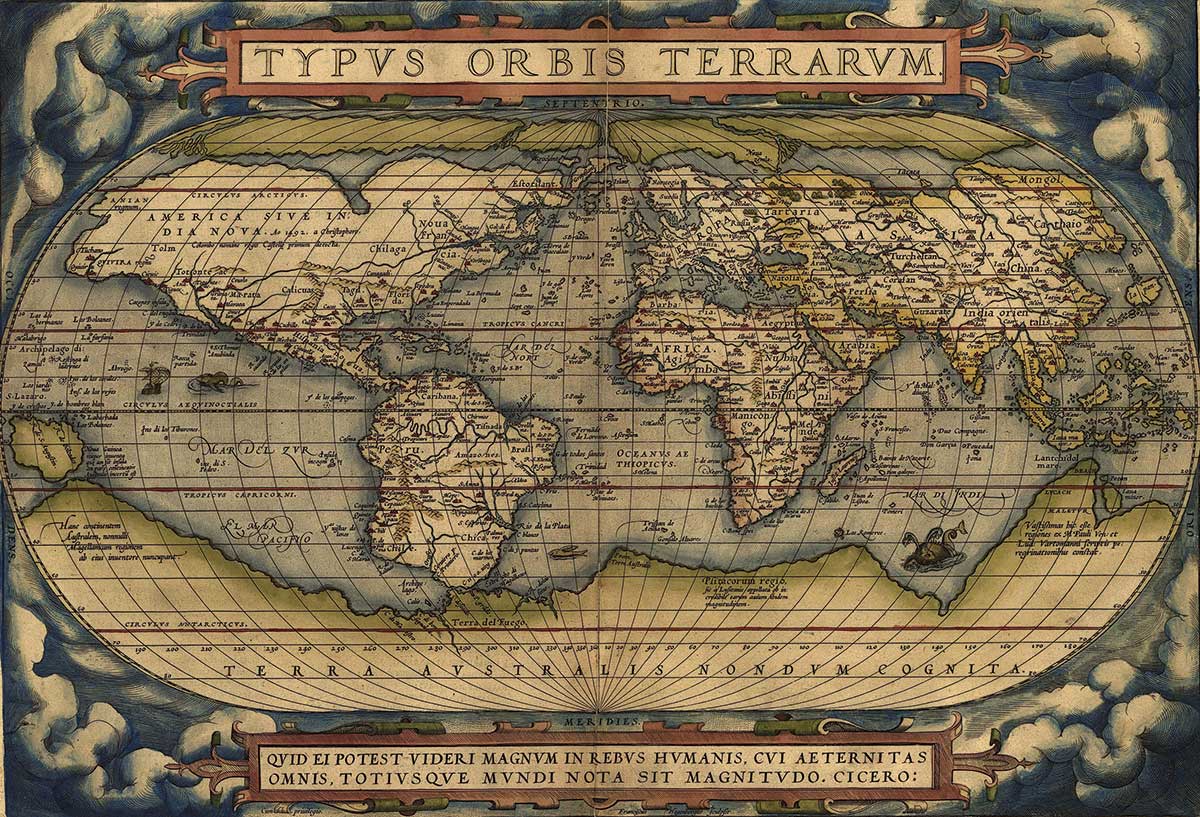
Figure 1. Typus Orbis Terrarum: 16th century version of the usual map of the Earth.
Neither Bacon nor Ortelius could offer any explanation. Indeed, the only explanations that could be offered were those that complied with religious dogma that held that the date of creation was October 23, 4004 BC.1 Only those involving violent catastrophes, like the Great Flood washing the continents apart, could fit the limited time span available.
This point of view held sway for 200 years until 1785, when James Hutton (1726–97), a Scottish physician and naturalist, presented his ideas to the Royal Society of Edinburgh. The emerging fossil and geological evidence led him to synthesize a theory that required the Earth to be far older than the 6,000 years that biblical history dictated. His theory was built around a concept of a long and slow process of gradual changes, rather than the sudden catastrophic events that must lie at the heart of biblical explanations. It also explained why fossils of ancient ocean creatures appeared on mountaintops.
Hutton’s ideas did not meet with widespread appeal, at least partially because of his lack of skill as a speaker and writer. Happily for Hutton, he numbered among his friends John Playfair (1746–1819), a renowned natural scientist at the University of Edinburgh and elder brother of William Playfair (1759–1823), the inventor of most of modern statistical graphics.
With John Playfair’s clear prose, Hutton’s ideas gained currency. Those ideas received a boost from the British naturalist Charles Lyell (1797–1875) in his 1830 Principles of Geology, followed a decade later by Louis Agassiz’s (1807–73) critically important Études sur les glaciers.
The scientific revolution in geology that made very long-term changes possible, however, still did not explain how entire continents could float across the face of the Earth; it only provided enough time for such events to occur.
The graphic evidence of the near-perfect fit of the coasts of Africa and South America continued to engage the curiosity of scientists. Alexander von Humboldt (1769–1859) found rock foundations along the Brazilian coast that were almost identical to those from the coast of West Africa. Biologists found fossil ferns called Glossopteris on both continents, as well as fossilized camels and other land animals. Various explanations were offered (e.g., land bridges between continents), but for all of the 19th century, none credibly covered all the facts (e.g., the fossil and geological similarities spanning multiple continents).
This began to change in 1911, when Alfred Wegener (1880–1930) proposed that there was once but a single huge supercontinent he called Pangaea that began to break up about 200 million years earlier (see Figure 2). However, he had no explanation for how or why the various land masses thus formed drifted apart.

Figure 2. Modern USGS map of Pangaea, augmented by fossil evidence supporting the historical contiguity of the great continents. (Fossil map by Osvaldocangaspadilla.
Provided by USGS. License: public domain: no known copyright).
The answer to this puzzle required the emerging technologies of explosion seismology and sonar. In 1947, Maurice Ewing (1906–74) and his students Bruce Heezen (1924–77) and Marie Tharp (1920–2006) used these tools to prepare a map of the underwater landscape of the North Atlantic, showing a huge mid-ocean ridge2 that paralleled the coastlines of the continents on either side. Added to this was Edward Billard’s discovery that the temperature along the mid-Atlantic ridge was much hotter than the areas surrounding it.
This allowed the 1959 construction of a new map of the world (Figure 3) showing a network of such ridges that divided the Earth’s crust into what became known as tectonic plates. Plate tectonics, the modern theory that describes how the continents on the surface of the Earth do indeed float around, was finally laid out in 1967 (independently, and more or less simultaneously) by Princeton’s W. Jason Morgan and Cambridge’s Dan McKenzie.
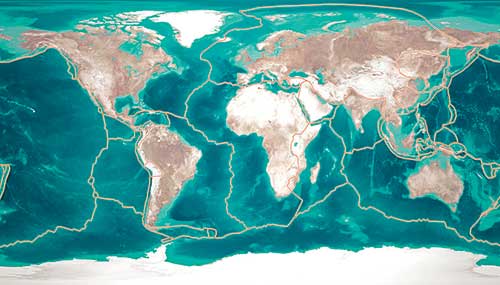
Figure 3. Modern version of Figure 1 with tectonic ridges shown.
Source: NASA: https://visibleearth.nasa.gov/view.php?id=73963, https://visibleearth.nasa.gov/view.php?id=74443. iStock / Getty Images Plus.
That is how the great question about how the world came to be configured the way it is, posed 400 years ago by a geographic visualization of a 16th-century mapmaker, was answered through the data gathering and imagination of scores of scientists over the centuries. Although there have been many wonderful visualizations in the last four centuries, it is hard to imagine any that have had the import and impact of the map that led Abraham Ortelius to his remarkable observation.
Further Reading
Hutton, J. 1795. The Theory of the Earth. Project Gutenberg.
Kious, W.J., and Tilling, R.J. 1996. This Dynamic Earth: The Story of Plate Tectonics. Washington, DC: U.S. Geological Survey.
Lyell, C. 1830. Principles of Geology. London: John Murray (reprinted in 1990 by University of Chicago Press).
Marvin, U.B. 1973. Continental Drift: The Evolution of a Concept. Washington, DC: Smithsonian Institution Press.
Playfair, J. 1802. Illustration of the Huttonian Theory of the Earth. Edinburgh: Neill & Co. for Caddell and Davies; William Creech.
Tukey, J.W. 1977. Exploratory data analysis. Reading, MA: Addison-Wesley. vi.
Footnotes
1For the details on the source of this remarkably precise estimate, visit Wikipedia and the references there.
2Were the oceans to be drained, this ridge would be one of the planet’s most-prominent features, running almost pole-to-pole (see Figure 3) and thus dwarfing in length the Andes, Rockies, and Himalayas.
About the Authors
Howard Wainer is in his post-employment career. He lives in Pennington, NJ, and has written this column since 1990.
Michael Friendly is a professor of psychology at York University.
Their latest book is Data Visualization: A History of Visual Thinking and Graphic Communication. It will be published by Harvard University Press and is due to appear in 2020.

Visual Revelations covers many topics, but generally focuses on two principal themes: graphical display and history. Howard Wainer, column editor, encourages using this column as an outlet for popular statistical discourse. If you have questions or comments about the column, contact Wainer at wainerhoward@gmail.com.


