
Bond. James Bond. A Statistical Look at Cinema’s Most Famous Spy

In 1953, the literary world was introduced to the fictional British Secret Service agent James Bond, a.k.a. 007. The character was conceived by author Ian Fleming, who drew upon some of his experiences as a British Naval Intelligence officer during World War II. Fleming wrote 12 James Bond novels and nine short stories before he died from heart disease in 1964.
Fleming’s 007 novels achieved moderate success and critical acclaim; however, what catapulted James Bond into the pantheon of cultural icons was the introduction of the character portrayed by Sean Connery in 1962’s “Dr. No.” As of 2013, there have been 23 official James Bond films produced and released by Eon Productions, six actors have donned the tuxedo as 007, and numerous cultural influences can be attributed to the secret agent. The films have enjoyed enormous success and popularity spanning their 50-year tenure. When not adjusting for inflation, the Bond franchise is ranked number two on the list of most successful film franchises worldwide, behind the “Harry Potter” films and above the “Star Wars” films. In fact, it has been estimated that around 20% of the world’s population has seen at least one James Bond film.
James Bond also has been the subject for academic discourse. For example, Christoph Lindner edited the 2010 book The James Bond Phenomenon: A Critical Reader, which is an essay collection providing theoretical perspectives on James Bond as a cultural figure. Daniel Savoye’s 2013 book, The Signs of James Bond: Semiotic Explorations in the World of 007, provides a critical analysis of the formulaic elements that comprise James Bond films. There also have been university topics courses that explore themes and issues conveyed through the James Bond films and novels. Such courses have been offered at Missouri State University, Thiel College, and the University of Michigan.
In this article, we analyze the James Bond films from a statistical perspective and provide data visualizations of various aspects of the films. We build a multivariate regression model to dissect the box office totals (adjusting for inflation) and average ratings when considering other variables about the films. Using our model, we provide a prediction region for the box office gross and average rating score of the next James Bond film. We also provide a ranking of the actors who have played James Bond in an attempt to answer an often-debated question that even Q has surely struggled with: Who is the best Bond?
The Data
As noted earlier, we only include the ‘official’ movies produced by Eon Productions. In addition to these 23 movies, there have been a few ‘unofficial’ James Bond movies made. The unofficial films are the 1954 made-for-TV movie “Casino Royale,” the 1967 comedic spoof “Casino Royale” starring David Niven, and the 1983 competing film “Never Say Never Again,” which is a remake of “Thunderball” and stars Connery.
Table 1 shows some of the data for the movies we use in our analysis. The table includes the year each film was released, the name of the film, which actor portrayed James Bond, worldwide gross for the film (in $1000) adjusted for inflation, the budget for the film (in $1000) adjusted for inflation, and the average online ratings for the films. The original box office totals and budgets were retrieved from www.the-numbers.com, a website that maintains box office history and other statistics about movies. These values were adjusted to 2013 dollars using the U.S. Bureau of Labor Statistics’ inflation calculator, which uses the Consumer Price Index and was accessed on April 3, 2013. The average user ratings were pulled from each movie’s webpage on IMDB and Rotten Tomatoes, both of which were also accessed on April 3, 2013. These websites allow users to rate movies on a scale from 1 to 10. For the James Bond films, the user ratings between these two websites are highly correlated, with a Pearson correlation of +0.8868. Thus, for our analysis, we average the pairs of user ratings.
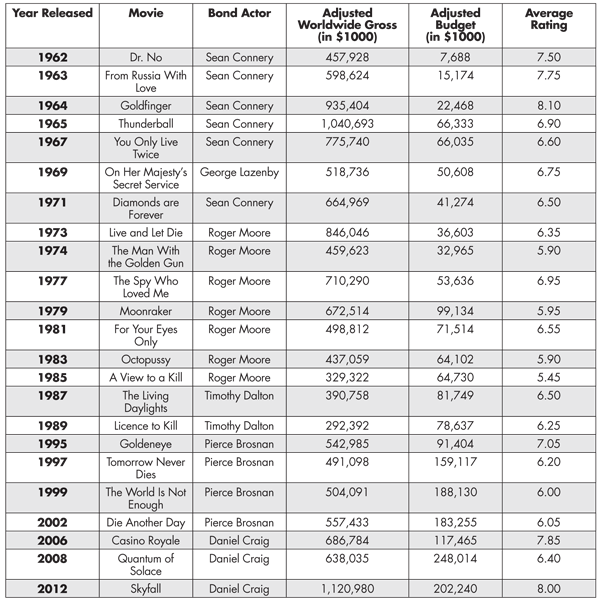
Table 1—Official James Bond Films by Release Year
Note: The worldwide gross and budget are both adjusted to 2013 dollars.
In addition to the variables presented in Table 1, we consider the following about each film for our analysis:
- Length of the theatrical release
- Number of ‘conquests’ James Bond had
- Number of martinis Bond had
- Number of times “Bond. James Bond.” was stated
- Number of kills by Bond
- Number of kills by characters other than Bond
- Whether the theme song peaked within the top 100 on the UK Singles Chart and the U.S. Billboard Hot 100
The values for the number of kills by Bond and the other characters were obtained from data published on a data blog at The Guardian’s website.
Exploratory Data Analysis
A timeline of the adjusted worldwide gross is given as a bubble plot in Figure 1, where the scale of the bubbles reflects the average user rating of the film. From this plot, we note a few interesting aspects about the James Bond films. First is that with the exception of the lone George Lazenby film, the first film by each actor had higher adjusted worldwide gross sales than the last film by the previous actor. We can see that Roger Moore, whose tenure as James Bond was the longest with seven films, tended to decrease across time in both adjusted worldwide gross sales and average user ratings. Regarding the Pierce Brosnan films, they tended to be consistent in terms of the adjusted worldwide gross sales. Finally, we see that the most recent Daniel Craig film, “Skyfall,” is currently the highest-grossing James Bond film and has the second-highest average user rating, just behind Connery’s “Goldfinger.”
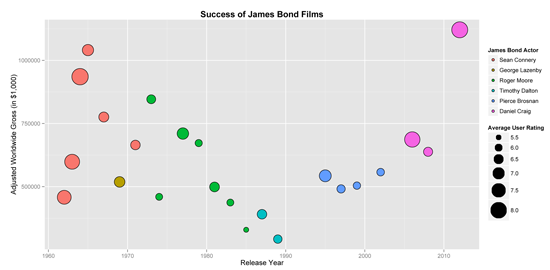
Figure 1. Bubble plot showing the adjusted worldwide gross of James Bond films by the year they were released
We also provide a stacked area chart of the cumulative sales of the James Bond films in Figure 2. This chart is in terms of millions of U.S. dollars, where the sales are adjusted to 2013 dollars. We see that the cumulative U.S. sales have increased consistently over time. However, the total world sales have increased at a greater rate relative to just the U.S. sales, especially given the success of “Skyfall.” For example, as of 2013, “Skyfall” is the highest-grossing film of all time in the United Kingdom.
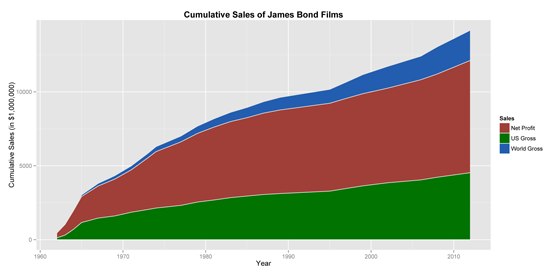
Figure 2. Stacked area chart of cumulative sales of the James Bond films
Next, we look at two vices associated with James Bond: martinis and conquests of female companions. Figure 3 is a bar chart showing the distribution of these two vices by each James Bond actor. Overall, the average number of conquests per Bond is similar across the actors. Moore has the highest number, but he also starred in the most films. The distribution of martinis by each actor is noticeably more variable. For example, Moore has the lowest average number of martinis while Craig has both the highest total and average number of martinis. In fact, Craig’s James Bond is the only one whose martini count exceeds his conquest count.
Figure 3. Bar chart showing total number of martinis and conquests by Bond actor. Dashed lines represent the mean for that actor.
While James Bond is infamous for his vices, he is also known for his license to kill. Figure 4 is a bubble plot showing each James Bond actor’s kill ratio (i.e., the average number of kills per film) versus his total kills in all films. The bubbles are proportional to the kill ratio by all other characters in the corresponding films. For example, we see the kill ratio by other characters always exceeds that of the James Bond actor, except Brosnan. The biggest differential between kill ratios is with Connery, while clearly Brosnan had the highest kill ratio and total kills. Thus, Brosnan has the dubious distinction of being the deadliest Bond.
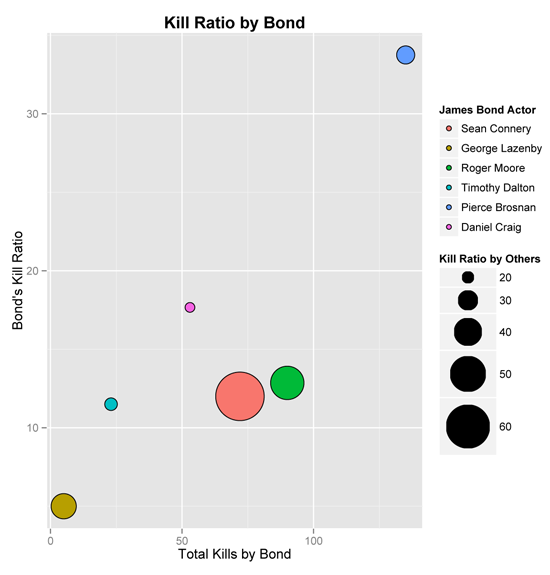
Figure 4. Bubble plot of each Bond actor’s kill ratio (i.e., average kills per film) versus his total kills. The area of the bubbles is proportional to the kill ratio by others in the corresponding films.
Building a Statistical Model of the Bond Movies
The adjusted worldwide gross and average user ratings are variables that provide a good indication of each movie’s success (see Figure 5). The Pearson correlation between these variables is +0.5659, which is a moderately high value and significantly different from 0 (p-value = 0.0049). Treating these variables as a bivariate response, we build a multivariate multiple linear regression model and explore the variables listed in the previous section as possible predictors in the model.
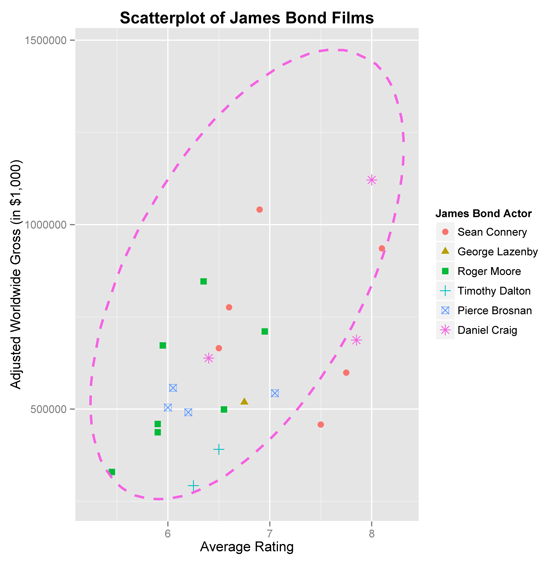
Figure 5. Scatterplot of the adjusted sales versus average rating for the James Bond films. The 95% prediction ellipse for the next James Bond film starring Daniel Craig is overlaid.
We construct the multivariate analysis of variance (MANOVA) table to assess the significance of each independent variable. We compute the following four multivariate test statistics: Wilks’ lambda, Pillai’s trace, the Hotelling-Lawley trace, and Roy’s greatest root. Using a significance level of 0.05, we perform backwards elimination by removing the least significant variable based on the MANOVA results. Using this approach, we end up with only the Bond actor and the adjusted budget as significant predictors of the bivariate response. In fact, our decisions based on the p-values for each predictor is consistent across the four test statistics. Since our decisions do not vary across the four tests, we are confident in the results.
Our final multivariate regression model treats the adjusted worldwide gross and average rating as the response vector with Bond actor and adjusted budget as predictors. We next analyze the residual vectors for each regression to assess the normality and constant variance assumptions. The Shapiro-Wilk test for normality applied to the residuals yields p-values of 0.2780 and 0.2352 for the adjusted worldwide gross and average user relationships, respectively. The corresponding results from the Levene test for constant variance yields p-values of 0.4533 and 0.4039. Therefore, we claim that the normal regression assumptions are appropriate for this model.
We also construct a 95% prediction ellipse for the next James Bond film. It has been confirmed that Craig is signed to star in two more James Bond films, with the next film slated for release in late 2015. Using our estimated multivariate regression model and assuming that the next film will have a budget around $250 million, we obtain an estimated average rating for the film of about 6.80, while the estimated worldwide gross of the film is around $865 million. The corresponding 95% prediction ellipse is overlaid on the data plotted in Figure 5.
Ranking the Bonds
Anyone who considers himself or herself even a casual Bond fan typically opines on who they think is the best James Bond. In this section, we present a simple ranking methodology as a way to answer this question. We consider the worldwide gross, net profit of the films (i.e., the adjusted worldwide gross minus the adjusted budget), the average user ratings of the films, and the number of films featuring each actor. For each variable, we rank the James Bond actors and then calculate the means of their rankings. The lowest mean is given a final ranking of 1, and the highest mean is given a ranking of 6. All these rankings are reported in Table 2.
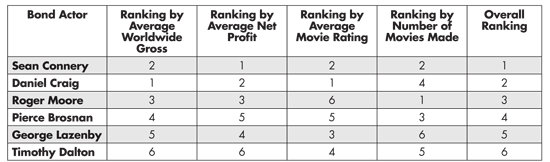
Table 2—Rankings of the James Bond Actors by Different Variables
Note: The last column is the ranking of the average of the four ranking variables.
The results show that Connery comes out as the best James Bond, according to our methodology. This is not unexpected considering he defined the role and has some of the most popular movies during his tenure as 007, like “From Russia with Love” and “Goldfinger.” Craig is second, which again is not unexpected considering he is the current James Bond and his three films have been very successful. Third is Moore, who starred in the most James Bond films of any actor—seven. While we noted the decline in the adjusted worldwide gross of his films, their success is still quite good considering they were released during years that saw competition from box office hits like “E.T.” and the original “Star Wars” films.
Ranked fourth by our methodology is Brosnan, whose debut film “Goldeneye” was very well received after the franchise took a six-year hiatus. Each of his subsequent movies saw success at the box office, but they are sometimes viewed as declining in quality as demonstrated with the decreasing ratings in Table 1. Fifth is Lazenby, who only starred in one James Bond film, “On Her Majesty’s Secret Service.” Fortunately, this movie is often regarded by critics and fans as being one of the best in the Bond canon as we see the character humanized by getting married, but only to have his wife killed on their wedding day. In sixth place is Timothy Dalton, who was actually asked by the original producer of the James Bond films, Cubby Broccoli, to succeed Connery back in the early 1970s. However, Timothy Dalton passed at the time because he felt he was “too young” for the role, only being in his late 20s at the time. While Dalton is a classically trained actor who spent time performing with the Royal Shakespeare Company, he was unfortunate in that his films were made during a time when the Bond formula was seen as stale. In fact, he was slated to star in a third James Bond film, but the concept was shelved due to studio issues until Brosnan made his debut in “Goldeneye.”
Discussion
This study explored the James Bond film franchise through various data visualizations and by building a multivariate regression model that characterizes the worldwide box office receipts and average user ratings as a function of the actors and the film’s budgets. From this model, we constructed a prediction region to characterize where the worldwide gross and user ratings will likely fall for the next James Bond film starring Craig. Finally, we averaged the rankings of certain variables for each James Bond actor to provide an overall ranking. Based on this ranking methodology, we determined that Connery is the ‘best’ actor to have played 007.
While the model we presented is a way to characterize the films based on a few variables, the true success and endurance of the films is, perhaps, a topic for a more philosophical discussion. It could be that we enjoy how the James Bond films depict travels to exotic locales and provide adventurous tales that romanticize espionage. It could be that while Bond is a flawed human being, at the core of his objective is to protect “Queen and Country” and we enjoy seeing him being the proverbial good that triumphs over evil. Or more personally, it could simply be that we relate to the era and style reflected in a particular Bond film, which reminds us of a particular time in our own lives. Regardless, the appeal of James Bond has spanned many generations and the films have endured through numerous global events. Even with so many uncertainties in an ever-changing world, we can rest assured that “James Bond will return…”
Further Reading
Cork, J., and C. Stutz. 2009. James Bond encyclopedia. New York, USA: DK Publishing.
Desowitz, B. 2012. James Bond unmasked. Maryland, USA: Spies Publishing.
Dodds, K. 2003. Licensed to stereotype: Geopolitics, James Bond, and the spectre of balkanism. Geopolitics 8(2):125–156.
Johnson, R. A., and D. W. Wichern. 2007. Applied multivariate statistical analysis (6th ed.) PDF download. New Jersey, USA: Prentice Hall.
Moore, R. 2012. Bond on Bond: Reflections on 50 years of James Bond movies. Connecticut, USA: Lyons Press.
Neuendorf, K. A., T. D. Gore, A. Dalessandro, P. Janstove, and S. Snyder-Suhy. 2010. Shaken and stirred: A content analysis of women’s portrayals in James Bond films. Sex Roles 62(11/12):74–77.
About the Author
Derek Young is a research mathematical statistician at the U.S. Census Bureau, lecturer of statistics at Penn State University, and an Accredited Professional StatisticianTM. His research interests include tolerance regions, mixture models, and statistical depth functions.
Funny, I wrote an article “The three things that James Bond knows about Big Data.” I’m glad if it inspired you to write James Bond and Big Data.
Mr. Young, there is an omission in Table 1. Never Say Never Again with Sean Connery’s reprisal of the role in 1983. There were dueling Bonds that year with Moore in Octopussy and Connery in Never Say Never Again. I was curious how audiences reacted (with box office sales) for each. I only remembered this because the very beautiful and curiously untalented Kim Basinger was in it and I was 14 years-old at the time.
http://www.imdb.com/title/tt0086006/?ref_=nm_flmg_act_30