
The Challenge of Counting Victims of Human Trafficking
Not on the record: A multiple systems estimation of the numbers of human trafficking victims in the Netherlands in 2010–2015 by year, age, gender, and type of exploitation
“This is the great human rights issue of our time, and as prime minister, I am determined that we will make it a national and international mission to rid our world of this barbaric evil,” declared Theresa May, as newly elected prime minister of the United Kingdom, on July 30, 2016. In the same spirit, the United Nations recently adopted the Elimination of Human Trafficking/Forced Labor as Goal 16.2 of its 2030 Agenda for Sustainable Development.
To monitor implementation of this goal, the UN Statistical Commission’s Interagency and Expert Group on SDG Indicators (IAEG-SDGs) recommended tracking the indicator for “[n]umber of victims of human trafficking per 100,000; by sex, age, and form of exploitation.” The institution made responsible for collecting data on this indicator is the UN Office on Drugs and Crime (UNODC) in Vienna, Austria. According to the UNODC, that indicator is composed of two parts: detected and undetected victims of trafficking in persons.
The detected part of trafficking victims, resulting from investigation and prosecution activities of criminal justice system, is counted and reported by national law enforcement authorities. The methodology to estimate the number of undetected victims of trafficking in people is, according to UNODC, under development: “[S]ome methods have been identified, but further testing is needed to produce a consolidated and agreed-upon approach. The method to estimate undetected victims will have to allow the estimation of victims’ characteristics (sex and age) and the forms of exploitation suffered.”
Statistical authorities around the world routinely collect statistics on detected victims that are duly published by UNODC in its biannual Global Reports on Trafficking in Persons. However, these statistics tell us next to nothing about the true volume of trafficking in people and, in fact, when published in a comparative perspective, provide misinformation of the worst possible kind.
To provide just one example, taken from the UN report of 2014, the Netherlands, with a population of 17 million, registers 1,700 victims of human trafficking per year; the USA, population 500 million: a mere 500; and the UK, population 64 million: 2,100. Even assuming that the Netherlands is a contemporary Sodom and Gomorrah (think Amsterdam!), these comparative statistics beggar belief. Most likely, the American and British authorities are less efficient in detecting victims of these crimes than their Dutch counterparts. Clearly, monitoring progress with SDG 16.2 will require better international statistics on human trafficking than the official figures of recorded cases.
Unfortunately, the estimation of statistics on undetected victims poses a formidable challenge, known in criminology as the age-old problem of the “hidden figures of crime.” In recent years, criminologists have made some headway with cracking the hidden figures through annual surveys of the public about personal or household experiences with common types of crime, such as the National Crime Victims Surveys in the USA, National Crime Victims Survey of England and Wales, National Safety Monitor in the Netherlands, and, for comparative purposes, International Crime Victims Surveys.
Building on this work, and as explained elsewhere in this issue in more detail, standardized surveys have been conducted in 20 or so countries about experiences with victimization by human trafficking or forced labor. Although first results of surveys in developing countries are encouraging, the conduct of probabilistic sample surveys offers no panacea for measuring modern slavery. Unlike burglary or street mugging, the crime of human trafficking/forced labor tends to be relatively rare and more deeply “hidden.”
The first surveys conducted by Gallup International and others produced prevalence rates for nonsexual exploitation far below 1%. The reliable estimation of annual changes in this phenomenon per country will require huge samples, and concomitant huge budgets. In the Western world, the challenges are even greater, since exploitation is concentrated among hard-to-find legal or illegal migrant workers—in the first batch of surveys, cases of sexual exploitation were rarely reported to interviewers at all. Data collection about sexual exploitation through interviewing may prove to be near-impossible due to respondents’ feelings of fear or shame.
In conclusion, the UN proposed indicator of undetected victims by gender, age, and type of exploitation is unlikely to come from survey research alone in the foreseeable future.
National Referral Systems and Multi-source Data
On a more positive note, two other characteristics favor the measurement of human trafficking, however complicated by its hidden nature and skewed distribution among populations.
It is, firstly, one of the rare types of crime for which a formal definition exists in international criminal law. The United Nations Palermo Protocol on Trafficking in Persons, in particular Women and Children, adopted in 2000 and to date ratified by 186 countries, defines the crime of human trafficking as the recruiting, transporting, or harboring of people with the use of deceit or force for the purpose of exploitation.
Exploitation in this context means, at a minimum, the exploitation or prostitution of others, forced labor, and slavery. Although the clarity and preciseness of this definition leaves much to be desired, it has undoubtedly provided useful guidance to national legislators, resulting in a fair measure of uniformity in domestic legal definitions of this type of crime across countries. In this respect, human trafficking differs favorably from common crimes like burglary, fraud, or assault, for which there are no international definitions.
The second factor is the insistence of the Palermo Protocol that the fight against human trafficking must not focus exclusively on punishing offenders, but must include protecting victims. Victims of human trafficking should, when rescued, not be deported as illegal migrants or punished as sex workers, but offered protection and assistance.
This dual focus calls for the involvement of organizations other than law enforcement. Ideally, and as prescribed in the United Nations Model Law against Trafficking in Persons, governmental or nongovernmental support organizations must play a role in the identification of victims so such organizations can offer assistance independently from law enforcement authorities.
In Europe, national multi-agency referral and identification systems involving all relevant actors have, for years, been promoted by both the European Council and the Organization of Security and Economic Cooperation in Europe. As a result, national multi-agency systems of identifying and supporting victims, known as National Referral Mechanisms (NRMs), have duly been put in place in many Western and Eastern European countries.
For example, dedicated NGOs, municipal agencies, and the police in the United Kingdom work together to identify people who are entitled to special services and protection as possible victims of human trafficking. In the Netherlands, a government-funded NGO, Coordination Human Trafficking in the Netherlands (COMENSHA), provides guidance to all relevant actors about the signs of victims of human trafficking and acts as a national clearinghouse of all people identified as such by NGOs, municipal institutions, the Royal Border Police, and the National Police.
The records of such systems can be used collecting comprehensive statistics on the numbers of people identified as victims by any relevant organization in the country. The possibility that the same people might be counted twice or more on different lists was initially seen as a drawback for collecting such statistics. Unique identifiers of all recorded people were introduced by organizations such as the British Home Office and COMENSHA in the Netherlands to control for double-counting the same victims.
In 2014, a team of researchers under the leadership of Bernard Silverman, chief scientist of the Home Office in London, applied multiple systems estimation (MSE) to the multi-source data set on people identified as possible victims of human trafficking in the United Kingdom in 2012.
Soon afterward, this exercise was replicated in the Netherlands with the 2014 data from COMENSHA (Van Dijk and van der Heijden, 2016).
The statistical technique to estimate the volume of hidden populations, known under various names such as capture-recapture analysis, multiple-systems analysis, or multiple record systems analysis, was originally developed by biologists to estimate animal populations. Although the precise historical origins of the technique are disputed, Danish marine biologist Johannes Petersen (1860–1928) is often credited with the early use of the capture-recapture method to estimate the sizes of fish populations.
The quintessential concept for estimating the number of fish in a pond involves catching a number of fish (say, 100), tagging them, and then throwing them back into the same pond. Some time later, the researcher takes a new catch (say, another 100) from the same pond and counts how many of the second catch are tagged, as being part of the returned original first catch.
If the overlap between the two catches is zero or very small, it suggests that the population of fish in the pond is much larger than 100. If the overlap is considerable, such as 50, it suggests that the population is smaller. The larger the overlap, the smaller the fish population. If 20 of the 100 fish in the second catch are tagged, we know that the tagged fish in the pond had a chance of one in five of being caught. Assuming that the untagged fish have similar catchment chances, the total number of fish in the pond can be estimated at 500, of which 400 are untagged.
The capture-recapture approach of biologists has translated into a well-known method for estimating the size of a hidden human population, using two independent recording systems (or registers) that partially list its members. Linking the individuals in the two registers allows estimating the number of individuals who are not recorded in any of the registers. For example, with registers A and B, linkage gives a count of individuals in A but not in B, a count of individuals in B but not in A, and a count of individuals in both A and B.
The counts form a contingency table denoted by A × B, with the variable labeled A being short for “inclusion in register A,” differentiating between the categories “yes” and “no,” and likewise for register B. The statistical problem is to estimate this value in the cell “no, no.” An estimate of the total population size is obtained by adding the estimated count of doubly missed individuals to the counts of individuals found in at least one of the registers.
The capture-recapture method has been successfully applied to estimating the size of hidden human populations by determining the overlaps between unique individuals appearing in separate recording systems (or lists). Using such capture-recapture analysis, estimates have, for example, been made of the numbers of soliciting prostitutes in Oslo, casualties of human rights violations in Peru, homeless people, victims of domestic violence, drugs users and irregular migrants in the Netherlands, and intravenous drug users in Scotland.
Capture-recapture analysis depends on certain assumptions about the lists and the populations from which they are drawn. Arguably, the most problematic condition to fulfill when using recording systems of human individuals is that of independence. In the case of records of people, this assumption of independence is usually false. For example, people identified by the authorities as presumed victims of human trafficking are likely to be referred to social assistance programs, and consequently have a higher probability of being included in the recording systems of the involved NGOs.
In this case, including a service provider in a list is far from independent from registration by the police. This is an example of positive dependence. Since such positive dependence increases the overlap between the two lists, the number of the unobserved population is consequently underestimated. In practice, negative dependence may also occur, for example, when inclusion in one register lowers the chance of being registered in another, and this leads to an overestimation.
The Alternative of Multiple Systems Estimation
A promising approach to relaxing the condition of independence is to include a third register, or multiple registers, and to analyze the three-ways, or multiple-way, contingency tables. With three or more lists, the independence assumption in the two-list case is replaced by the less-severe assumption that three-factor interaction is absent. In official statistics, this extension of the two-list capture-recapture method is known as Multiple Systems of Multiple Records Estimation (MSE).
In the UK, the obligation to identify presumed victims of human trafficking is, as noted, discharged by the National Referral Mechanism (NRM), a framework for identifying victims and ensuring they receive appropriate protection and support. It is managed by the United Kingdom Human Trafficking Centre (UKHTC) of the Home Office. The Home Office collates data from various sources to produce strategic assessments of presumed victims. These are published quarterly and broken down into the sources of the various cases. In 2013, 2,744 unique presumed trafficking-in-people victims were identified. The information about presumed victims in the NCA Strategic Assessment came from a large number of separate organizations.
This information can be summarized into five lists based on the source type:
- LA: Local authority
- NG: Non-governmental organization
- PF: Police force/National crime agency
- GO: Government organization (mostly Home Office agencies, e.g., UK Border Force, Gangmasters Licensing Authority)
- GP: General public, through various routes
Of the 2,744 victims included in the 2013 database, some appeared on two and a few on three or four of the five lists. Table 1 shows the distribution of the identified victims in the five lists.
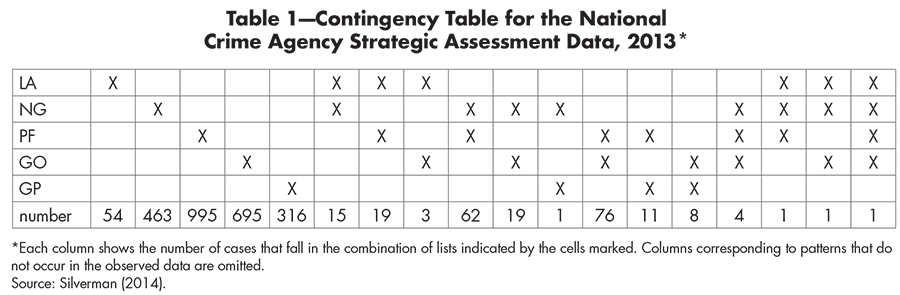
Table 1—Contingency Table for the National Crime Agency Strategic Assessment Data, 2013*
In the bottom row of Table 1 are the numbers of investigated people in each of the possible categories. Multiple systems estimation allows an estimation of the number of individuals not appearing on any of the lists, given the distribution of individuals in the contingency table. This is done by assuming that each of the counts is derived from a Poisson distribution—a distribution for the occurrence of rare events. A restrictive Poisson loglinear model is estimated for each of the cells and the parameter estimates are projected on the cell with the non-appearing or hidden individuals.
With loglinear modeling, it is possible to assess how much being on one particular list affects a person’s chances of being on another. Possible interactions between lists can be detected and controlled for in the estimates. The condition of independence can, therefore, be relaxed.
Bales, Hesketh, and Silverman (2015) fitted a loglinear model to the data in Table 1 that allows for individual list effects, and also for interaction between lists.
The confidence interval for the actual population size was estimated as between from 10,000 to 13,000, including the 2,744 cases already known to the NCA. This suggests that the Strategic Assessment is aware of roughly 20 to 30% of all possible victims in the UK in 2013. In round numbers, therefore, the dark figure is around 7,000 to 10,000.
There is a positive correlation between list LA and each of lists NG and PF, which suggests that being known to the local authority apparently increases the chance of being known to NGOs or the police. This may reflect the existence of referral pathways for potential victims between these agencies, in particular in relation to children who, unlike adults, do not have to consent to referral to the National Referral Mechanism, or joint operations between the local authorities and other agencies.
The upshot of the exploratory MSE carried out on the lists of the National Crime Agency is that the true numbers of victims during 2013 is estimated at between 7,000 and 10,000, or between three and five times the numbers of detected victims. In other words, the ratio between detected victims and undetected victims is estimated as 1:4.
The Case of the Netherlands
We can look to the Netherlands for a useful model of how the process could work. Relevant governmental institutions there, such as districts of the National Police, Royal Border Police (Koninklijke Marechausee; KMAR), Regional Coordination Offices (decentralized units of COMENSHA for coordinating victim services), and Labor Inspectorates (Inspecties Sociale Zaken en Werkgelegenheid; ISZW), are instructed to report on all cases of possible victimization by trafficking in people that come to their knowledge. Specialized NGOs offering services to trafficking victims are invited to report their cases as well, and most seem to comply with this request.
Law firms, youth care and social work organizations, and organizations supporting asylum seekers such as reception centers also can report clients who show signs of having been victims of trafficking to COMENSHA. Finally, victims can self-identify themselves by contacting COMENSHA.
In the COMENSHA database for 2014, a total of 1,561 uniquely defined cases were registered once or more. In roughly one in 14 cases, victims have been reported by more than one organization, usually two, and, in some cases, three. Many of the theoretically possible combinations of two lists occur.
In Van Dijk and Van der Heijden (2016), we used loglinear models to estimate the dark number, using six lists: P = Police; R = Regional Coordinators/COMENSHA; K = Border Police; O = service-providing NGOs; I = Labor Inspectorate; Z = Others (e.g., youth care and law firms). We carried out a model search using forward selection and the R-package STEP, starting with a simple model and including interaction terms until the fit of the model to the data became adequate.
Table 2 reports the first five models. The standard approach for fit assessment of these models is to evaluate the chi-squared value, based on the deviance in combination with the degrees of freedom. For the data at hand, this approach is problematic because of the many empty cells (there are no observations for certain combinations of registers), as a result of which the chi-squared approximation does not hold.
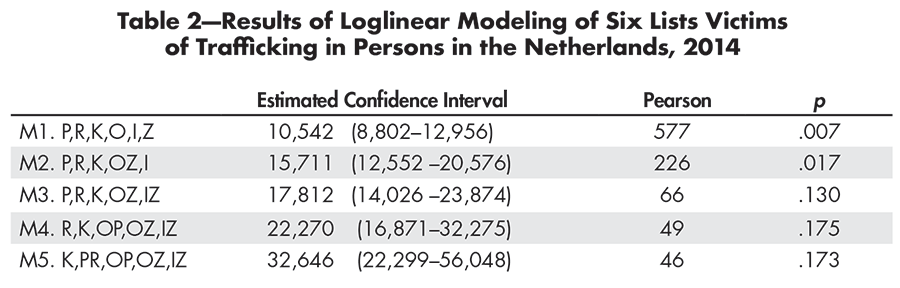
Table 2—Results of Loglinear Modeling of Six Lists Victims of Trafficking in Persons in the Netherlands, 2014
As an alternative, we used the parametric bootstrap to simulate the chi-squared distribution, and determined the p-value of the model as a percentile in the simulated distribution. The procedure we used is to simulate 20,000 random samples under the model to estimate the distribution of the Pearson chi-square, and assess how the chi-square for the model related to the distribution. This is revealed by the p-value.
For example, for the third model, the Pearson value of only approximately 1,300 samples was larger than the Pearson value of 66, showing an adequate fit (5% of 20,000 is 1,000, so 1,300 is not statistically significant based on standard procedures).
A first analysis looked at a model assuming independence of all lists (Model M1). This model showed an inadequate fit (the p-value is smaller than .05). In subsequent models, interactions have been fitted between the NGOs and Others, and between the Labor Inspectorate and Others. Models M2 and M3 showed better fits (with p-values above .05). Models fitting more interactions proved to be overfitting: They were more complicated than necessary to describe the data well.
The fit of model 3 is adequate, and the p-values of models 4 and 5 are not substantially better. Therefore, we ignored models 4 and 5. The preferred model was the one fitting the interactions between the NGOs and Others, and between the Labor Inspectorate and Others (model 3).
As can be seen, the preferred model 3 gives an estimate of 17,800 victims. Of these 17,800 victims, 1,560 have been recorded by COMENSHA. The estimate suggests that roughly 10% of all victims are detected; in other words, that there are 10 times more victims in the Dutch territory in the course of a year than are recorded. The 95% confidence interval ranges from approximately 14,000 to 23,900.
A Model with Six Records, Three Covariates, and Data from Six Years
As discussed above, the agreed-upon statistical indicator for Sustainable Development Goal 16.2 of Eliminating Human Trafficking/Forced Labor consists of the number of detected and undetected victims per 100,000, disaggregated by gender, age, and type of exploitation. The proposed disaggregation serves to inform policies of the organizations involved.
Female victims of sexual exploitation are typically identified by border police units, specialist police squads, and NGOs running shelter homes. Victims of forced labor will mostly be identified by labor inspectorates or NGOs advancing migrant rights. Child victims can be detected by a variety of organizations, including child welfare and protection agencies.
The disaggregation of estimated numbers of undetected victims by gender, age, and type of exploitation not only serves important policy purposes, but also can improve the estimates themselves when MSE is used. A well-documented complication of the MSE method is that the likelihood of people to be listed can vary across subgroups of the population. If these subgroup probabilities are structurally different, it violates the condition of homogeneity of inclusion chances.
In such cases, estimates based on average probabilities might result in erroneous estimates. In the case of human trafficking statistics, it is plausible, for example, that male victims of forced labor have different capture probabilities from victims of sexual exploitation, since different sets of organizations are involved in their identification.
The condition of homogeneous inclusion probabilities on at least one of the lists can be approximated by stratification of the analysis according to relevant covariates. If, for example, certain categories of victims are more likely to be recorded than others, separate estimates can sometimes be made for each of these two groups of victims. For policy purposes, the COMENSHA databases include the covariates age (minor or adult), gender, and type of exploitation experienced by the victim (sexual services, forced labor, forced criminality, and unknown).
COMENSHA’s annual reports on detected victims break down the numbers by these variables. In a second round of estimations of undetected victims, using the same six lists of presumed victims described above, we have incorporated the covariates, male-female, adult/minor, and sexual exploitation versus other types of exploitation in the loglinear models. To explore changes over time of the estimated numbers of undetected victims, we have also incorporated data on presumed victims from six consecutive years, 2010–2015. The models use data for a total of about 8,234 presumed victims.
We used the same lists as before: P = Police; R = Regional Coordinators (COMENSHA); K = Border Police; O = service-providing NGOs; I = Labor Inspectorates; Z = Others (youth care and law firms). The model selection procedure is basically the same as for the models presented in Table 2, but with the additional variables of age (L), sex (S), exploitation (U), and year (Q). The variable Q comprises five polynomial variables from the first to fifth degree, which model potential trends in the interactions between the registers and covariates over the years.
In the STEP procedure, we referred the BIC over the AIC as the selection criterion, because the BIC offers better protection against overfitting when the sample is relatively large. Additionally, only two-factor interactions were allowed to enter the model. The reason for this restriction is that many pairs of registers show little to no overlap over the six-year period, and the three-factor interaction parameters for these pairs and the variable Q are numerically unstable, resulting in highly inflated population size estimates and confidence intervals.
In this case, when we evaluate the fit by empirically generating the distribution of the Pearson chi-square statistic using the parametric bootstrap with 20,000 samples, it turns out that the STEP procedure selects a model that may be underfitting: The p-value is .025. However, the observed n—8,234—is rather large, and it is well known that with such a large n, even minor misspecifications make a test for model fit significant. Therefore, we do not rigorously apply the 5% criterion but report the current model because its fit is adequate in the light of the large n.
The model selected as the most parsimonious had the following parameters:
KP, OZ, KR, PZ, KZ, RZ, PS, KO
IL, IS, IU, OL, KS, KL, KU, OS, ZS, PL, OU, PU, RU, RL
SU, SL, LU
IQ, RQ, OQ, KQ, ZQ, UQ, LQ
The first row shows the interactions between registers, the second row the interactions between the registers and covariates, the third row the interactions between the covariates, and the last the interaction between registers and covariates on the one hand and the years on the other.
Results
The results showed, with few exceptions, stable distributions over the possible pairwise combinations between the lists. Figure 1 shows the trend in detected victims recorded by COMENSHA and the estimated numbers of undetected victims. The 95% confidence interval among the estimates is depicted in light red.
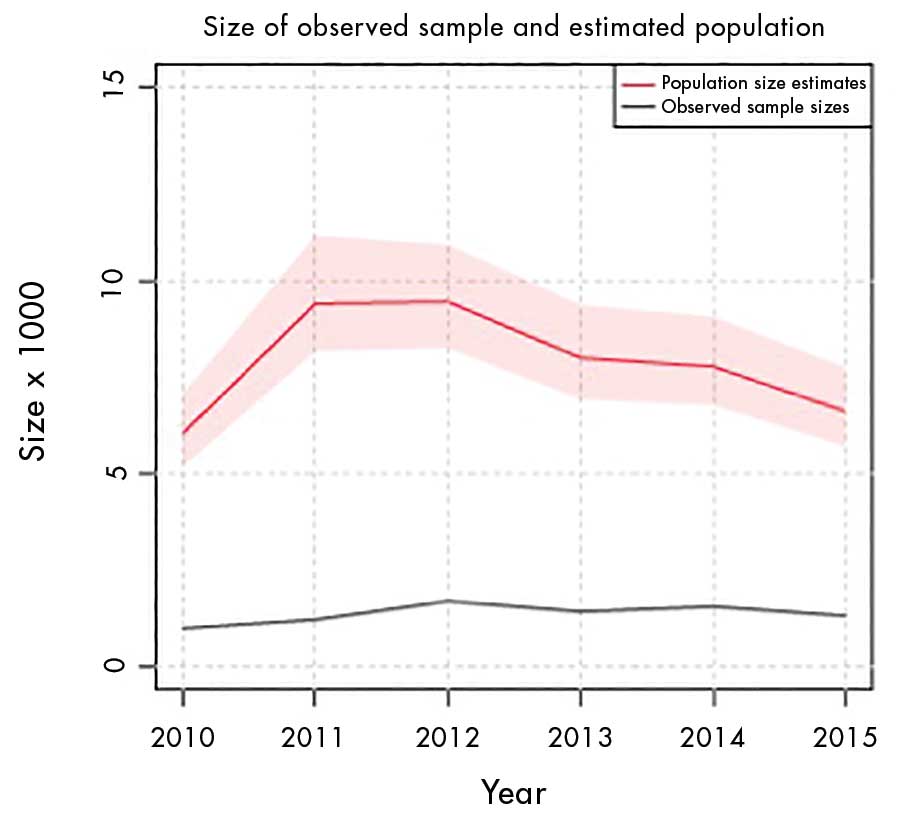
Figure 1. Trends in detected victims and estimated totals of victims in the Netherlands, 2010–2015.
The number of detected victims depicted at the bottom shows a curvilinear pattern peaking at 1,500 in 2012. The estimated numbers of all victims are five times higher or more. The trend line of estimated total victims does roughly, but not fully, mirror the trend in recorded cases. Unlike the recorded numbers, the estimates numbers peaked in 2011 and declined between 2013 and 2014.
As discussed, the earlier one-year model without covariates produced an estimate for 2014 of 17,800, with confidence intervals between 14,000 and 23,900. The latest, richer and more-complex, model estimates the total victims in 2014 at around 8,000. The new estimate is, thus, considerably lower than the older estimate and falls outside its confidence intervals. The difference is explained by including both more years and the use of covariates in the new model.
A replication of the five-year model without covariates produced estimates per year that differed considerably from those of the full model. For 2014, the new estimated number was 10,500. For this year, the model without covariates produced a higher estimate than the fuller model.
Table 3 presents the estimates disaggregated by gender, age, and type of exploitation.
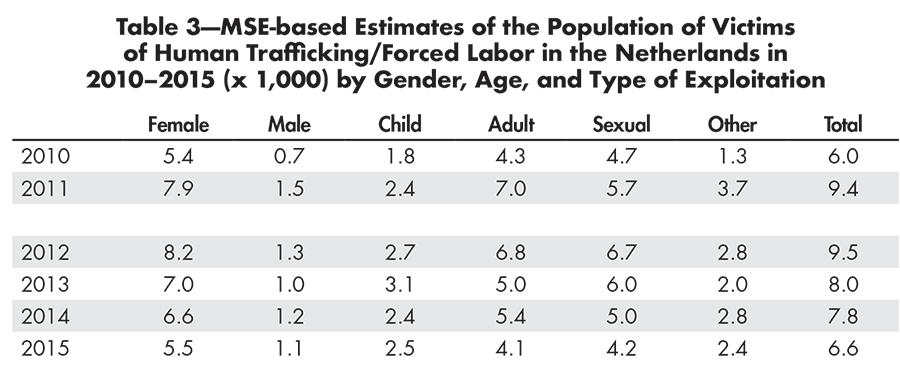
Table 3—MSE-based Estimates of the Population of Victims of Human Trafficking/Forced Labor in the Netherlands in 2010–2015 (x 1,000) by Gender, Age, and Type of Exploitati
The results given in Table 3 point to a strong and stable overpresentation of female victims. Since 2012, the number of female victims has declined more strongly than that of males. The relatively small number of estimated child victims has increased somewhat since 2010. The number of victims of other, non-sexual exploitation has also gone up since 2010.
The distribution according to gender overlaps strongly with that of type of exploitation, with males rarely falling in the category of sexual exploitation. Figure 2 shows trends in estimates of presumed victims of sexual and nonsexual exploitation disaggregated by age. The numbers depicted in this figure add up to those shown in Figure 1. The 95% confidence intervals are depicted in shaded colors.

Figure 2. Trends in estimated totals of adult and child victims of sexual and nonsexual exploitation in the Netherlands, 2010–2015.
Figure 2 shows different trends for the estimated numbers of four categories of presumed victims. Estimated victims of sexual exploitation, mostly comprising females, peaked in 2012. Adult victims of nonsexual exploitation peaked in 2011. The numbers of estimated child victims of both sexual and nonsexual exploitation—that is, trafficking for forced beggingn—show less-pronounced changes over time since 2010.
Discussion
The present study builds on the exploratory MSE by Silverman and Bales (2013) of the total of presumed victims in the United Kingdom, based on data collected by various organizations, and our own similarly exploratory estimation of the number of presumed victims in the Netherlands recorded in 2014.
Our new model includes all recorded victims over a period of six consecutive years (2010–2015). Since the United Nations Monitoring Framework for the Sustainable Development Goals, adopted last year, recommends the collection of statistics on total numbers of presumed victims disaggregated by gender, age, and type of exploitation, we have estimated the numbers of victims in 2010–2015 in the Netherlands per year disaggregated by gender, age, and type of exploitation.
For this purpose, we fitted loglinear models to the integrated, multi-year data set of 8,234 victims reported to COMENSHA by six different categories of organizations.
Our estimates of the total numbers of victims show a curvilinear trend from 6,000 in 2010 to 9,400 and 9,500 in 2011 and 2012, respectively, and a drop back to 6,600 in 2015. This trend does roughly mirror the movement in recorded victims, which peaked in 2012. The upward trend in recorded numbers in 2012 has been commented upon by the National Rapporteur (Reporter) on Human Trafficking in her annual report of 2016. This change seems to have had many different causes. It is partly also explained by the fact that the Dutch Border Police considerably stepped up its efforts in that year to identify people at the border showing any signs that they might have been trafficked. The latter identified potential victims.
The identified potential victims included people who have been assisted in crossing borders to be engaged in commercial sex work. Such people may qualify as victims of trafficking for the purpose of sexual exploitation, but they also include people who voluntarily engage in such work without necessarily being exploited. The inclusion of the latter people in the recorded numbers of presumed victims of THB is likely to have resulted in somewhat inflated numbers of estimated totals in these years. In that sense, the peak may reflect, at least partly, a change in the definition of the population.
This likelihood is confirmed by the empirical observation that people counted on the list of the Border Police show relatively very few matches with those recorded on the other lists. Since 2013, the Border Police have, in consultation with the National Rapporteur, started to apply more-restrictive indicators of presumed victims. As a result, their numbers of reported cases have consequently fallen drastically. This change in the recording policy by the Border Police explains the sudden downward trend in recorded cases after 2012, a fall reflected, although somewhat muted, in the estimated totals.
Given the probably somewhat-inflated nature of the estimates of 2011 and 2012, the best available estimates of the total number of presumed victims of human trafficking in the Netherlands seem to be the estimates for 2014 and 2015 (7,800 and 6,600 respectively). This means that the estimated number of presumed victims of human trafficking in the Netherlands per year varies around 7,000 victims. Since approximately 1,400 presumed victims per year were recorded in 2014 and 2015, the estimated totals in the Netherlands are five times higher than the recorded numbers.
Such a ratio between total figures and detected figures is not dissimilar to the one found in research into other types of hidden crime, such as domestic violence, and also comes close to the one reported by Silverman (2014) for the United Kingdom.
Since our new estimate for 2014 is higher than the older estimate of 17,500 based on a model without covariates, our findings suggest that including covariates such as age and type of exploitation in MSE models using data on victims of human trafficking/forced labor does—as expected—lead to different estimates, and is therefore to be strongly recommended in future work.
Our results show, furthermore, that MSE using data on victims recorded by different organizations can produce stable estimates of the total number of victims, disaggregated by gender, age, and type of exploitation. In all years, female victims s of sexual exploitation made up the largest part of the estimated total numbers, but these numbers have declined considerably since 2012, due in part to stricter recording policies of the Border Police. The proportion of male victims of nonsexual exploitation and the number of estimated child victims of both sexual and nonsexual exploitation showed a small increase.
With a view to monitoring the United Nations Sustainable Development Goal 16.2, we can report that in the Netherlands in 2014–2015, an estimated 4 individuals per 100,000 inhabitants per year have been (presumed) victims of human trafficking. Of those, 3 were female, 1.5 a child/minor, and 1.5 a victim of nonsexual exploitation.
Further Reading
Bales, K., Hesketh, O., and Silverman, B. 2015. Modern slavery in the UK: How many victims? Significance 12(3), 16–21.
Kangaspunta, K. (ed.). 2015. Special issue: Researching hidden populations: approaches to and methodology for generating data on trafficking in persons (PDF download), Forum on crime and society (8). New York: United Nations.
Nationaal Rapporteur Mensenhandel en Sexueel Geweld tegen Kinderen. 2016. Monitor Mensenhandel: cijfers mogelijke slachtoffers, 2011–2015, Den Haag: 30-8-2016 (National Rapporteur on Human Trafficking and Sexual Violence against Children, Monitor Human Trafficking: figures on possible victims, 2011–2015).
Silverman, B. 2014. Modern slavery: an application of multiple systems estimation. Gov. UK.
Van Dijk, J.J.M., and van der Heijden, P.G.M. (2016). Research Brief. Multiple Systems Estimation for estimating the number of victims of human trafficking across the world. Vienna, Austria: UNODC.
About the Authors
Maarten Cruyff, PhD works in the Department of Methodology and Statistics at Utrecht University, and specializes in population size estimation and randomized response.
Jan van Dijk, PhD is emeritus professor of victimology at the International Victimology Institute of the University of Tilburg, the Netherlands, and vice president of the Group of Experts on Action against Trafficking in Human Beings (GRETA) of the Council of Europe. In 2012, he received the Stockholm Prize in Criminology.
Peter G.M. van der Heijden, PhD is professor of statistics for the social and behavioral sciences and head of the Department of Social Sciences at Utrecht University, the Netherlands. He is also professor of social statistics at the University of Southampton, UK.


