
The Relationships Between Statistics and Other Subjects in the K–12 Curriculum

Sixty years ago, statistics barely touched the school experience of a typical student. In the study of social science, students might encounter data. In a science laboratory experience, students might collect data. In a mathematics classroom, students would be expected to know how to calculate the mean of a set of numbers. In contrast, today it is becoming prevalent to expect increasing numbers of students to learn several measures of central tendency and spread, to encounter theoretical and actual distributions, and to discuss topics such as randomness, statistical tests, and statistical significance that in the past were introduced at the college level. As one of the mathematical sciences, the study of statistics in grades K–12 naturally has been considered as a part of the school mathematics curriculum. This has great advantages, as mathematics is the second most important academic school subject, behind reading and language arts. But as statistics has become more important, its connections with everyday literacy, science, health, and the social sciences suggest teaching statistics across the curriculum in addition to a reconsideration of its relationships with mathematics.
The views in this article stem from three premises. The first is a truism to most who will read this article. Statistics are found and applied today in almost every domain of human activity. However, the second premise is probably not believed by all readers of this article. The fundamental ideas of statistics, including variability, randomness, the laws of probability, and so forth, are accessible to virtually all students. Even if you think not all students can learn the basic ideas of statistics, I believe school policy should operate as if they can, and give everyone the opportunity. The third premise comes from the Guidelines for Assessment and Instruction in Statistics Education (GAISE) K–12 report of the American Statistical Association. “Every high-school graduate should be able to use sound statistical reasoning in order to cope intelligently with the requirements of citizenship, employment, and family, and to be prepared for a healthy, happy, and productive life.”
In most places in the world, despite wonderful strides over the past generation, it is not currently the case that all high-school graduates are familiar with the tenets of sound statistical reasoning, let alone able to use them. In many places only a small minority of students are exposed to these ideas. Statistics is not a traditional subject at the K–12 level.
The basic issue that I attempt to treat here is how and where we should teach statistics when there are so many other subjects competing for student time. My approach to the answer is somewhat historical—looking at the past, observing the present, and looking to the future to sustain and grow our subject. It is, for the most part, an American perspective.
A half-century ago (and still in many school situations), the answer to this question was simple. Statistics was viewed as a branch of mathematics like algebra or geometry, so statistics was taught within mathematics (Figure 1). This view is reflected in the Trends in International Mathematics and Science Study (TIMSS) and its predecessors, and in the U.S. Common Core State Standards Initiative. In this view, we teach statistics within the time frame that is allocated to mathematics. Statistical formulas involve mathematics, so why would anyone not think of statistics as a part of mathematics?
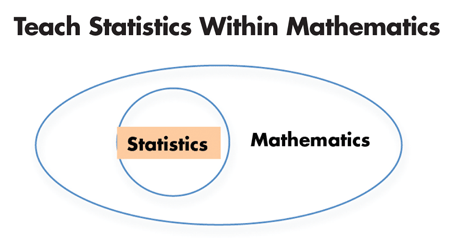
Figure 1. Statistics within mathematics
Statistics is in many, if not most, schools a relatively new area of study in the curriculum. On the other hand, mathematics is a fixture of the K–12 curriculum. The school day is limited in time, and there is competition for the time that is available. If we fit statistics within mathematics, although we have to compete with other areas of mathematics, we do not have to carve out a separate time in the day for statistics.
Mathematics is tested everywhere. So it is taught everywhere. Topics that are not tested are easy to omit, and it is difficult to build on previous years’ work if you cannot be certain that this work was actually taught. So, if we place statistics within mathematics, we can be more confident that statistics will be tested and taught.
The view of statistics as a branch of mathematics is the view of statistics that I was educated to have (and which is still a very popular view not only of those involved in K–12 education but also in many collegiate mathematics departments). When I went to school in the 1950s, very little statistics was taught in mathematics courses in grades K–12 in the United States. By the end of grade eight, a student could expect to have seen bar graphs, circle graphs, and line graphs, but the notion of collecting your own data for such graphs was absent. The only statistical measures taught were the mean and median. In grades 9–12, non-college-intending students would likely see these topics reviewed, but college-intending students would see no statistics in their mathematics courses and no statistics outside those courses, either.
Through my undergraduate career as a mathematics major and a statistics minor, all of the statistics courses I took were inside a mathematics department. I never saw a data set. In graduate school, though I used the statistics commonly found in the educational field, such as hypothesis testing with t-tests, analysis of variance, and the like, these were taught as statistics for specialists and not viewed as the kind of stuff you would learn before college.
I have believed strongly that all students need to encounter a significant amount of statistics in their schooling, starting in the earliest grades, and the most likely way that students would encounter this content would be to embed the content within the mathematics curriculum and not to teach statistics in separate units that could easily be omitted. Reflecting this view, in my curriculum work for more than 40 years I have tried to match traditional topics in the mathematics curriculum with related ideas from statistics, and going in the opposite direction, looked at basic ideas from statistics for the mathematics involved in them.
Table 1 shows a number of traditional mathematics and statistics topics that go together. In our curricular work, we have either presented these side by side, or one after the other, or used one as preparation for a later discussion of the other. Making these connections overt not only assists the learning of both the mathematics and the statistics, but serves to make it more difficult for the mathematics teacher to gloss over or skip the statistics.
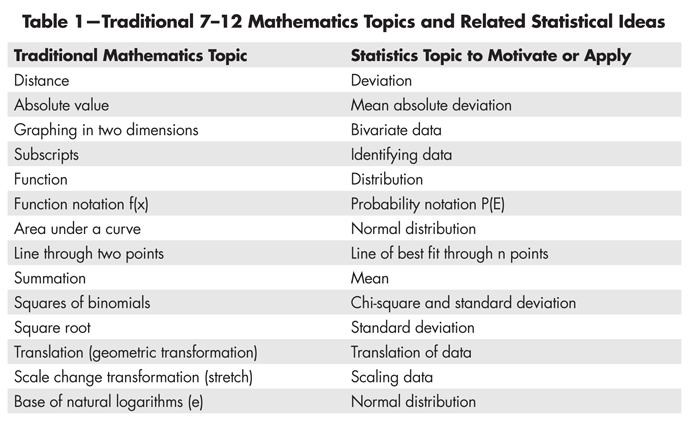
Table 1—Traditional 7–12 Mathematics Topics and Related Statistical Ideas
There is nothing particularly inventive about finding these connections, but teaching them together often requires careful thought and raises non-trivial questions. For instance, consider an easy connection. Euclidean geometry tells us that there is exactly one line through two points, and, if those points are identified on a coordinate plane, it is a standard algebra topic to find an equation for that line. It is appropriate mathematical thinking to ask: What about finding an equation of a line through three points? Typically those three points will not lie on the same line, so what about finding an equation of a line that is closest to the three points? It is a beautiful and natural way to get into the line of best fit, and it generalizes to n points as we all know.
However, the algorithm for finding the line of best fit is not at all like the algorithm for finding the equation of the line through two points. In grades 8–10, the line of best fit cannot be obtained with the same sort of attention to understanding the algorithm as the line through two points. Furthermore, the geometry is not the same. Why do we examine the square of the vertical distance from a point to a line rather than just the perpendicular distance from a point to a line? Why is the line of best fit for n points (x,y) usually not the same as the line of best fit for n points (y,x), that is with the points with coordinates switched? The geometry has different criteria for distance than the statistics, where a level of prediction is involved, and predicting y from x is quite different from predicting x from y (Figure 2).
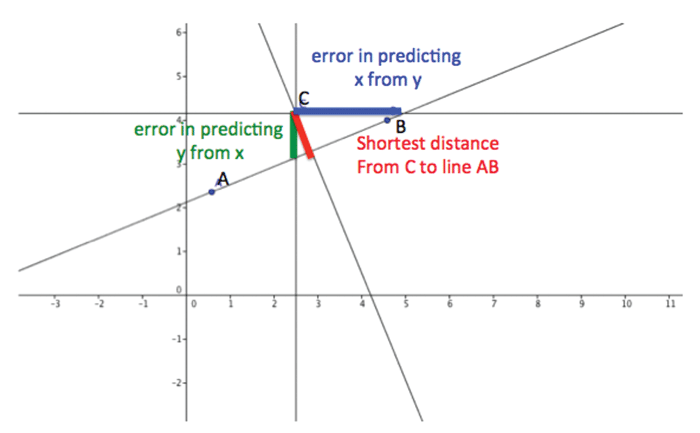
Figure 2. How close is C to the line through A and B?
Sometimes there are surface connections between the mathematics and the statistics that are not easy to explain, such as why e, the base of natural logarithms, is the base of the exponential expression in the formula for the normal distribution.
On the other hand, there are times when the statistics can precede the corresponding traditional mathematics topic. The idea of mean absolute deviation can precede the introduction of absolute value and distance between two points on a number line. That is, the statistics idea can motivate the mathematical idea. At other times, more than motivation is involved. Subscripts to identify student scores on a classroom test as s1, s2, and so on, are easier for students to grasp than the traditional x1, x2, y1, y2 that are—at least in the United States—traditionally introduced when formula for the slope (gradient) of a line is to be studied. Why is it easier? I think it is because when there are scores s1, s2, s3, … s25, the subscripts make it obvious that these identify 25 scores, but when there are only the two subscripts x1 and x2, the naïve student confuses the subscript with the exponent and looks to do some sort of calculation with the 1 and the 2.
At still other times, the traditional application of an idea and a use of the idea in statistics are quite complementary, helping each other out. Scaling data and scaling graphs of functions and relations involve the same mathematics. The formula for standard deviation helps students to realize that square roots are found in other places besides right triangles.
The examples in Table 1 are from the grades 7–12 experience, but there are numerous connections between statistics and the mathematics of earlier grades, some of which are in Table 2.
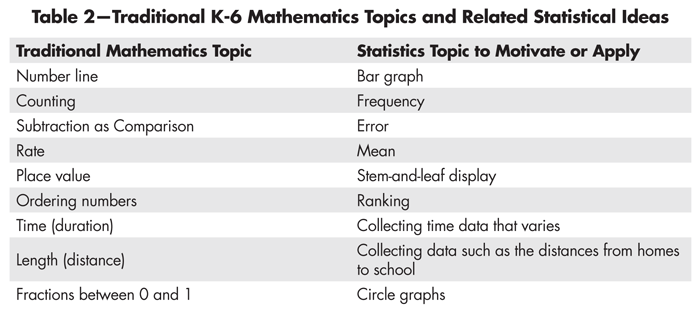
Table 2—Traditional K-6 Mathematics Topics and Related Statistical Ideas
All in all, the many places in which the mathematical ideas in statistics can be associated with topics in the traditional mathematics curriculum are quite fruitful for the teaching not just of statistics, but also for the teaching of traditional mathematics. And it has been a major impetus for introducing some statistics into the curriculum.
But how well does statistics fare in an environment where it competes with other mathematical areas, such as arithmetic, algebra, and geometry?
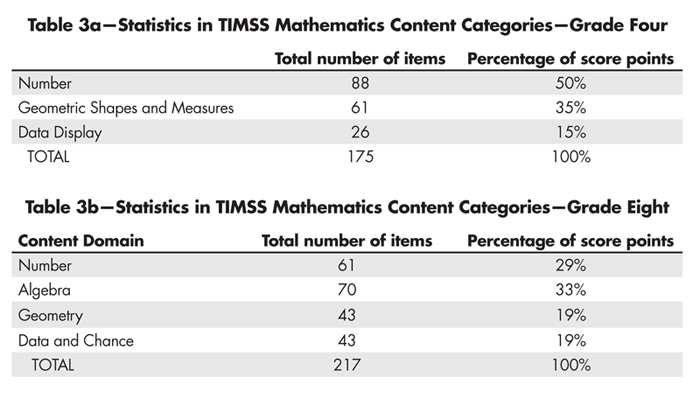
Consider the most recently published TIMSS, from 2011 (Tables 3a and 3b). At grade four, data display items constitute 15% of the total score points available. At grade eight, data and chance items constitute 19% of the total score points available.
For another comparison, consider the Common Core State Standards in the United States. At grades 9–12, the number of standards in statistics and probability is about 20% of all standards; at grades 6–8 about 23%, and at grades 1–5 about 5%. Except for grades 1–5, this is an extraordinary inroad into a mathematics curriculum in the United States that in the past has tended to be very traditional and difficult to change. It is hard to imagine the mathematics curriculum giving much more attention to statistics—except at grades 1–5, where the Common Core has simply missed the boat.
A second way to view statistics in the K-12 curriculum is as applied mathematics (Figure 3). Teaching statistics as applied mathematics recognizes that, like other areas that we identify as applied mathematics such as operations research, computer science, mathematical biology, or even physics, the issues and problems statistics treats originate from outside mathematics and are not taught simply because we think it is nice for students to learn about ideas such as center, spread, variability, and distribution.
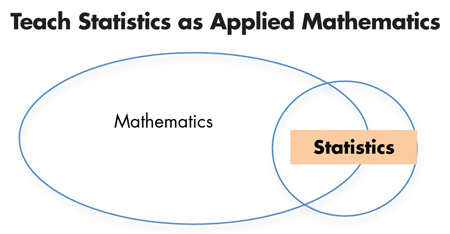
Figure 3. Statistics as applied mathematics
The process of mathematical modeling used in applied mathematics has often been depicted in a diagram similar to the one shown in Figure 4.
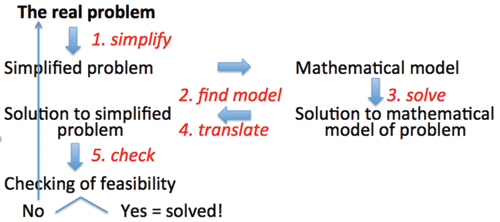
Figure 4. The modeling process
In the modeling process, the basic idea is that one goes from the “real world” into the “world of mathematics,” works with the model in the mathematical world, and then goes back out to check with reality.
How does teaching statistics as applied mathematics differ from teaching statistics within mathematics? In teaching a statistical idea within mathematics, the motivation for the idea might come from a mathematical idea that we wish to reinforce. For instance, we might introduce the idea of mean absolute deviation just after or just before we teach absolute value, and examine the idea for its theoretical properties without much concern for the application. But if we are to teach mean absolute deviation as applied mathematics, then the problem needs to arise from outside mathematics. So we look for one or more real situations in which the concept of spread is meaningful. (The modeling process is somewhat similar, but certainly not identical, to the four–step “investigative process” described in GAISE: formulate questions, collect data, analyze data, interpret results.)
One of my favorite modeling problems for grades 6–9 is to examine the question of when a person should leave from home to the nearest airport in order to be on time for a flight. Let us suppose that the departure time for a plane flight is 10 o’clock, a person is driving to the airport, and he or she will leave a car there. Let L be the time to leave. Call the departure time D. So D = 10. We can identify some variables. Let G be the length of time before departure you want to be at the gate. Let T be the time to travel from home to airport, and let P be the time to park the car. Let B be the time for getting a boarding pass, and let S be the time it takes to get through security. It seems like this problem is a pure subtraction problem, working back from 10. We have a simple mathematical model:
L = D – G – T – P – B – S = 10 – G – T – P – B – S = 10 – (G + T + P + B + S).
Statistics in this model comes from the fact that T, P, B, and S all vary! The travel time T from home depends on the route and the traffic. If someone else drives you to the airport, then P = 0. If you print your boarding pass from home and do not check bags, then B = 0. The security time S may range from a few minutes to 30 minutes or more.
The problem begs for some actual data. How does T vary? With Google Maps or MapQuest or other travel time software, today it is possible to collect data about travel times on various routes over a period of days without having to do the travel. It is also possible and would be interesting to collect data on the length of time S it takes passengers to get through security at the airport nearest one’s home. For both T and S, we would be particularly interested in measuring the spread of the distribution of times. Measures of spread become appropriate because of the need to factor in a person’s tolerance for risk, and provide one way to approach mean absolute deviation and other measures of spread.
As nice as so many examples like this one can be in a mathematics classroom, there are problems with approaching statistics either as a subfield of mathematics or applied mathematics. The mathematics curriculum is crowded; it is not a curriculum with loads of room begging for topics to fill it. Many mathematics teachers are uncomfortable with the lack of certainty and the need for judgments arising from statistical situations, and with statistics in general. Even statistical units within mathematics courses tend to become devoured by other mathematics.
However, perhaps the most difficult problem of incorporating statistics within mathematics is that statistics has its own body of knowledge separate from mathematics. It is difficult to incorporate into traditional algebra, geometry, or analysis (1) questions of sample selection, (2) more than the simplest kinds of exploratory data analysis, (3) the interplay between the degree of confidence in a statistic and the length of the confidence interval, and (4) many other rather basic ideas of statistics—even mathematical ideas— that take some time to develop. As a result, within the traditional school mathematics curriculum, one can develop a taste for statistics, discuss basic notation and some language, and show how one needs mathematical knowledge to treat statistics, but for intense study, statistics needs its own courses even at the pre-college level (Figure 5). (Several curriculum projects in the United States, including Core-Plus, Connected Mathematics, and my own University of Chicago School Mathematics Project, have successfully incorporated a substantial amount of statistics into their materials, but in my opinion this is not equivalent to the kind of attention that can be given when the course is devoted solely to a study of statistics.)
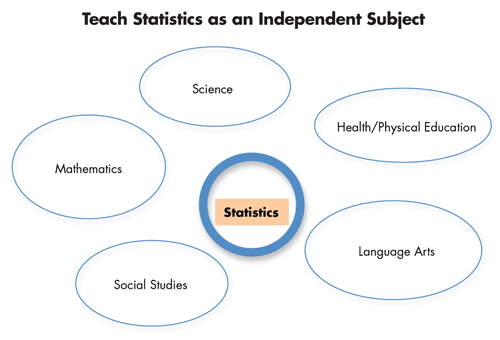
Figure 5. Statistics as an independent subject
At the college level, the idea of treating statistics separate from mathematics or applied mathematics gained some traction after World War II. In the United States, the first statistics department was formed at North Carolina State University in 1941 by Gertrude Cox, and soon thereafter departments were initiated at Columbia University in 1946, at Chicago in 1949, and at Harvard in 1957. Perhaps this has been more a U.S. phenomenon because it took until 1988 for Oxford to have a department of statistics. At the same time, many other colleges and universities broadened the name of the mathematics department to “mathematics and statistics,” “mathematical sciences,” or even “mathematics, computer science, and statistics.”
Shortly after the department of statistics at the University of Chicago was created, perhaps to emphasize the difference between statistics and mathematics, two of its faculty, Allen Wallis and Harry Roberts, described statistics in a way that does not mention mathematics. They wrote, “Statistics is a body of methods for making wise decisions in the face of uncertainty.” This view of statistics was quite a departure for its time. They continued, “This modern conception of the subject is a far cry from that usually held by laymen. Indeed, even the pioneers in statistical research have adopted it only within the past decade or so.” Today, instead of “uncertainty,” which invokes immediately the mathematical idea of probability, the word “variability” is more commonly used. It serves better in distinguishing statistics from mathematics.
The view of statistics as its own body of knowledge, related to but separate from mathematics, dominates many introductory courses at the college level today. It is reflected in the simple description of statistics found in one popular college textbook, by Yates, Moore, and Starnes: “Statistics is the science of data.”
The GAISE Report emphasizes this break from mathematics when the authors assert, “A major objective of statistics education is to help students develop statistical thinking. Statistical thinking, in large part, must deal with this omnipresence of variability; statistical problem solving and decision making depend on understanding, explaining, and quantifying the variability in the data. It is this focus on variability in data that sets statistics apart from mathematics.”
This position of statistics relative to mathematics is somewhat like that of physics relative to mathematics. It is impossible to do much physics without knowing mathematics, and it could be said that physics is the application of mathematics to the study of matter and energy and their interactions with various forces. Yet there is so much to physics that is not mathematics. Because of this, physics is studied as a subject in its own right, not as a part of a mathematics course.
This belief in statistics as its own field of study in high school, separate from mathematics, began to take hold in the United States within the last generation. In 1990, only 1% of high-school students graduated with at least one semester of statistics; by 2009, 11% had. This compares with 35% who have credits in pre-calculus mathematics, and 16% with at least one credit in calculus.
These increases go along with increases in participation in the Advanced Placement (AP) program, through which students take the equivalent of selected college courses in high school and are given national tests on each course. The AP program began in 1955, and calculus was there from the beginning. The AP program in statistics began in 1997, and since the year 2000, the number of students taking the exam has increased by about 10% a year (see Table 4). By the 2012–13 school year, the most recent year for which data has been published, almost 170,000 students, or about 5% of all high-school graduates in the United States, were taking the AP statistics exam, and perhaps an equal number are taking the course without taking the exam.
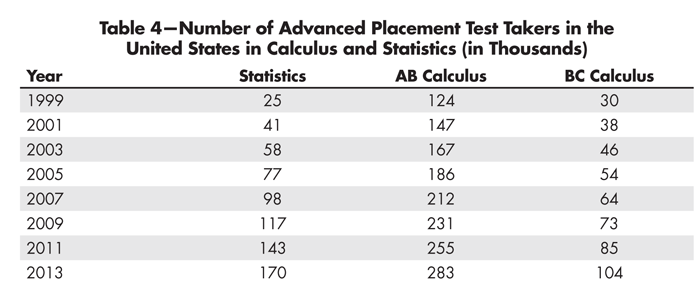
Table 4—Number of Advanced Placement Test Takers in the United States in Calculus and Statistics (in Thousands)
When the AP statistics exam was first offered, I am certain there were those who felt that enrollments in the AP calculus exam would fall. But, as the data in Table 4 show, the increases in AP statistics have not come at the expense of taking AP calculus. Since 2005, each year more students in the United States have been enrolled in calculus courses in high school than in college.
But these are college-level courses even if taught in high schools. Full courses devoted to statistics at the high-school level for all students seem to be less common. Furthermore, by including statistics as part of the Common Core standards in the United States, the movement for a separate course may have been slowed down, thus reducing the amount of statistics available to high-school students, and slowing down the inclusion of newer statistical ideas such as Big Data.
Nevertheless, the history of school mathematics around the world is that the content we teach now to students in primary and secondary schools used to be taught to much older students. New content often appears first at the college or advanced secondary level, and then filters down over the years, decades, and centuries. So it has been with arithmetic, algebra, and geometry, and so it is with statistics. It is quite likely that within a couple of generations most of the content of the course in introductory statistics at the college level will filter down to become standard school content.
At the same time that the movement toward statistics courses in secondary school was beginning, there was a concerted movement to reach students who in the past dropped out of their study of mathematics quite early in schooling, say after grade nine. In the United States, the slogan was embodied in the title of the 1989 National Research Council report “Everybody Counts.” Worldwide there were the mantras “Mathematics for all” and “Algebra for all.” Into this arena arrived “Statistics for all.”
In the same year as “Everybody Counts,” the view that statistics is important in the early grades was represented in a UNESCO publication based on presentations at the International Conference on Teaching Statistics (ICOTS)-2. A strong theme of this publication was “Statistics for All,” with articles on the exploration of data, quantitative literacy, and many other interesting contributions.
It is significant that these themes were laid out before the first public access to the Internet in 1990, before public email, before Facebook and other social networks, before mobile phones and apps—that is, before the accessibility of data to everyone and before Big Data. In the work of these and many other people, we see the move to introduce the collection and discussion of data early in primary school, and the desire for grades 6–8 to be a particularly useful time for introduction of more formal statistical concepts. As the years go on, we see more and more confirmation of the belief that, because data is present everywhere, the study of statistics has implications for the study of virtually all other disciplines.
This is nothing new about teaching statistics at higher levels. But as the years have gone on, consideration has been given to teaching statistics across the curriculum to younger and younger students (Figure 6).
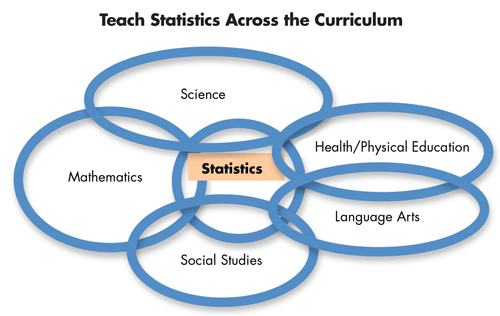
Figure 6. Statistics across the curriculum
Even at the earliest grades, a strong case can be made for treating some basic statistical concepts inside disciplines other than mathematics. First, it is important for all students to learn reasons for statistics early, and these reasons are imbedded in the understanding of other subject areas. Second, statistics has different associations with the major subject areas of early education. Third, particularly in the early grades, in most places many of these subjects are taught by the same teacher, making cross-subject teaching easier to implement.
Here we are speaking of students ages 6–12. The school curriculum for those students consists mainly of language arts (reading, writing, speaking), mathematics, social studies (history, government, geography, economics), science (physical science, earth science, biological science), and health and physical education. When we think of the school curriculum at these early grade levels, we think of what all people need to know for survival and for citizenship, as well as grounding for more advanced work.
Other subjects may include the study of foreign languages, fine arts, applied arts such as woodworking and cooking, and, in some places, moral and religious education. I cannot make the case for incorporating statistics within all of these areas, but I would like to mention a few ways to support the general theme of statistics across the curriculum in the main subject areas.
Language arts covers the understanding and the use of one’s native language through reading, writing, and speaking. Throughout the world, language arts understandably dominates the school curriculum in the first few grades. In the United States, the time devoted to language arts is two to three times the time devoted to mathematics, the subject receiving the second most attention. It is in language arts that students are expected to attain basic literacy. We want citizens to be able to read and listen with understanding to a fictional story or nonfiction news account, to be able to digest critically the information they hear or see. It is not a coincidence that in the GAISE Report the first reference to statistical literacy concerns what is reported in a newspaper and in other media.
The amount of information in a single issue of a daily newspaper can be staggering. How many numbers are there in a newspaper or on a typical page of the newspaper? This is an interesting statistical question. What do we mean by newspaper? That is, what is the population? How should we select a sample? I decided not to do a statistical study and just examine one day’s newspaper and count all the numbers myself.
I picked what I considered to be a typical day of a large city newspaper that I receive daily: the Thursday, Feb. 6, 2015, Chicago Tribune. I then tried to determine the number of numbers on each of the 64 pages of the main six sections of the newspaper—News, Business, Sports, Arts and Entertainment, Dining, and AutoMart. I did not include 70 pages of advertising inserts.
Now that I had selected the newspaper and the pages, the next question was “What is a number?” Is a word like “first,” or “three,” or “millions” a number? Is a telephone number 10 numbers, four numbers, one number, or not a number at all? Is the score of a football game to be counted as two numbers or one? Table 5 shows some of the decisions I made.
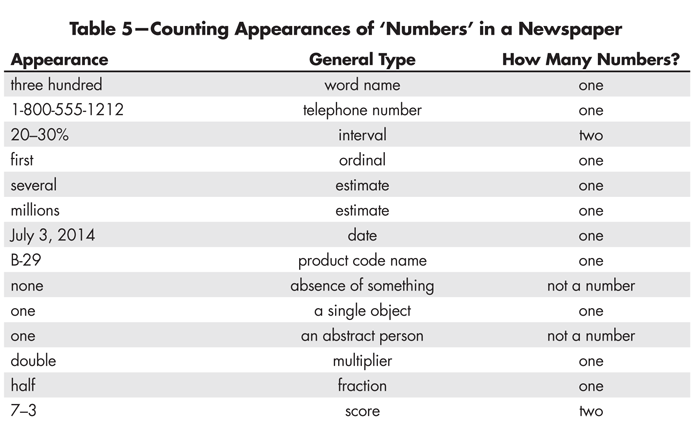
Table 5—Counting Appearances of ‘Numbers’ in a Newspaper
The number of numbers on a page ranged from 13 on the first page of the dining section, a page dominated by a large picture of a dinner plate with food, to 2,278 on a page containing sports results. The total number of numbers was 13,518, so the mean number of numbers on a page was just over 211, with a standard deviation of about 426. The median was 72.5.
Thus there are loads of numbers in this newspaper issue, but are there statistics? Numerical literacy does not guarantee statistical literacy. Fortunately for those who teach statistics, the newspaper is rich with examples of discussion of decisions made based on analyses of data. Here are some examples identified by section-page together with statistical questions the examples might engender for young students. The examples are mostly understandable at early grades. The questions can range from those grades to the college level.
- 1-4: A report on the Chicago area mass transit system includes two maps showing census block areas underserved by mass transit. What is a census block area? Why are the data organized in this way?
- 1-8: A summary of changes in police staffing reports a slew of data: “…the department had 7,078 rank-and-file officers and supervisors assigned to work in its 22 patrol districts as of Dec. 8, a decline of 10%, or 779 beat officers, since fall 2011.” Also included is a bar graph of staffing over the past five years. Why is the time line so important?
- 1-16: Reported are the results of a survey of Hispanic Americans regarding their views on upward mobility in the economy. Unusual is that the actual survey questions and choices given as responses are shown with the percents of the sample who chose each response.
- 1-20: The editorial is about the question of government-sponsored health insurance and the incentive to work, responding to a report from the Congressional Budget Office (CBO) in Washington. The subhead of the editorial is “What’s behind the CBO numbers?” A teacher does not even need to frame the question! What answers are given in the editorial?
- 2-1: The lead article of the Business Section is about the decision by CVS, a major pharmacy chain, to stop selling tobacco products this year. There are graphs of the number of cigarettes sold and the total retail value of cigarettes for each year since 1998, and a circle graph of the distribution of sales of cigarettes in various types of retail stores in 2012. What trends do these show and how did these trends fit into the CVS decision?
- 2-5: Half of a business page is devoted to a summary of the stock market action from the preceding day, with a line graph, three bar graphs, and lots of data about most active stocks, those most held, those with the largest capitalization, and more. How are these data collected? Why are these particular attributes of the data chosen to be presented?
- 3-6: Of course, the sports pages contain a lot of data. One unusual chart is a listing of the top 10 football signing classes—that is, a ranking of the universities that are thought to have recruited the best high-school graduates this year according to the website 247sports.com. The 247sports website is said to have combined several rankings to get the composite ranking shown. How are these ranking systems created? What is the significance of Arrow’s paradox for combining ratings into a composite ranking?
- 3-many: In addition to the results of games, the sports section contains a huge amount of statistics about teams and players. Why are particular statistics displayed? Which statistics are most important?
- 4-1: In the Arts and Entertainment section, the lead article concerns the artwork of a deceased painter whose family wishes to sell his paintings. How does statistics play into the development of asking and selling prices for paintings
- 4-10: The weather page is filled with forecasts, temperatures, amounts of precipitation, some bar graphs about record snowfalls, and more. (Chicago had a relatively severe winter this year.) Since weather varies from spot to spot even within a small geographic area, the numbers can provoke a discussion about their accuracy and variability.
Thus in this single day’s newspaper there is much data available for examination appropriate not only for the early grades of schooling but also later. This demonstrates that both numeracy and statistical literacy are necessary for general literacy, and demands that we promote the teaching of some statistical ideas inside the teaching of language arts, in the areas of critical reading and critical listening. We want to attune students from the earliest grades to ask a number of questions about numbers and statistics. Where did this number or these numbers originate? Is the number an exact value or an estimate? If an estimate, how might the estimate have been determined? What does the number tell us about the situation? How could the value of the number or the reliability of the estimate be verified?
The subtleties of language found in surveys provide wonderful opportunities for the teacher of the native language. In that increased sophistication there needs to be a discussion of how the wording of a survey item can significantly influence a response. When I tell my colleagues who teach literature that people in the mathematical sciences are at least as attuned to the meanings of words and the subtleties of interpretation as are poets and novelists, they typically are surprised. This is a role for the teacher of language, grammar, and writing in the upper grades of schooling.
Why should we who are passionate about statistics education want to encourage putting this content into language arts? It is to show that the collection of data is a normal activity, done by people in all walks of life—in government, in business, in entertainment, in sports, in everyday activities. It is to encourage students to collect data in situations that are pertinent to their lives. It is to counter the notion that statistics are just for those who are good with numbers. It is also to counter the notion that statistics are routinely collected and used for sinister purposes—the all-too-popular notion that people routinely use statistics to lie, a notion perpetuated so often that there is a Wikipedia article titled “Lies, damned lies, and statistics”! When I googled this phrase, I got 263,000 hits.
Now let us move to the social sciences. As ubiquitous as the uses of statistics are in everyday events, so are statistics everywhere in history, geography, economics, and politics—that is, in the social sciences. Even when I was a student over a half-century ago, it was in social studies, not mathematics, that we learned to read bar graphs, circle graphs, and line graphs along with the reading of maps.
What are some broad statistical principles that can be best brought out in social studies? One is the variability within groups and the danger of characterizing an entire group by its central tendency or by a distorted sample of its membership. Long-term and short-term trends over time are often eye-openers for young children, from the human population on our planet to the number of cell phones in use. (A helpful source of data in some countries can come from the CensusAtSchool International project.) The analyses can become more sophisticated than is reasonable for young students; as students go up the grades, their look at social data should become more sophisticated.
Whereas the wording and grammar of opinion surveys are appropriate for language arts study, the intent of an opinion survey is more in the area of social studies. Why are there polls before elections? How do pollsters determine who they poll? How are TV ratings gathered?
The teaching of health and physical education calls for a discussion of statistics about longevity, about what might cause and what might cure disease, and about what data supports a healthy life style. It also begs for a discussion of anecdotal evidence, of the occurrence of events with very low probability for individuals in a large population. On this topic a book has been published just this year by David Hand. Both in health and in the social studies, one can discuss the dangers of extrapolating results from one population to other populations.
I have left science for last because the collection of data in science courses is a long-standing practice. From simulations of Mendel’s experiments with peas to replicating Galileo’s experiments with inclined planes in physics, I think it is the case in many schools that more statistics is taught in science than in mathematics—at least in part because so little statistics is taught in mathematics.
In the United States, statistics is found in all grades K-5 in the Next Generation Science Standards (NGSS), released last year—unlike the situation with the Common Core. Here is a section of the kindergarten NGSS standards:
“In the kindergarten performance expectations, students are expected to demonstrate grade-appropriate proficiency in asking questions, developing and using models, planning and carrying out investigations, analyzing and interpreting data, designing solutions, engaging in argument from evidence, and obtaining, evaluating, and communicating information. Students are expected to use these practices to demonstrate understanding of the core ideas.”
A similar pair of sentences appears in each of grades 1–5, and in each grade these expectations are detailed.
Spanning the Curriculum
Since the 1980s, there has been a movement both at the school level and at the college level called “Writing across the curriculum.” Last month the 12th International Writing Across the Curriculum Conference was held, with speakers from more than a dozen countries (Canada, Sweden, Singapore, Germany, U.S. Virgin Islands, France, UAE, Turkey, China, Qatar, Lebanon, England, Denmark, and the United States). That conference was aimed at the college level, but the school movement has also been quite strong, with the goal of using writing as a learning tool in the various disciplines, as well as recognizing that, in the disciplines, there are characteristic and sometimes unique writing conventions. For instance, writing a mathematical argument is quite different from writing a biography.
Statistics can be viewed as similar to writing in spanning the curriculum. Writing has its home in language arts, and we can say that statistics has a home in mathematics. And just as the style of writing varies depending on the discipline in which it is being used, so does statistics vary.
This is not a new idea. More than 20 years ago, a supplement to the mathematics standards of the National Council of Teachers of Mathematics in the United States was titled “Data Analysis and Statistics Across the Curriculum.” The intent of that supplement was to show that there were examples of data analysis and statistics in a large variety of subjects taught in school.
I think a next step is needed—to discuss examples of statistics use beyond the time allotted for the teaching of statistics into the time allotted for the teaching of the other main subjects in the school curriculum: language arts, social studies, science, and health. We might have our best chance to do this at the lowest grades, where the same person teaches most if not all of these subjects. The recommendations of the SET report, if followed, would go a long way toward ensuring that teachers have the necessary background. If we can accomplish this step, we will have taught students that it is not just for learning statistics that one looks at these examples. Instead, statistics is necessary for learning these other subjects.
Summary
Statistics has at least four places in the K–12 curriculum relative to the other subjects: (1) its traditional place as part of mathematics; (2) a more accurate place as applied mathematics; (3) as the science of data studied for its own sake; and (4) across the other main subjects of the curriculum, inside the teaching of those subjects to help in understanding them. We need to strive in all of these ways to increase the probability that all students will study statistics, whether or not they intend to go on to higher education, in order to reflect its full importance in society, and so that all students will be able to deal wisely with the data that surrounds every aspect of their lives.
Further Reading
Biehler, R. 1989. Educational perspectives on exploratory data analysis. Studies in mathematics education, Vol. 7: The teaching of statistics (PDF download), ed. by R. Morris, 175-176. Paris: UNESCO.
Burrill, G. 1989. Quantitative literacy in the United States. Studies in mathematics education, Vol. 7: The teaching of statistics (PDF download), ed. R. Morris, 175-176. Paris: UNESCO.
Burrill, G., J.C. Burrill, P. Coffield, G. Davis, J. de Lange, D. Resnick, and M. Siegel. 1992. Data analysis and statistics across the curriculum. Reston, Va: National Council of Teachers of Mathematics.
Cobb, G. W., and D. S. Moore. Mathematics, statistics, and teaching (PDF download). The American Mathematical Monthly 104:9 (November 1997), pp. 801-823.
College Board. 2014. Advanced placement program summary report 2013. New York: The College Board.
Common Core State Standards Initiative. 2010. Common Core State Standards for Mathematics.
Dunkels, A. 1989. Exploratory data analysis in the primary classroom—graphing and concept formation combined. Studies in mathematics education, Vol. 7: The teaching of statistics (PDF download), ed. R. Morris, 175-176. Paris: UNESCO.
Franklin, C., G. Kader, D. Mewborn, J. Moreno, R. Peck, M. Perry, and R. Scheaffer. 2007. Guidelines for assessment and instruction in statistics education (GAISE) report: A pre-K–12 curriculum framework. Alexandria, Va: American Statistical Association.
Hand, D. 2014. The improbability principle: Why coincidences, miracles, and rare events happen every day. New York: Scientific American/Farrar, Straus and Giroux.
Lies, damned lies, and statistics. 2014.
Medrich, E.A., and J. E. Griffith. 1992. International mathematics and science assessments: What have we learned? (PDF download) Washington, DC: National Center for Education Statistics.
Morris, R. (ed.) 1989. Studies in mathematics education, Vol. 7: The teaching of statistics (PDF download). Paris: UNESCO.
National Center for Education Statistics. 2013. High school transcript study, 1990 and 2009. In Digest of education statistics 2013, table 225.40. Washington, DC: U.S. Department of Education.
National Research Council. 1989. Everybody counts: A report to the nation on the future of mathematics education. Washington, DC: National Academies Press.
NGSS Lead States. 2013. Next generation science standards: For states, by states.
The Royal Statistical Society. 2005. Teaching statistics across the 14–19 curriculum.
The Royal Statistical Society. 2014. CensusAtSchool International Project.
Scheaffer, R.L., and T. Jacobbe. Statistics education in the K-12 schools of the United States: A brief history (PDF download). Journal of Statistical Education 22:2.
Shaughnessy, J.M. 1992. Research in probability and statistics. Handbook of research on mathematics teaching and learning, ed. D. Grouws, 465-494. New York: Macmillan.
Shaughnessy, J.M. 2007. Research on probability and statistics: Reflections and directions. In Second handbook of research on mathematics teaching and learning, ed. F. K. Lester, 957-1009. Charlotte, N.C.: Information Age Publishing.
TIMSS (undated). TIMSS: IEA’s third international mathematics and science study (PDF download). Released item set for the final year of secondary school: mathematics and science literacy, advanced mathematics, and physics. Boston: Boston College, Lynch School of Education, TIMSS & PIRLS International Study Center.
Wallis, W.A., and H.V. Roberts. 1956. The nature of statistics. New York: The Free Press.
Yates, D.S., D. S. Moore, and D. S. Starnes. 2003. The practice of statistics. Second Edition. New York: W.H. Freeman.
About the Author
Zalman Usiskin is a renowned mathematics educator and director of the University of Chicago School Mathematics Project, the nation’s largest university-based curriculum project for K–12 mathematics, with several million students using its elementary and secondary textbooks and other materials. Usiskin’s book, Geometry: A Transformation Approach has greatly influenced the way geometry is taught. He received a Lifetime Achievement Award from the National Council of Teachers of Mathematics.
In easy terms, if the bid and ask on a binary choice are at
85 and 89, respectively, then traders are assuming a very excessive
probability that the outcome of the binary option will be ‘yes,’ and possibility will expire price $a hundred.