
Data Surfing

Historically, statisticians have held the key to a private beach. We opened the gate for ourselves, walked down to the water’s (data’s) edge, and dipped our toes in. We studied the conditions. We could give reports about the water to anyone who wanted our information. We escorted some outsiders to the water’s edge with us, but mostly it was only statisticians on the beach, and only dipping our toes in, or at most wading in and sampling the vast ocean of data. Occasionally some rowdies jumped the fence under cover of night, but mostly the beach was under control of the statisticians.

Figure 1. A statistician prepares to surf with Big Data.
Illustration by Michael MacWilliams
Today’s world is completely different. A while ago, someone busted the lock on the gate, and the beach is no longer secured, no longer private. There are statisticians still at the water’s edge dipping their toes in, but now there are surfers!
The newcomers have fancy surfboards and they are catching big (data) waves. And having a blast. There are statisticians running around shouting, “Get out of the water! It’s not safe; you’re going to drown!” Most of the surfers seem to be doing just fine, so these dire warnings are ignored. Some statisticians watch all the surfers and wonder why they haven’t been invited to join in. Others are on the beach hard at work crafting their custom-built surfboards. Some are paddling out already (Figure 1). A danger for all is that, indeed, the gung-ho newcomers may not recognize all of the potential hazards in the data ocean. There are sharks, undertows, jellyfish, and more. Statisticians have been studying the data ecosystem for a long time. Our familiarity with hazards, and the protections we’ve developed against them, are essential skills to include in any data science team (Figure 2).
As a statistician, there are many ways to respond to the current situation and advance us all toward a healthier and more sustainable data ecosystem. Not all statisticians need to become educators, but all must improve in educating others on the value a statistician provides. Not all statisticians have to abandon the shore to surf (and, in fact, all should not), but unless more do, the clarifying light that statistics shines on data may be substantially dimmed, and hazards could become more dangerous or have more impact, which will be detrimental to all of us.

Figure 2. Monsters of the deep can be tamed when statistical, computational, and visualization skills are united in one data science team or scientist.
Illustration by Michael MacWilliams
What follows may not be to everyone’s liking, but it is an attempt to present several paths one may take. It is a role-playing game in article form, modeled after the Choose Your Own Adventure® book series. It is not exhaustive; there are far too many alternative paths for one modest article. However, I hope it will prompt each reader to find and take a path that is right for him or her.
Warning!!!!
Do not read this article straight through from beginning to end! It contains different adventures you can go on as you investigate the current state of data, data science, and nurturing statistical thinking before college. From time to time as you read along, you will be asked to make a choice. Your choice may lead to success or disaster!
The adventures you take are a result of your choice. You are responsible because you choose! After you make your choice, follow the instructions to see what happens to you next.
Remember—you cannot go back! Think carefully before you make a move! One mistake can be your last … or it may lead you to fame and fortune!
You are a statistician/statistics educator with an established career. You are concerned about the situation and want to advance your own skills and do something to help make the ecosystem more resilient. Of particular concern to you are your twin daughters who will be growing up in our public school system. You want to learn more, and ultimately to share what you learn where that knowledge is most needed. Figure 3 will help you map your adventure.
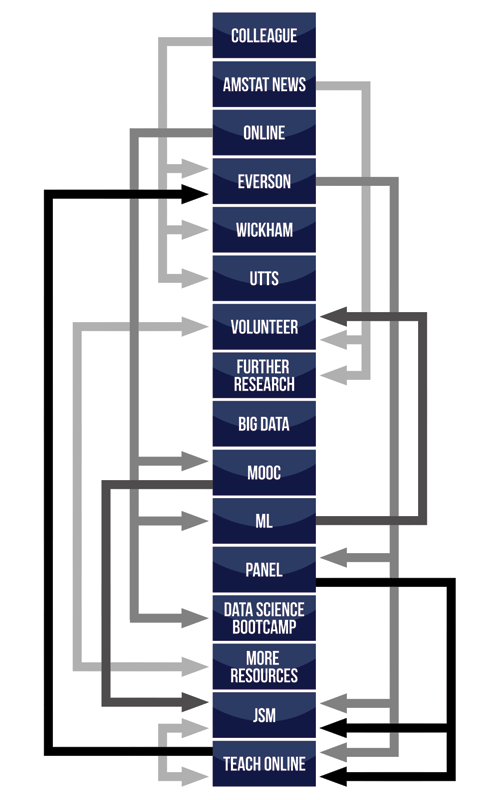
Figure 3. Adventure map
Illustration by Michael MacWilliams
Where will you decide to seek information next? Choose one: Colleague, Amstat News, or Online.
Colleague: You go to your colleague’s office to ask whom you should follow on social media—someone on the cutting edge—to find out more about the current state of data science and education. Unknown to you, there are many choices. Your colleague has a difficult time narrowing it down, in fact. You’re given three choices.
Pick one and go there: Utts, Everson, or Wickham.
Amstat News: You consult Amstat News. After all, that’s always proven to be a good source of information. Your investigation leads you to the call to action “Helping Your Local Statistics Teacher” from American Statistical Association (ASA) President Bob Rodriguez in his September 2012 column.
What will you decide to do next? Choose either Volunteer or Further Research.
Online: You go online and conduct your own research. It seems there are a ton of courses online now. You can learn almost anything!
Which will you choose—Massive Open Online Course (MOOC), Machine Learning (ML), or Data Science Boot Camp?
Everson: Michelle Everson is well known in the statistical education community for her excellence in online teaching and her innovative approaches to teaching any course, whether it be face-to-face or online. She’s the type of person who will ask you to be on an expert panel when you don’t yet think of yourself as an expert. Maybe this year it will be “Statistics Education Through Online Courses” at the Joint Statistical Meetings (JSM). As she does with her students, she recognizes your current and future capabilities. She has a real knack for encouraging growth in others.
What will she have you doing next—Panel, JSM, or Teach Online?
Wickham: Hadley Wickham’s sessions at JSM always fill up quickly. This is only one indication he is on the cutting edge. Through following his tweets and others on his Twitter feed, you learned how to use R ggplot to graphically recap the year’s weather in your own location and how to visualize sleep cycle data. You are reassured by his recent tweet that most of the advanced R courses he teaches have at least 40% female students, confirming the report of a similar trend in statistics practitioners, according to a recent article in the Washington Post: “Women Flocking to Statistics, the Newly Hot, High-Tech Field of Data Science.” You also investigate several R support groups online. As a result, you become even more of an R expert than you already were and decide to try your hand at Random Acts of Pizza, a Kaggle competition. Though you do not win, your involvement leads you to take on ever more complex, large-scale, and messy data problems. And now you bring a deepened skill set to the table. THE END.
Utts: Jessica Utts is chief reader for the Advanced Placement (AP) statistics exam and ASA president-elect, among other things. Surely there is no better expert to help you find out more about K–12 education and how the current state of data science affects it. As a result of the generous time she spends answering your questions and giving you more to think about, you become quite the statistics education advocate. You join both the ASA Section on Statistical Education and the International Association for Statistics Education (IASE) and find yourself likely to sign up to be an AP Statistics exam reader this summer. THE END.
Volunteer: When you volunteer to teach a statistics lesson at your local school, you discover three students very interested in your work as a statistician.
Seek more resources.
Further Research: You go back to Amstat News, only this time hitting a more current issue, from Nov. 1, 2014. This time it is Chris Wild’s article which attracts your attention. The title is particularly captivating: “We have to find ways to get much further, much faster—to open our students’ eyes to an enormously wider world of possibility, opportunity, and excitement.” You resolve to modernize your own course and bring the excitement you have for statistics and data science not only to your students, but to middle school students as well. You decide to ask Jennifer Kaplan about her recent experience getting middle and high school students excited about statistics using the Enemy Tank problem. You wonder aloud whether somehow you can figure out how to create a junior version of a data hackathon. You head to your local school district website to see what kind of statistics standards are in place for middle and high school students. For your own undergraduate course, you refer to the 2014 Curriculum Guidelines for Undergraduate Programs in Statistical Science, which have been carefully crafted to update statistical programs for the modern data age. You make a mental note to watch the Consortium for the Advancement of Undergraduate Statistics Education (CAUSE) webinar “Teaching precursors to data science in introductory and second courses in statistics with Nicholas J. Horton” to get ideas for your own course. THE END.
Big Data: You have done enough research now to know the hottest data surfers all concern themselves with Big Data. Some days, every other news story seems to use the term. There seems to be disagreement as to the definition of Big Data. You know that Big Data may include all or some of volume, velocity, and variety. But it all amounts to the same thing, increased complexity. You know there is more need now for effective data visualizations, and many professionals are applying their talents in this area. Rather than jumping on the bandwagon, you ponder potential pitfalls that you as a statistician are trained to recognize. Is enough attention being paid to the sampling process? What about confounding variables? Do consumers of Big Data understand multiplicity? Are we accounting for all sources of variation? How to avoid bias? How to avoid over-fitting models? What about assumptions? Are they met? This brings to mind the Bradley Efron quote, “Those who ignore statistics are condemned to re-invent it.” Working to raise statistical awareness in this area is the work of a lifetime. THE END.
MOOC: Did you know that MOOC stands for massive, open online course? Now you do. You also know all about The Johns Hopkins University’s nine-course specialization in data science. You’ve signed yourself up! You could go even further and sign up for an online master’s of science degree in data science from the University of California at Berkeley. Maybe worth looking into.
Attend JSM next.
ML: Never before did you realize how versatile Machine Learning can be. From identifying diabetic retinopathy to predicting ocean health to classifying computer malware, machine learning can play a significant role in helping us solve complex modern-day problems. It can even help farmers increase yields on dairy farms. You check out both Caltech’s and Stanford’s machine learning programs and sign up for one of these. You enter a Kaggle competition—and nearly win it! Before you know it, you are being offered a joint faculty appointment by both statistics and computer science departments at your local state college. As part of your vision for the future, you set up a machine learning summer camp experience for high school juniors and seniors. When you work with local businesses that need workers with this skill set, you encourage them to create internship opportunities for high school students so their interest will be piqued before they attend college.
Volunteer next.
Panel: Since you have taught online before, it is natural for you to be on a panel discussing best practices for online statistics teaching. You have not attended the U.S. Conference on Teaching Statistics (USCOTS) before, but you find you enjoy its statistics education focus. A more intimate conference with high energy, it is automatically added to your agenda for next year. And in the future, you make note to check out the International Conference on Teaching Statistics (ICOTS). The tenth ICOTS will be held in Kyoto, Japan in July 2018. This time, your short presentation and participation in the breakout session go well, but you really enjoy meeting colleagues, both on your panel and those who come up for discussion afterward. You get the sneaking suspicion you have learned more than you taught.
Where will you go next—JSM, or Teach Online?
Data Science Boot Camp: In researching data science boot camps, you see they are usually 12-week programs. Some boast rather high job placement rates with great salaries. Your intent is to add to your skill set, not necessarily to find a new position. Participating in the boot camp leaves you feeling thankful for the computing facilities you have both at work and in your home office. You resolve to check in with the local high school to find out what their computing facilities are like, and to see if they need statistical software. You plan to do everything you can to see that students have what they need in this regard. This becomes an ongoing pursuit. THE END.
More Resources: In trying to find more ways to connect with the young people you encountered in the class you taught, you come upon the “This is Statistics” website. You learn they have a Facebook account and are using Twitter also. Your twins are too young for social media, but you’ve heard from their babysitter that Facebook is no longer popular with teens. You decide to investigate Twitter, and that leads you to all sorts of useful information. Whenever the opportunity presents itself, you share what you are learning, and the resources that have helped you, with others. One thing you learn is that many school districts struggle to afford the high cost of textbooks. As a result, some lower level mathematics courses don’t have materials that contain the Common Core curriculum, which for mathematics often means that materials containing statistical concepts are unavailable. Also, more than a few districts are teaching AP statistics using textbooks more than 10 years old, despite a College Board recommendation otherwise. You wonder: Haven’t we been here before?
Decide to volunteer again.
JSM: The largest gathering of statisticians in North America, JSM is a face-to-face conference that showcases the latest in all areas of statistical pursuit. You have attended this conference off and on for years. You know how valuable it is for presentations, meetings, teaching ideas, and contacts with colleagues. The bad news: There are typically no school funds for high school teachers to attend JSM. This thwarts the effort to provide more training to them via the Meeting Within a Meeting (MWM) statistics workshop for K–12 teachers. You learn of and contribute to The Martha Aliaga MWM Scholarship to provide resources for K–12 teachers to attend this meeting. You become energized from all the valuable professional experiences you have at JSM.
You are inspired to do many things, but you decide to teach online next.
Teach Online: Even if you have not had experience yet taking a course online, that doesn’t have to stop you from becoming a great online teacher. Inspired by Michelle Everson and other successful online instructors, you set out to provide interactive experiences for your students, and you don’t rest until you make that happen in the online environment. In addition to teaching introductory and intermediate statistics courses online, you also explore providing similar topics in a course designed for secondary teachers. These teachers are charged with teaching statistical concepts in their mathematics courses, and/or AP statistics courses. The online format can be so much more flexible and better suited to meet their needs for support. You supplement your knowledge of online teaching strategies by consulting various journals, including the Journal of Statistics Education. Results from the secondary teacher course are quite encouraging, and so you set up a sustainable course and run it for years.
So now which will you choose? Find Michelle Everson to debrief your experience, or make plans to attend JSM?
Further Reading
Choose Your Own Adventure. The book series inspired the format of this article.
Consortium for the Advancement of Undergraduate Statistics Education.
This website inspired creation of Figure 3.
Kaggle: The Home of Data Science.
Leek, Jeff. Why big data is in trouble: They forgot about applied statistics. Simply Stats.
Matloff, Norman. Statistics is losing ground to computer science. Stats Life.
Montgomery, R.A. 1977. Journey under the sea. Waitsfield, Vermont: Vermont Crossroads Press.
About the Author
Kay Endriss teaches Advanced Placement Statistics at Career Center High School in Winston Salem, North Carolina. She earned an MS in biostatistics from the Medical College of Virginia, Virginia Commonwealth University. She is a national board-certified teacher in adolescence and young adulthood mathematics and licensed by the state of North Carolina to teach mathematics in grades 9–12.
About the Illustrator
Michael MacWilliams is a first-year student at the Savannah College of Art and Design in Atlanta, Georgia, where he is pursuing his BA and BFA in graphic design. Find more about Michael on his blog.


