
The AP Statistics Exam: An Insider’s Guide to Its Distinctive Features

The College Board launched its Advanced Placement (AP) Statistics course during the 1996–1997 school year. This course was designed to be equivalent to a one-semester, algebra-based, introductory college statistics course. Students who earn sufficiently high scores on the AP Statistics exam in May can be granted credit and/or placement in a more advanced statistics course by their receiving colleges and universities.
Approximately 7,500 students took the inaugural AP Statistics exam in May 1997. More than 190,000 students took the exam in May 2015. All totaled, more than a million students have taken the AP Statistics exam in the first 18 years that it has been offered.
The exam is administered in two parts: a 40-question, 90-minute multiple choice section followed by a six-question free-response section. Each section counts for 50% of a student’s overall exam score. All 40 multiple choice questions carry equal weight. The first five free-response questions each count for 15% of a student’s score on that section of the exam. Question six counts for 25% of the free-response score. This final question is an investigative task that challenges students to transfer their understanding of course content to more advanced statistical methods.
Students are permitted to use a calculator that will make basic graphical displays of univariate and bivariate data, compute numerical summaries for univariate and bivariate data (including linear regression models), and perform calculations for confidence intervals and significance tests throughout the exam. A formula sheet is provided for reference on both sections of the exam, along with tables for the standard normal, Student’s t, and chi-square distributions.
Educational Testing Service (ETS) is responsible for exam development and scoring. A development committee comprised of three experienced high school AP Statistics teachers, three college/university statistics educators, and representatives from the College Board and ETS is tasked with assembling several roughly equivalent forms of the exam each year. Development committee meetings are also attended by the chief reader, a distinguished college/university statistics educator (currently Jessica Utts of the University of California at Irvine) who is responsible for overseeing the scoring of the free-response questions on all forms of the exam. The chief reader produces draft scoring guidelines for each question that are reviewed by the development committee. These draft “rubrics” are further refined by individual question teams consisting of experienced AP Statistics exam graders immediately prior to the AP Reading in June. Many of the refinements made by the question teams result from attempting to apply the scoring guidelines to a sample of several hundred student responses.
The goal in scoring each question is to assign a student’s response to one of the following categories:
4 Complete response
3 Substantial response
2 Developing response
1 Minimal response
0 Inadequate response
This holistic scoring system allows exam readers to evaluate the overall quality of a student’s response on two dimensions: statistical knowledge and communication. It is quite different from an analytic scoring system (like the one used on the AP Calculus exam) that assigns points to specific components of a student’s response. The AP Statistics scoring guidelines give exam readers clear direction about how to classify a student’s response on the 0 to 4 scale.
Holistic scoring has found its way into numerous secondary and higher education statistics classrooms as a direct result of its use on the AP Statistics exam. The investigative task has prompted AP Statistics teachers to change their instructional practices in ways that promote outside-the-box thinking and transference of knowledge. This article aims to give you a better sense of these two distinctive features of the AP Statistics exam by looking closely at an actual investigative task and its associated scoring guidelines.
2011 AP Statistics Exam (Form B) Question 6
This question is based on an experiment that examined the relationship between the width of grass buffer strips and the amount of nitrogen removed from runoff water in agricultural fields. Parts (a) through (d) of the question ask students to consider several aspects of a linear regression model that describes the relationship between the two variables, including the meaning of the slope, the appropriateness of using the model to make predictions, and the implications of the normality assumption at a fixed value of the explanatory variable. The investigative aspect of the question comes in parts (e) and (f), which require students to optimize the design of the experiment in ways that give better information about the linear regression model.
Let’s examine each of the six parts of the question in turn, along with the published model solution. Then we will discuss the holistic scoring guidelines for this question.
The Question and Model Solution
Source: Copyright © 2015 The College Board. Reproduced with permission.
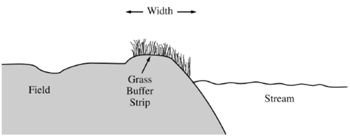
6. Grass buffer strips are grassy areas that are planted between bodies of water and agricultural fields. These strips are designed to filter out sediment, organic material, nutrients, and chemicals carried in runoff water. The figure below shows a cross-sectional view of a grass buffer strip that has been planted along the side of a stream.
A study in Nebraska investigated the use of buffer strips of several widths between 5 feet and 15 feet. The study results indicated a linear relationship between the width of the grass strip (x), in feet, and the amount of nitrogen removed from the runoff water (y), in parts per hundred. The following model was estimated.
![]()
(a) Interpret the slope of the regression line in the context of this question.
For each additional foot that is added to the width of the grass buffer strip, an additional 3.6 parts per hundred of nitrogen is removed on average from the runoff water.
(b) Would you be willing to use this model to predict the amount of nitrogen removed for grass buffer strips with widths between 0 feet and 30 feet? Explain why or why not.
No. This is extrapolation beyond the range of data from the experiment. Buffer strips narrower than 5 feet or wider than 15 feet were not investigated.
Suppose the scientist decides to use buffer strips of width 6 feet at each of four locations, and buffer strips of width 13 feet at each of the other four locations. Assume the model,![]() , estimated from the Nebraska study is the true regression line in California, and the observations at the different locations are normally distributed with standard deviation of 5 parts per hundred.
, estimated from the Nebraska study is the true regression line in California, and the observations at the different locations are normally distributed with standard deviation of 5 parts per hundred.
(c) Describe the sampling distribution of the sample mean of the observations on the amount of nitrogen removed by the four buffer strips with widths of 6 feet.
Because the distribution of nitrogen removed for any particular buffer strip width is normally distributed with a standard deviation of 5 parts per hundred, the sampling distribution of the mean of four observations when the buffer strips are 6 feet wide will be normal with mean 33.8 + 3.6 × 6 = 55.4 parts per hundred and a standard deviation of ![]() parts per hundred.
parts per hundred.
(d) Using your result from part (c), show how to construct an interval that has probability 0.95 of containing the sample mean of the observations from four buffer strips with widths of 6 feet.
The distribution of the sample mean is normal, so the interval that has probability 0.95 of containing the mean nitrogen content removed from four buffer strips of width 6 feet extends from 55.4 – 1.96 × 2.5 = 50.5 parts per hundred to 55.4 + 1.96 × 2.5 = 60.3 parts per hundred.
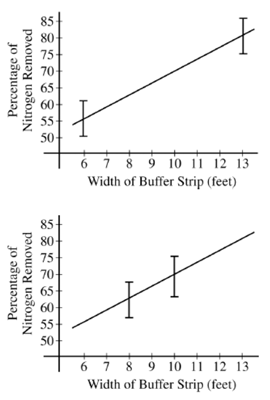
For the study plan being implemented by the scientist in California, the graph on the top below displays intervals that each has probability 0.95 of containing the sample mean of the four observations for buffer strips of width 6 feet and for buffer strips of width 13 feet. A second possible study plan would use buffer strips of width 8 feet at four of the eight locations and buffer strips of width 10 feet at the other four locations.
Intervals that each have probability 0.95 of containing the mean of the four observations for buffer strips of width 8 feet and for buffer strips of width 10 feet, respectively, are shown in the graph on the bottom below.
If data are collected for the first study plan, a sample mean will be computed for the four observations from buffer strips of width 6 feet and a second sample mean will be computed for the four observations from buffer strips of width 13 feet. The estimated regression line for those eight observations will pass through the two sample means. If data are collected for the second study plan, a similar method will be used.
(e) Use the plots above to determine which study plan, the first or the second, would provide a better estimator of the slope of the regression line. Explain your reasoning.
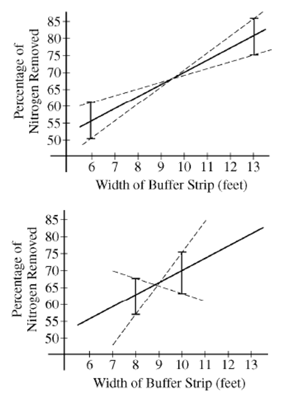
If we think that the sample mean nitrogen removed at a particular buffer width might reasonably be any value in the intervals shown, a sample regression line will result from connecting any point in the interval above 6 to any point in the interval above 13. With this in mind, the dashed lines in the plots on the next page represent extreme cases for possible sample regression lines. From these plots, we can see that there is a wider range of possible slopes in the second plot (on the bottom) than in the first plot (on the top). Because of this, the variability in the sampling distribution of b, the estimator for the slope of the regression line, will be smaller for the first study plan (with four observations at 6 feet and four observations at 13 feet) than it would be for the second study plan (with four observations at 8 feet and four observations at 10 feet). Therefore, the first study plan (on the top) would provide a better estimator of the slope of the regression line than the second study plan (on the bottom).

(f) The previous parts of this question used the assumption of a straight-line relationship between the width of the buffer strip and the amount of nitrogen that is removed, in parts per hundred. Although this assumption was motivated by prior experience, it may not be correct. Describe another way of choosing the widths of the buffer strips at eight locations that would enable the researchers to check the assumption of a straight-line relationship.
To assess the linear relationship between width of the buffer strip and the amount of nitrogen removed from runoff water, more widths should be used. To detect a nonlinear relationship, it would be best to use buffer widths that were spaced out over the entire range of interest. For example, if the range of interest is 6 to 13 feet, eight buffers with widths 6, 7, 8, 9, 10, 11, 12 and 13 feet could be used.
Discussion
As you look back on this question in its entirety, consider the number of mental transitions that a student would need to make in order to navigate all six parts of the question successfully. Well-prepared AP Statistics students should be able to interpret the slope of a linear regression model in context in part (a), and to explain why extrapolation is inappropriate in part (b). Students need to shift their thinking to the underlying assumption that the values of the response variable are normally distributed about the regression line at each value of the explanatory variable prior to parts (c) and (d). The added twist of asking about the sampling distribution of y when x = 6 proved especially difficult for students to comprehend. Part (d) presented another potential trap for students who thought they were being told to construct a confidence interval rather than to find values that bracket the middle 95% of the sampling distribution. The novel reasoning required in part (e) is typical of the investigative task. To answer this part correctly, students need to recognize how the slopes could vary with each of the proposed study plans. Part (f) requires students to pivot one final time in considering a different aspect of the design: how to establish whether the relationship between the variables is linear. I suspect that many statistics teachers would have difficulty making all the moves expected in the last four parts of this question!
Scoring Guidelines
Remember that an exam reader’s goal is to classify a student’s response on the 0 to 4 holistic scale. In the directions that precede the investigative task, students are reminded that the quality of their response includes both statistical accuracy and clear communication.
Directions: Show all your work. Indicate clearly the methods you use, because you will be scored on the correctness of your methods as well as on the accuracy and completeness of your results and explanations.
Rather than providing separate sub-scores for each of the six parts of this question, readers are instructed to group parts (a) and (b) into a single component, and parts (c) and (d) into a single component, with parts (e) and (f) counting as one component each. That gives a total of four components (called “sections”) for readers to score on each student’s response.
Scoring
This question is scored in four sections. Section 1 consists of parts (a) and (b); section 2 consists of parts (c) and (d); section 3 consists of part (e); section 4 consists of part (f). Each of the four sections is scored as essentially correct (E), partially correct (P), or incorrect (I).
The E-P-I scoring system for individual components of questions was another clever invention in the early years of the AP Statistics exam. Essentially correct (E) doesn’t mean “perfect,” but it does indicate that all of the required statistical elements are included, and that the student’s answer is communicated effectively. Partially correct (P) is a broad category that acknowledges a wide range of student answers that include some, but not all, of the required statistical elements, or that suffer from weak communication. Incorrect (I) indicates that the student’s answer does not qualify for credit due to a lack of statistical knowledge, poor communication, or both.
Recall that Section 1 consists of part (a)—interpreting the slope of the regression line in context—and part (b)—explaining why it is not appropriate to use the model to make predictions far outside the domain of values for the explanatory variable in this study.
Section 1 is scored as follows:
Essentially correct (E) if the response includes the following two components:
1. The response in part (a) is correct, as evidenced by the correct interpretation of the slope, in context.
2. The response in part (b) is correct, as evidenced by the identification of extrapolation as the reason that the model should not be used and the response is in context.
Partially correct (P) if only one of the two components listed above is correct.
Incorrect (I) if the response fails to meet the criteria for E or P.
Notes
• Part (a) is incorrect if the interpretation is not in context or if the interpretation does not acknowledge uncertainty (for example, does not include “on average” or “about” or “approximately” or “predicted” when referring to the increase in nitrogen removed).
• Ideally a correct solution would also include units, and make it clear that it is the approximate predicted increase for each additional foot added to the buffer, but in the context of this larger investigative task, failure to do so is not sufficient to make part (a) incorrect.
• Part (b) is incorrect if extrapolation is not identified as the reason, or if the response is not in context.
It is quite common for question teams to provide additional scoring notes like the ones above to assist readers in applying the rubric consistently for each component of a question. The first note was a direct result of seeing many student papers that gave a deterministic interpretation of slope like one might expect in a high school algebra course: the change in y that would occur for a one unit increase in x. You can picture exam readers who might have different instincts about what to do in case of a student response that omitted units. The second note takes care of that issue. Both notes make clear the importance of context in students’ written responses.
Recall that Section 2 consists of parts (c) and (d). In part (c), students were instructed to describe the shape, center, and variability of the sampling distribution of the sample mean amount of nitrogen removed from the runoff water ![]() when there are n = 4 grass buffer strips of width x = 6 feet. Part (d) asked students to construct an interval that would have 95% probability of capturing
when there are n = 4 grass buffer strips of width x = 6 feet. Part (d) asked students to construct an interval that would have 95% probability of capturing ![]() .
.
Section 2 is scored as follows:
Essentially correct (E) if the response includes the following two components:
1. The response in part (c) states that the sampling distribution is normal and provides a correct mean and standard deviation.
2. The response in part (d) uses the correct mean and standard deviation of the sampling distribution—or incorrect values carried over from part (c)—and a correct critical value (1.96 or 2) to compute a correct interval.
Partially correct (P) if only one of two components listed above is correct.
Incorrect (I) if the response fails to meet the criteria for E or P.
Notes
• Stating that the sampling distribution is approximately normal is acceptable for part (c).
• Part (c) is incorrect if the response does not state that the distribution is normal, or if an
incorrect mean or standard deviation is given.
• Part (d) is incorrect if an incorrect critical value (for example a t critical value) is used, or if an incorrect mean or standard deviation—other than incorrect values from part (c)—is used in the computation of the interval.
Notice that students who give incorrect values of the mean and/or standard deviation of the sampling distribution of ![]() in part (c) can still earn full credit for part (d) by performing calculations correctly with the values they obtained. This is common practice on the AP Statistics exam, provided that the values from a previous part of the question don’t lead to unreasonable or impossible results. Once again we see notes to help the exam readers make consistent decisions about how to score this section.
in part (c) can still earn full credit for part (d) by performing calculations correctly with the values they obtained. This is common practice on the AP Statistics exam, provided that the values from a previous part of the question don’t lead to unreasonable or impossible results. Once again we see notes to help the exam readers make consistent decisions about how to score this section.
Now we move to the more investigative aspects of the question: parts (e) and (f). Recall that part (e) asked students to choose which of two study plans would give a more precise estimate of the slope of the regression line for predicting amount of nitrogen removed from the runoff water (y) from the width of grass buffer strips (x). The figure below reminds you what students needed to think about in order to compose an essentially correct response. Section 3 of the scoring guidelines addresses part (e).
Section 3 is scored as follows:
Essentially correct (E) if study plan 1 is chosen in part (e), and the response demonstrates awareness of sampling variation in the estimates of the slopes of the regression lines, and this is clearly communicated in the context of the two study plans.
Partially correct (P) if study plan 1 is chosen in part (e), and the response demonstrates awareness of sampling variation in the estimates of the slopes of the regression lines, but the justification of the choice of study plan 1 is not clearly communicated.
Incorrect (I) if the response fails to meet the criteria for E or P.
In part (f), students were expected to propose an alternative design for the study that would make it easier to determine if the relationship between x and y is linear. Section 4 of the scoring guidelines covers this part of the question.
Section 4 is scored as follows:
Essentially correct (E) if the response specifies another study plan that uses eight buffer strips of at least three different specified widths, and the response indicates in how many locations each width will be used, or the response makes it clear that at least three different buffer widths will be used, and indicates that the buffer widths to be used will be spread out over the range of interest.
Note: Specifying eight different widths is sufficient for an E in section 4.
Partially correct (P) if the response does not meet criteria for E, but the stated plan uses at least three different widths. Widths need not be specified for a P.
Incorrect (I) if the plan does not use at least three different widths.
Determining a Student’s Score
After reading a student’s response to this investigative task, an exam reader has determined whether each of the four sections identified earlier should be scored as essentially correct (E), partially correct (P), or incorrect (I). How does this set of four letter-scores get converted into an overall score for the question? The scoring guidelines include the following conversion guide.
Each essentially correct (E) section counts as one point. Each partially correct (P) section counts as one-half point.
4 Complete Response
3 Substantial Response
2 Developing Response
1 Minimal Response
If a response is between two scores (for example, two and one-half points), use a holistic approach to decide whether to score up or down, depending on the overall strength of the response and communication.
For this question, if an exam reader obtains a whole number score from the Es, Ps, and Is that a student earned on each of the four sections, the reader simply enters that number on the score sheet. (Note that a score of 0 is possible on this question if a student earns Is on all four sections.) If the response falls between two scores, then the reader must step back and look carefully at the entire response again. The goal is to classify the overall quality of the student’s response in terms of both statistical knowledge and clarity of communication using the verbal descriptors provided: complete, substantial, developing, and minimal. This decisionmaking process epitomizes holistic scoring.
Is Holistic Scoring Subjective?
On first encounter, holistic scoring sounds somewhat subjective. But subjectivity isn’t conducive to the overarching goal of the AP exam reading: to score responses consistently according to the rubric. Ideally, a student’s response to this investigative task would receive the same score from any exam reader who is trained to grade this question. A detailed set of scoring guidelines certainly helps achieve this objective. Even more important is the training session led by the question team for all readers who will be grading the investigative task.
Besides discussing the scoring guidelines in detail, members of the question team show sample student papers that span the quality range from zero to four. Included in this batch of papers are numerous responses that yield a one-half point total initially, which then requires a holistic review of the entire student response. Readers are encouraged to ask clarifying questions that will help them interpret the scoring guidelines consistently. The final portion of the training session is devoted to letting readers practice scoring student responses. Readers submit their scores using clicker technology, which enables the question team to monitor consistency and to provide targeted feedback immediately. Often, the question team begins by asking readers to score one section of the investigative task at a time. This approach helps readers sharpen their understanding of the individual components of the scoring rubric. Once the vast majority of readers are assigning the same scores for each section on a series of benchmark papers, they are asked to score entire student responses. Throughout the process, members of the question team provide coaching to individual readers who need further clarification.
When the question team is satisfied with the overall consistency in applying the rubric, readers return to their grading rooms to begin scoring student responses with their assigned reading partner. Each new reader is paired with an experienced reader. This collaborative approach encourages professional dialogue about the statistical knowledge and clarity of communication displayed in an individual student’s responses. If reading partners disagree on the scoring of a response, or have a question about how to interpret the scoring guidelines, they can consult with an experienced table leader who sits at the front of the grading room. The partners begin by reading about 20 responses together, and comparing scores for each paper. Once they are scoring consistently, the partners score papers independently. However, readers are encouraged to consult with their partners as needed during the grading process.
The table leader’s primary role is to ensure that every reader in the grading room is scoring papers consistently according to the rubric. To achieve that goal, table leaders spend much of their time “back reading” samples of student responses that were scored by each reader. When there is a discrepancy in scoring, the table leader and reader discuss the paper until they reach agreement about the proper score to assign. The question team helps promote consistency between grading rooms by consulting regularly with table leaders, and by distributing occasional “board notes” to readers that include further refinements to the scoring rubric. In rare cases, question team members may provide additional training to readers who are having difficulty applying the scoring rubric correctly.
Professional judgment is required to determine if a student has met the standards stated in the scoring guidelines for an E, P, or I on each component of a question, and to classify the overall quality of a student’s response that falls between two score categories. Holistic scoring requires professional judgment, but is by no means subjective.
Implications for Classroom Practice
As a longtime AP Statistics teacher, exam reader, table leader, and question leader, I have been struck by how much the two distinctive features of the exam‐holistic scoring and the investigative task—have altered my classroom practice. I started out teaching high school mathematics courses, and used analytic scoring on all of my assessments. This points-based approach to grading yielded easy-to-average numerical values. But after a few years teaching AP Statistics, I started to notice that the seemingly precise numerical averages gave me less information about what a student knew or could do than the much “fuzzier” holistic scores.
Now Es, Ps, and Is are a regular part of my own and my students’ classroom vocabulary. Students generally appreciate that their work is being judged against established standards for quality on exam questions. When they don’t get an essentially correct response, students are interested in learning about where they fell short of the standard. That’s not to say that students always agree with my professional judgment in applying the scoring guidelines! But the discussions (debates?) that follow generally revolve around the student’s statistical understanding and clarity of communication rather than on whether she or he deserves more points for an answer.
Many of my colleagues who first encountered holistic scoring in AP Statistics have implemented some version of the E/P/I and 4-3-2-1-0 scoring in their mathematics classes. The biggest challenge they have faced is developing scoring guidelines that achieve the levels of quality and clarity of those developed for the AP Statistics exam.
The investigative task makes regular appearances in my AP Statistics classes. At first, randomly assigned teams of students attempt to produce complete responses in a collaborative fashion. I sometimes offer incentives—food, small amounts of extra credit, or a team quiz grade—to encourage students’ full investment of intellectual effort. To be honest, the competitive spirit that some students bring to the task usually exceeds the motivation provided by my incentives. As the course progresses, I give investigative tasks as take-home assignments. Students are permitted to consult with their classmates, but are expected to write up the solutions on their own. In the final two months of the course, I begin including investigative tasks as part of my in-class assessments. Students generally feel more confident in tackling these outside-the-box questions individually after having attempted several of them in a collaborative setting.
Investigative tasks challenge my students to transfer their statistical understanding to novel contexts. By attempting these tasks in my AP Statistics class, students encounter nonparametric tests, time-series data, bootstrapping, multiple linear regression, and a host of other topics that do not often appear in a first statistics course. More importantly, students forge meaningful connections between statistical concepts—like the connection between design and analysis in the grass buffer strip investigative task discussed earlier in
this article.
If you have never used holistic scoring, I hope that this article might persuade you to try it in one of your introductory statistics courses. Likewise, if you haven’t given your students an investigative task before, please consider doing so. You might be pleasantly surprised by what they can accomplish! To make it easier for all of us to incorporate holistic scoring and investigative tasks into our courses, the College Board posts all free-response questions from previously administered exams, along with scoring guidelines and sample student responses, on the AP Central website.
Further Reading
AP Statistics Course Description.
Legacy, M. 2008. AP Statistics teacher’s guide.
Rossman A.J., R. St. Laurent, and J. Tabor. 2015. Advanced Placement Statistics: Expanding the scope of statistics education. The American Statistician 69(2):121-126.
AP is a registered trademark of the College Board, which was not involved in the production of, and does not endorse, this product.
About the Author
Daren Starnes is mathematics department chair at The Lawrenceville School. His primary interest is statistics education. He has been involved with the AP Statistics program as a teacher, exam reader, and workshop leader since 1998 and has co-authored three introductory statistics books. He is former chair of the ASA/NCTM Joint Committee on Curriculum in Statistics and Probability and current head judge for the ASA Project Competition.


