
Handicapping Net Best-Ball Team Matches in Golf

Generally recreational golf is played in foursomes—four golfers playing 18 holes as a group. The most popular betting game among amateur male foursomes is a net best-ball team game, where the foursome is split into two two-player teams, and the lowest score for a team on a hole is the lowest net score of its team members. This net score is termed the team’s net best-ball. For example, let’s suppose that a team has gross scores of 4 and 5 and corresponding net scores of 3 and 5 (the golfer who got the 4 has a handicap stroke so his net score on the hole is 3). Then the team net best-ball is 3, the lower of the two net scores. If we think of a golfer’s net score on a hole as being a random variable, then a team net best-ball is the minimum order statistic of the two net scores. Typically a match is played over 18 holes on the basis of team net best-ball score by hole (i.e., match play). There are many variations of this game, but its essence is a team net best-ball.
The issue we study is the handicapping of net best-ball team matches. For example, if one team comprises players with a 2 and 12 handicap, and the other players with 4 and 8 handicaps, how should the game be played in order to make it fair? There is a universal belief among golfers we play with that to make such matches fair, all players should get their full handicap in the determination of a team net best-ball. The purpose of this paper is to show that this belief is, in general, not true. That is, the use of standard handicaps, handicaps designed for individual competitions, do not translate well to team net best-ball matches.
Sometimes team net best-ball scoring is used in more substantial games. For instance, at our club (Cataraqui Golf and Country Club, Kingston, ON, Canada), there is a member-guest tournament in which results are determined with a team net best-ball. The cost to get into this tournament is $1,000 per team. A portion of this entry fee is awarded in prize money. In addition, there are organized pari-mutuel betting and side bets among individual teams. We estimate conservatively that there is at least $100,000 at stake.
The USGA Position on Team Net Best-Ball
The following passage summarizes the United States Golf Association’s (USGA) view on the appropriate adjustments for team best-ball competitions:
When additional players join in, the USGA recommends handicap allowances to provide equity in other forms of play. A few words of explanation: Higher-handicapped players generally produce a wider range of hole-by-hole scores than better, more consistent players. This means that if full handicaps are used and a team can choose its best net score on each hole, the team getting the most strokes has a definite edge.
The USGA designed recommended allowances that need to be applied in these circumstances to make sure these games are fair and negate the advantage of higher-handicapped players.
So the USGA understands that the handicapping system does not translate well to net best-ball matches. However, we will show that it is not always true that higher-handicapped players have an advantage. Hence we’ll argue that the USGA recommendation for making net best-ball matches fair does not apply to all possible handicap pairings.
A Simple Example to Make the Point
Suppose two golfers labeled Low and High are playing a one-hole match. The Low golfer is a good player and only gets a par (0 or even par) or a birdie (-1 or 1 under). On the other hand, the High golfer is only capable of a par, bogey (+1 or one over par), or double-bogey (+2 or two over par). Suppose the Low golfer gives a stroke to the High golfer. That is, for the purposes of determining who wins, the High golfer subtracts a stroke from the score he gets, and then the two compare scores to see who wins.
Let us suppose that the probabilities of the possible results for each player are as specified below:
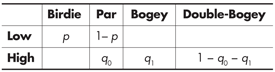
Once the High player subtracts a stroke from his score, he can get either a birdie, par, or bogey. With these probabilities defined, we can easily work out the probabilities that each wins:
Pr(Low Wins) = pq1 + 1 − q0 − q1, and Pr (High Wins) = (1 − p) q0. (1)
In order for this one-hole match to be fair, these two must be equal. This requires that
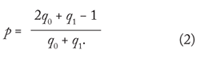
We suppose that this equality is satisfied and therefore this match is fair.
Now consider a net best-ball team game where the teams comprise two Low handicap golfers (the Low Team) and two High handicap golfers (the High Team). Again, these teams will play one hole. Critically, both High golfers will subtract one stroke from their individual scores for the purpose of calculating the High Team’s net best-ball. Additionally, we assume independence of the individual scores.
Using the parameters p, q0, and q1, we can calculate the probabilities of various team outcomes net of the stroke that each player on the High Team gets:
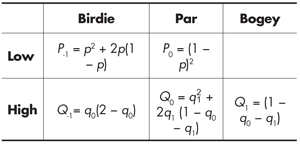
This gives the following win probabilities:
Pr (Low Team wins) = P−1 (Q0 + Q1) + P0Q1, and Pr (High Team wins) = P0Q−1. (3)
The probability of a draw is P−1Q−1 + P0Q0.
Consider the following instance. Let the probability parameters for the Low and High golfers be
q0 = 0.40,
q1 = 0.40, and
p = 0.25. (4)
Under these assumptions, a match between a Low golfer and a High golfer where the High golfer gets 1 shot is fair since each golfer has a probability of 0.3 to win (the match is drawn with probability 0.4).
Now consider what happens in the team match where each High golfer gets a stroke. We have
Pr (Low Team wins) = 0.18,
Pr (High Team wins) = 0.36,
and the match is drawn with probability 0.46. That is, the High Team’s probability of winning is twice the Low Team’s. Hence, it does not follow that handicaps that make one-on-one matches fair also make team net best-ball matches fair.
This example is consistent with what the USGA suggests about team best-ball matches, that the team with the higher handicaps has an advantage. However this is not always the case, as we are about to show with the example in the next section.
Another Example
Consider a model of a team best-ball match with the following assumptions:
1. The course comprises 18 holes identical in difficulty.
2. For each hole, a golfer’s score is characterized by the following probability distribution:
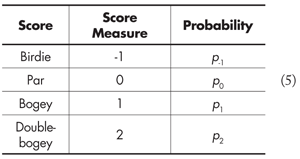
To keep the analysis reasonably simple, other scores like eagles and triple bogeys are not possible, so that
p−1 + p0 + p1 + p2 = 1. (6)
3. We reparametrize these four probabilities with
θ = p−1 + p0,
a = p0/p−1, and
b = p1/p2. (7)
Based on an analysis of golfers at our club, we set a = b = 5. A golfer’s ability is roughly characterized with θ—the higher is θ, the more likely the golfer is to be par or better on a hole. Given a θ, a = b = 5, and (6), we are able to calculate the pi’s.
This last assumption, that a = b = 5, needs some justification. Consider a scratch golfer. We will argue below that such a golfer has a θ = 0.789 when a = b = 5. We can work out the pi’s for such a player:
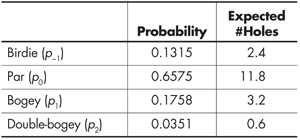
These probabilities are shown in the second column. Based on these probabilities, we can work out the expected number of holes on which a scratch golfer would expect to record a birdie over 18 holes. We can work out the same thing for holes parred, bogeyed and double-bogeyed. These results are shown in the third column of the table. So our scratch golfer, over a round, would be expected to get 2–3 birdies, about 12 pars, 3–4 bogeys, and the odd double-bogey. In our judgment, this reasonably characterizes the scratch golfers at our club. Additionally, we could calculate the number of strokes this average round would take relative to par. To get this we calculate
(−1 · p−1 + 0 · p0 + 1 · p1 + 2 · p2) × 18.
In the case of our scratch golfer, his works out to 2.06 strokes. In other words, he or she would, on average, card a score of about 2 strokes above par over 18 holes. This is reasonable given the way the handicap system works. Most handicap systems use the best m of a golfer’s last n gross scores to arrive at a handicap. For instance, in Canada and the United States, the best 10 of a golfer’s last 20 games are used to get his or her handicap. For this reason, a golfer’s average net score should exceed par. Additionally, we calculated a lower bound for the ratio of pars to birdies on the PGA Tour over the first part of the 2014 season (up to, but not including, the U.S. Open). This bound is a = p0/p−1 = 3.8 which is reasonably close to 5.
Finally, we argue that we don’t need to estimate a and b with precision given our purpose. We simply want to point out that it is possible that the USGA suggestion for making team net best-ball games fair does not work for all handicap pairings. To make that point we don’t need an accurate model of the generation of golf scores; we only need one that is reasonable.
With these assumptions, we can calculate a golfer’s handicap for a fixed θ in the following way. For a given θ, we generated an 18-hole score by drawing from the distribution in (5) 18 times. This leads to an integer measure of a golfer’s 18-hole score relative to par. We do this over and over to generate a sequence of rounds. With this sequence of rounds in hand, we generate the golfer’s handicap using the USGA formula. The details of the handicap calculation are burdensome. Readers interested in the precise details of this calculation can consult the paper by Swartz listed in the Further Reading section.
A golfer’s handicap changes as more games are added to his or her record of scores. It is natural, then, to think of a golfer’s handicap over time as a stochastic process. In Figure 1, we have plotted the progress of a golfer’s handicap when θ = 0.647 over 1,000 rounds. Note that the actual handicap (CH, or course handicap) varies between 1 and 5. In fact, the average handicap over 100,000 rounds is 3, so we say a golfer with θ = 0.647 has an expected course handicap or true handicap of 3. Hence, a golfer with a true handicap of 3 will sometimes come to the first tee with a handicap of 5. We could hardly accuse this golfer of being a sandbagger. The inflated handicap is a product of the randomness of golf scores and the nature of the handicap calculation.
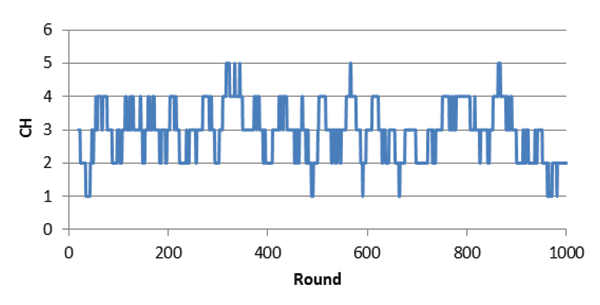
Figure 1. How a θ = 0.647 golfer’s handicap changes over 1,000 rounds
To get the relationship between expected course handicap, E [CH], and the ability parameter θ, we ran the simulation described above for values of θ between 0.05 and 0.95. For each value of θ, we used 100,000 simulation iterations to get a value for E[CH]. The results are shown in Figure 2. While it is difficult to tell from this graph, this curve is slightly nonlinear. Hence, we hypothesized a quadratic relationship between E[CH] and θ, and a regression produced the fitted model
E[CH] = 4.234θ2 − 27.385θ + 18.926. (8)
The R2 statistic for this regression is 0.9980, so the fit is very good.
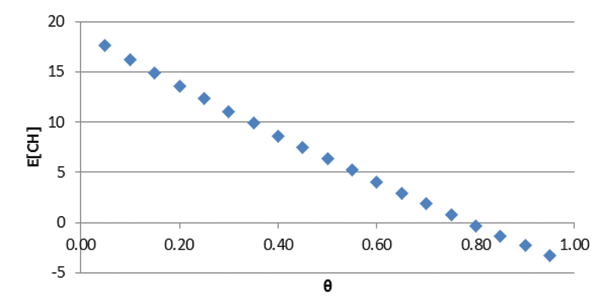
Figure 2. The relationship between expected course handicap and θ
Note that for a given E[CH] we can solve for the associated value of θ. For instance, for E[CH] = 3, we get that θ = 0.6477. In the simulation results reported above, we used θ = 0.647, and the E[CH] was approximately 3. For a scratch golfer (E[CH] = 0), we have θ = 0.789, and for a bogey golfer (E[CH] = 18), θ = 0.032.
Evaluating how two best-ball teams would do against one another with the assumptions described above would be difficult analytically. Consequently we employed a Monte Carlo simulation methodology. Effectively, we let a given team play another by randomly generating hole results according to the model assumptions described above. Gross scores are generated for each golfer according to the vector (p−1, p0, p1, p2) for that golfer. Then net scores are calculated. And with these net scores, we determine who wins the net best-ball match. In order to get accurate results, we repeated this calculation for 50,000 18-hole matches. Once we had the results for these 50,000 matches, we calculated the percentage of matches that each team wins and the percentage of time the match is drawn.
More specifically, we looked at matches where two scratch golfers (the Low Team) play against a High Team. We looked at four High Teams:
1. High Team 6. Both players have a 6 handicap (both have E[CH] = 6).
2. High Team 8. Both players have an 8 handicap.
3. High Team 10. Both players have a 10 handicap.
4. High Team 12. Both players have a 12 handicap.
In each case (i.e. Low Team versus High Team x for x = 6, 8, 10, 12), we simulated 50,000 matches. The resulting frequencies are summarized in the following table:
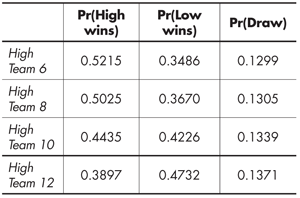
Note that High Teams 6, 8, and 10 have an advantage, but in the match with High Team 12, the Low Team has the advantage. Hence, contrary to the position of the USGA, it is not always the case that high-handicappers have an advantage over low-handicappers. This example should also make it clear that there is no easy adjustment to integer handicaps that will make the competition fair. For instance, the USGA recommendation that players receive a fixed percentage of their handicaps would not work in general.
Summary
In this article, our purpose was to show two results:
1. Team net best-ball matches are generally not fair when all golfers are assigned their full handicap; and
2. Making an adjustment to handicaps as suggested by the USGA does not always result in fair net best-ball matches.
These results beg the question of how to adjust handicaps to make net best-ball matches fair. We have examined a large number of handicap combinations and have not been able to find a simple rule to apply to individual integer handicaps to make a net best-ball competition fair. Hence, in our judgment, it’s an open question as to whether there are simple adjustments to course handicaps that will always make a net best-ball competition more equitable.
Further Reading
Bingham, D. R. and T. B. Swartz. 2000. Equitable handicapping in golf. The American Statistician 54(3):170-177.
Lewis A. J. 2005. Handicapping in group and extended golf competitions. IMA Journal of Management Mathematics 16:151-160.
Pollard, Geoff and Graham Pollard. 2010. Four ball best ball 1 (PDF download). Journal of Sports Science and Medicine 9:86-91.
Pollock, S. M. 1977. A model for the evaluation of golf handicapping. Operations Research 22:1040-1050.
Swartz, T. B. 2009. A new handicapping system for golf. Journal of Quantitative Analysis in Sports 5(2):Article 9.
Tallis, G. M. 1994. A stochastic model for team golf competitions with applications to handicapping. Australian & New Zealand Journal of Statistics 36(3):257-269.
About the Authors
Bill Hurley is a professor in the department of mathematics and computer science at the Royal Military College of Canada. His research interests are in decision analysis, game theory, and the design of MAC protocols in wireless networks.
Tyler Sauerbrei is an analyst at the Empire Life Insurance Company in Kingston, Ontario. He holds a bachelor of mechanical engineering and a masters of management (management science) from Queen’s University. His research interests are in decision science and sport analytics.


