
A Brief Review of All Comic Books Teaching Statistics
Being more or less an autodidact when it comes to statistics, I have a weak spot for books that try to introduce statistics in an accessible way. I have therefore collected what I believe are all books that introduce statistics using comics (at least those written in English). Except for including comics, these four books (yes, there are four) have in common that they assume no previous experience in statistics and are mostly focused on classical null hypothesis significance testing. Where they differ, and here they differ a lot, is in how well they explain the material. The best book is a real class act while one almost seems to be written to confuse.
Editor’s Note: Rasmus Bååth reviewed The Cartoon Guide to Statistics, The Manga Guide to Statistics, The Cartoon Introduction to Statistics, and Introducing Statistics, a Graphic Guide. Christian Robert reviewed Straightforward Statistics: Understanding the Tools of Research and Foundations of Statistical Algorithms.
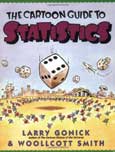
The Cartoon Guide to Statistics
Larry Gonick and Woollcott Smith
Paperback: 230 Pages
Year: 1993
Publisher: Harper Perennial
ISBN: 978-0062731029
Witty, pedagogical, and comprehensive, this is the best book of the bunch. Although it’s an older book, this is still the one that feels most up to date of the four reviewed. It provides a historical perspective and covers a wide range of topics starting with summary statistics and basic probability, working its way through probability distributions, experimental design, confidence intervals, and linear regression. It even touches on more advanced subjects such as resampling methods.
The book is not written as a standard comic book with panels and a story line. Rather, it is a well-written, easy-going text that is accompanied by the fun and lively sketches by Larry Gonick.
The book doesn’t skimp on the mathematical notation, which might put some novices off, but the presentation is still more accessible than most of the introductory stats books I’ve come across.
Perhaps the book could not be used as the only book in an undergraduate course in statistics, but I am sure it would make a great complement. If you are interested in the statistical programming language R, something to note is that many of the graphs in the book are made with S, the precursor to R.
Like all the books reviewed here, this one focuses on frequentist statistics, but at least the Bayesian perspective gets a mention.
Bayesian: Wanna’ bet?”
This is a great book that is witty and pleasant to read, highly recommended, and quite inexpensive.
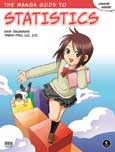
The Manga Guide to Statistics
Shin Takahashi
Paperback: 224 Pages
Year: 2008
Publisher: No Starch Press
ISBN: 978-1593271893
This book is perhaps a bit more manga than statistics, but still manages to cover the basics of data analysis and hypothesis testing. The artwork is great (if you like manga, that is) and the storyline is cute (again, if you like manga). If you don’t like manga and/or hypothesis testing, then this might not be your cup of bubble tea.
This volume is one in a long series of manga guides translated and published by No Starch Press. Like The Manga Guide to Databases or The Manga Guide to Calculus, The Manga Guide to Statistics tries to introduce a subject with a reputation for being difficult and technical by means of a cliché story full of huge eyes, naïve school girls, and geeky geeks lacking social skills. As opposed to The Cartoon Guide to Statistics, this book reads more like a standard comic book with panels and a story line.
The story centers around the school girl Rui, who wants to learn statistics to impress the handsome Mr. Igarashi. To her rescue comes Mr. Yamamoto, a stats nerd with thick glasses. (Spoiler alert: Guess who she falls in love with in the end?) The story and artwork are archetypal manga (including very stereotype gender roles), but if you can live with that, it is a pretty fun story.
Mr. Igarashi and Rui: Fail to reject the null hypothesis!”
Quite a lot of space in the book is devoted to the storyline, rather than teaching statistics. To compensate for this, there are text passages interspersed between the manga passages. Surprisingly, these passages include hands-on exercises using Excel, so the manga guide would work well as a self-study book.
Still, the book doesn’t cover that much ground. Except for basic graphs and summary statistics, the book is focused on classical hypothesis testing. It also introduces probability distributions, but mostly from a hypothesis-testing perspective, which feels a bit odd.
I imagine that, without any background in statistics, a reader of this book would find it hard to understand the rationale for actually performing hypothesis tests. Maybe a good companion would be the soon-to-be-released Manga Guide to Regression Analysis.
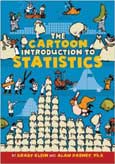
The Cartoon Introduction to Statistics
Grady Klein and Alan Dabney
Paperback: 240 Pages
Year: 2013
Publisher: Hill and Wang, 2013
ISBN: 978-0809033591
This book has a similar theme and a deceptively similar name to The Cartoon Guide to Statistics; however, I found this book lacking in almost all aspects. The artwork doesn’t click with me; somehow it looks like the characters lack outlines and the illustrations distract from the text. The content is very focused on normal sampling distributions, unwarrantedly so if it aims to be a general introduction to statistics. Sure it is an important concept in classical statistics, but it takes up a large part of the book while other important concepts, such as probability and estimation, receive little attention.
The most irritating … aspect of the … book is that … most sentences are spread out … over many panels. This “dilution” of the text makes it tedious to read and, for a book of 240 pages, it covers few concepts.
As a relatively new book, it is strange that it does not mention Bayesian statistics at all. It is actually the most frequentist book of all the books reviewed here. However, when looking at how confidence intervals are characterized, it seems as if the book actually is (involuntarily) describing a Bayesian credible interval.
For a longer review of this book, see CHANCE, Vol. 27, No. 1.
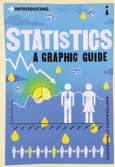
Introducing Statistics, a Graphic Guide
Eileen Magnello and Borin Van Loon
Paperback: 176 Pages
Year: 2005
Publisher: Icon Books
ISBN: 978-1848310568
Wow! This is an odd book that might be one of the worst introductions to statistics you can get as a beginner. The artwork by surrealist painter Borin van Loon is truly surreal. Perhaps it is hip and cool (and perhaps I’m not cool enough), but it definitely does not add clarity to the subject the book aims to introduce.
The worst part of the book is, however, the text, which introduces statistical concepts and historical facts in a completely haphazard order. The book is focused on early statistical scientists such as Galton, Pearson, Gosset, and Fisher. The deformed heads of these and other characters from the history of statistics are scattered around the book and here is the content of a speech bubble coming from one of the many surreal versions of Pearson’s head: “With my new method [, the coefficient of variation,] groups which show a great deal of variation within their own group can now be measured.” What does it mean to measure a group, and why would the coefficient of variation help when measuring a group with a great deal of variation? In general, there are a lot of statements in this book that do not make sense or are plain wrong. A random sample follows:
“There are two types of statistical distributions: probability distributions, which describe the possible events in a sample and the frequency with which each occur; and frequency distributions.”
“[The Bayesian approach] is a means of calculating from the number of times that an event has not occurred to determine the probability that it will occur in future trials.”
“The expected values represent the average amount one ‘expects’ as the outcome of the random trial when identical odds are repeated many times.”
The list could go on and, if it is not clear by now, this is not a book I recommend unless you really are looking for a surreal introduction to statistics.
Straightforward Statistics: Understanding the Tools of Research
Glenn Geher and Sara Hall
Hardcover: 480 Pages
Year: 2014
Publisher: Oxford University Press
ISBN: 978-0199751761
~ G. Geher
This book is an introductory textbook for psychology and further social science students. I can appreciate the deeper purpose behind the annoying title, purpose heavily stressed anew both in the preface and the first chapter. Yet this title irks me as conveying the message that one semester of reasonable diligence in class will suffice for any college student “not only understanding research findings from psychology, but also to uncovering new truths about the world and our place in it” (p. 9), no less.
The textbook unsurprisingly covers the basics found in all other introductory textbooks, from descriptive statistics to ANOVA models. The examination of “real research examples” found in most chapters of the book rather demonstrates how far from real research a reader of the book would stand…
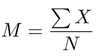
The book aims at teaching basic statistics to “undergraduate students who are afraid of math” (p. xiii). The approach adopted therein proceeds along “an accessible, accurate, coherent, and engaging presentation of statistics.” (p. xiv) This means reducing the math’s expressions to a bare minimum.
Unfortunately, the very first formula encountered in the book (p. 19) is meaningless; skipping the individual indices in sums is the rule throughout the book:
while the second formula (in Table 2.7, p. 22, and again in Tables 2.19 and 2.20, p. 43)
![]()
is first missing both the indices and summation symbol and, second, dividing the sum of “squared deviation scores” by N rather than the customary N–1.
I also fail to see the point of providing histograms for categorical variables with only two modalities, like “Hungry” and “Not Hungry” (Fig. 2.11, p. 47).
Since I teach only math students, I cannot judge how adequate the textbook is for psychology or other social science students. However, it sounds highly verbose to me in its attempts to bypass math formulas. For instance, the 15 pages of the chapter on standardized scores are about moving back and forth between the raw data and its standardized version.
![]()
Or the two pages (pp. 71–72) of motivations on the r coefficient before the (again meaningless) formula
![]()
which even skips indices of the z-scores, presumably to avoid frightening the students further. The book also asserts that a correlation of zero “corresponds to no mathematical relationship between [the] two variables whatsoever.” (p. 70). Or yet the formula for (raw-score) regression (p. 97) given as
![]()
without defining B. This, apparently, is a typo as the standardized regression used β. I could keep going with such examples, but the point I mainly want to make is that, if the authors want to reach students who have fundamental problems with a formula like
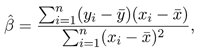
which does not appear in the book, they could expose them to the analysis and understanding of the outcome of statistical software, rather than spending a large part of the book on computing elementary quantities such as the coefficients of a simple linear regression by hand. Instead, fundamental notions like multivariate regression are relegated to an appendix (E) as “advanced statistics to be aware of.” Also, there is a two-page discussion (pp. 104–105) of a study conducted by the first author on predicting preference for vaginal sex. To put things into context, the first author also wrote the book Mating Intelligence Unleashed, which may explain some unusual “real research examples.”
Another illustration of what I consider as the wrong focus of the book is provided by the introduction to (probability and) the normal distribution in Chapter 6, which dedicates most of the pages to reading the area under the normal density from a normal table without providing the formula of this density. (And with an interesting typo in Figure 6.4.)
Indeed, as in last century’s textbooks, the book keeps including probability tables for standard tests, rather than relying on software and pocket calculators to move on to the probabilistic interpretation of p-values and the multi-layered caution that is necessary when handling hypotheses labeled as significant. (A caution pushed to its paroxysm in The Cult of Significance, which I reviewed for CHANCE a while ago.)
The book includes a chapter on power, but besides handling coordinate axes in a weird manner (check from Fig. 9.5 onward) and repeating everything twice for left- and right-one-sided hypotheses, it makes the computation of power appear like the main difficulty when it is its interpretation that is most delicate and fraught with danger.
If I were to teach (classical) testing to math-averse undergrads, I would skip the technicalities and pile up cases and countercases explaining why p-values and power are not the end of the analysis. (Using Andrew Gelman’s blog as a good reservoir for such cases.) But I did not see any warning in that book on the dangers of manipulating data, formulating hypotheses to test out of the data, running multiple tests with no correction, and so on.
As an outsider, I fail to see redeeming features that would single out Straightforward Statistics: Understanding the Tools of Research as a particularly enticing textbook. The authors have clearly put a lot of effort into their book, adopted what they think is the most appropriate tone to reach the students, and added detailed homeworks and their solution. Still, this view makes statistics sound too straightforward and leads to the far too common apprehension of p-values as the ultimate assessment for statistical significance without allowing for alternatives such as outliers and model misspecification.
Foundations of Statistical Algorithms
Claus Weihs, Olaf Mersmann, and Uwe Ligges
Hardcover: 500 Pages
Year: 2013
Publisher: Chapman and Hall/CRC, 2013
ISBN: 978-1439878859
There is computational statistics and there is statistical computing. And then there is statistical algorithmics. Not the same, by far. Foundations of Statistical Algorithms by Weihs, Mersman, and Ligges—the latter being also a member of the R Core team—stands at one end of this wide spectrum of techniques required by modern statistical analysis. In short, it provides the necessary skills to construct statistical algorithms and hence contribute to statistical computing.
I wish I had the luxury to teach my graduate students from this book … if only we could afford an extra yearly course.
The book is built around the above premise. It first presents the reasons why computers can produce answers different from what we want, using least squares as a means to check for (in)stability. Second, it establishes the ground for Monte Carlo methods by discussing (pseudo-)random generation—including MCMC algorithms. Third, the book covers bootstrap and resampling techniques. Finally, it concludes with parallelization and scalability. The text is highly structured, with frequent summaries, a division of chapters all the way down to sub-sub-sub-sections, an R implementation section in each chapter, and a few exercises.
The first chapter(s) (Chapter 2) is (are) similar to intro courses to computer science, with detailed analyses of sorting algorithms, Turing machines in action, computing with floating-point numbers, and understanding the limited precision of floating-point computation. Chapter 3 details the verification of computer algorithms in the case of linear least square solvers. The central tool there is the condition number, with dose of matrix algebra some students may find unsavory. Chapter 4 is called “Iteration” and deals with the equivalent of Chapter 3 when no closed-form analytic solution is available, introducing various techniques of numerical optimization (e.g., Newton, quasi-Newton, gradient, Levenberg-Marquardt, Nelder-Mead). The chapter includes a short introduction to simulated annealing, which, unfortunately, includes a typo (acknowledged by the authors) since the energy is the reverse of what it should be: t/△ instead of △/t. It also considers the maximization of a Gaussian mixture likelihood as an example of a non-convex problem without mentioning it is a problem per se for having an infinite maximum. Chapter 5 examines the theoretical properties of the partial least squares and EM algorithms. Even though those algorithms are essential in statistical computing, this chapter feels like an outlier for its specific focus.
Chapter 6 returns to a computer science presentation of randomness, albeit without the common, if barren, debate about the nature and definition of the thing. Similar to Fishman (1996), the book describes discrete uniform generators in detail, in tune with the initial aim, even though the conclusion is to “use the code provided by the original authors” (p. 279).
In my opinion, Fishman’s (1996) Monte Carlo covers this aspect in a more thorough manner, with a deeper focus on approximation errors in the continuous case. Also, the coverage of the non-uniform standard distributions is superficial (if compared with the iconographic reference book of Devroye (1985), available on the author’s page).
The second part of the chapter is about rejection and MCMC methods. Once again in agreement with its stated goal, the book focuses on the convergence of the Gibbs sampler and Metropolis-Hastings algorithms. However, it stops at the uniform ergodicity case, namely when the transition kernels are uniformly lower bounded. The chapter concludes with a detailed illustration using BRugs, the 2006 R interface to BUGS.
Chapter 7 covers both resampling (cross-validation and bootstrap) and machine learning classification (LDA, kNN) and regression (neural net) methods. (Note: JAGS is also mentioned in this chapter, if not STAN.)
Chapter 8 deals with scaling and parallelization, starting with a fairly lengthy description of the evolution of computer and parallelization software, followed by a short section on code optimization and an introduction to parallel programming, including the foreach R package. This is illustrated with a k-means algorithm.
The conclusion quickly mentions “the upcoming trend of using graphics processing units” (p. 440) and “MapReduce [that] brings the function on a node that is close to the data … a filesystem or storage layer that distributes massive data sets across the nodes.”(p. 442). The final conclusion is that “while scaling an algorithm is desirable and parallel computing can be fun and rewarding, we should not overdo it.” (p. 444).
My conclusion is that this is a rich book that should benefit a specific niche of statistical graduates and would-be statisticians, namely those ready to engage in serious statistical programming. It should provide them with the necessary background, out of which they should develop their own tools. A possibly small niche, but a niche upon which the profession’s future depends.
About the Authors
Rasmus Bååth is a PhD candidate in cognitive science at Lund University, Sweden. He blogs about R and statistics (preferably of the Bayesian kind) at sumsar.net.
Christian Robert is a professor of statistics at Université Paris-Dauphine and a senior member of the Institut Universitaire de France. He has authored eight books and more than 150 papers on applied probability, Bayesian statistics, and simulation methods.

Book Reviews is written by Christian Robert, an author of eight statistical volumes. If you are interested in submitting an article, please contact Robert at xian@ceremade.dauphine.fr.


