
Qualifying Times for the Boston Marathon
 Patriots’ Day of 1897 marked the first of what is now the oldest annual marathon in the world: the Boston Marathon. The Boston Athletic Association (BAA) operates this marathon in which runners from around the world strive to participate. The Boston Marathon is not only historically appealing for runners, but is also considered a grueling course—topped off with “Heartbreak Hill” after mile 20 of 26.2. An extra twist to the allure of the Boston Marathon is that runners have to satisfy the BAA qualifying time standards in a certified marathon within about a year and a half of the desired Boston Marathon. Qualifying standards for the Boston Marathon were first established in the 1970s, when they were viewed as a means of controlling the size of the field while continuing to allow established marathon runners to participate. They have since been revised a number of times.
Table 1 contains the qualifying times used for the 2011 Boston Marathon (QT1), which had been in place since 2003. An additional 59 seconds is accepted for each standard. For instance, a man aged 18–34 could have run up to 3:10:59 and still been accepted into the race. Also, while race organizers may publish both “gun” and “chip” times, the chip time (representing net time between crossing the start and finish lines) is accepted as the basis of Boston qualifying times. The chip time is based on a small computer chip attached to the runner’s vest, which is recorded by sensors at the start, the finish, and several intermediate points.
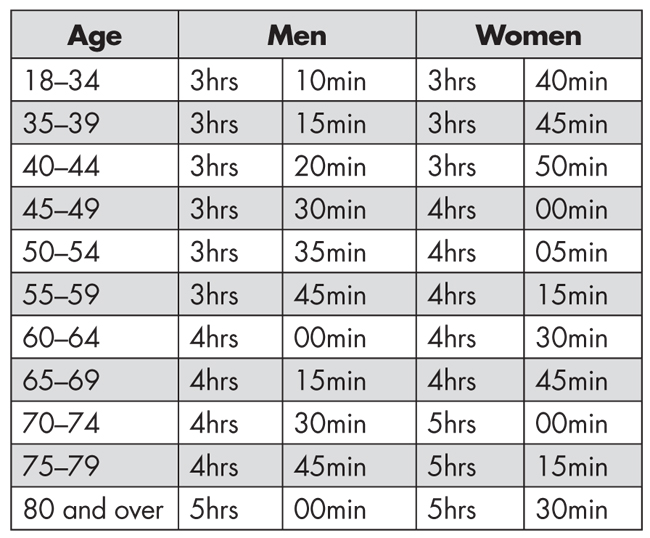
Table 1—Boston Marathon Qualifying Times (up to 2012)
The 2011 Boston Marathon registration opened October 18, 2010, and all of the 20,000 spots for qualifiers were filled in about eight hours. This led to speculation that the BAA would impose substantially tighter qualifying times for future years. In addition, The Wall Street Journal (October 13, 2010) published a commentary suggesting the current 30-minute disparity between qualifying times for men and women was too generous to the women.
In light of these speculations, we contacted the BAA to express our interest in assisting with this process and proposed an analysis for modifying the Boston qualifying times. After initial consultations with Jack Fleming and Mike Pieroni of the BAA, we agreed to assess the impact of any QT changes of 2, 5, 10, 15, 20, and 30 minutes. The main objective of our study was to estimate the total number of potential entrants, for each sex and age group, under each of these changes. As described in the following account, we did this in stages, starting with large races that sent many qualifiers to the Boston Marathon and then extending the calculation via a random sampling exercise from the remaining races in their database.
Data
To verify qualifying claims, the BAA requests race results from all official marathon events in the United States and Canada, as well as major overseas events. These have been compiled in the form of Excel spreadsheets that include each runner’s name and home city, sex, age or date of birth, and finish time in the race (both gun and chip times—we used the chip time whenever possible). For the 2010 Boston Marathon, which at the time of our study was the most recent race with complete data available, the BAA had results from 641 “feeder races,” that is, races from which at least one runner had qualified for Boston. The vast majority of these races were in the United States and Canada, though a few were outside the official qualification window (mostly runners who had entered an earlier Boston Marathon and claimed a medical deferment). While the United States and Canada data are essentially complete, it would be extremely difficult to estimate all possible qualifiers from the rest of the world. Therefore, the decision was made to exclude races outside the United States and Canada from our analysis; by our own estimate, only about 4% of runners in the 2010 race qualified from outside those two countries.
An additional resource we used was the extensive file of marathon statistics posted at www.marathonguide.com, which includes nearly all marathons in the USA and Canada, but only a very incomplete listing of marathons in the rest of the world. Other limitations of our study include the following:
- Not all race results make clear the distinction between marathon runners and other competitors (e.g., wheelchair racers). In particular, some of the reported times by marathon runners are under two hours. Since the current world record for a marathon is 2:03:23, set by Wilson Kipsang of Kenya in the 2013 Berlin Marathon, such reported performances cannot be correct. In cases where it was possible to distinguish, we removed all competitors who were not identified as marathon runners. Where we could not make that distinction, we used the results as given.
- In cases where exact date of birth was recorded, we used that information to compute ages of runners on the day of the Boston Marathon (April 19, 2010). When no birthdates were supplied, we used a statistical estimate of ages. For example, if a 54-year-old man ran a marathon between 3:35 and 3:45 in July 2009, we estimated there was a 0.75 chance he would be 55 before April 19, 2010, and so counted him as 0.75 of a qualifier.
- Our method of counting Boston qualifiers does not distinguish cases where one runner may have run multiple qualifying times. However, in a later section, we propose a method of adjusting the estimate to account for this problem.
For the initial calculation, the BAA sent us complete results for the 37 top feeder races, that is, the races that sent most qualifiers to Boston (this includes the Boston Marathon, itself).
For the second stage of our analysis, we supplemented that data set in two ways. We asked for complete results from five additional races (Honolulu 2008 and 2009, Disney World 2009 and 2010, Los Angeles 2009) for which the number of Boston qualifiers was low, though the races were large (all well over 10,000). From the remaining feeder races, we removed those outside the United States and Canada, races outside the qualification window for the 2010 race, and all races for which the fraction of Boston qualifiers was less than 5%.
For the sampling exercise (though not for the subsequent estimation of total Boston qualifiers), we also eliminated races with fewer than 500 runners total. This left us with a “population of races” consisting of 237 feeder races that were included in the sampling exercise.
While it would have been computationally feasible to analyze data from all the races, the time taken to prepare and transfer the data sets was a significant constraint; therefore, we agreed with the BAA that they would send us just 25 of those 237 races for our analysis. We selected the 25 by simple random sampling, in addition to the 42 selected earlier.
Calculations
For the 42 races selected (37 top feeders plus the 5 additional races chosen for their large field sizes), an exact count of Boston qualifiers was taken by sex and age group for current qualifying times for each of the possible alternatives given above. For the 25 randomly sampled races, the total number of qualifiers was multiplied by 5.59 for men and 5.89 for women. The rationale is as follows. The total number of male runners in the 25 sampled races is 30,768, while the total number of male runners in all 237 races in the population of races is 172,114, with corresponding numbers for women as 19,752 female runners in the 25 sampled races and 116,305 in all 237 races. Thus, if we multiply the number of qualifying men by 5.59 = 172,114/30,768 and qualifying women by 5.89 = 116,305/19,752, the estimates of the total number of qualifiers are the sums of those from the 42 races and the adjusted random sample of 25 races.
There are a couple of caveats to this procedure. In particular, the counts of total runners (30,768; 172,114; 19,752; 116,305) are based on the tables published at www.marathonguide.com. In many cases, the totals on there do not correspond exactly to those in the official results held by the BAA. Nevertheless, we believe this is a fairly minor source of error. Regardless, it needs to be emphasized that the 25 randomly sampled races are a sample of the total number of races, and therefore, there is sampling error associated with the results. The principle is analogous to forecasting the result of an election: Polls taken before or during the election are based on a sample of voters, and there is always some margin of error associated with the sample.
Results
The total number of finishers in all 37 races broken down by age group is displayed in Table 2. Combining the 42 races for which we had complete results with the estimates for the rest of the feeder races, we display in Table 2 our estimates for the total number of marathon runners and the total number of qualifiers for the 2010 race.
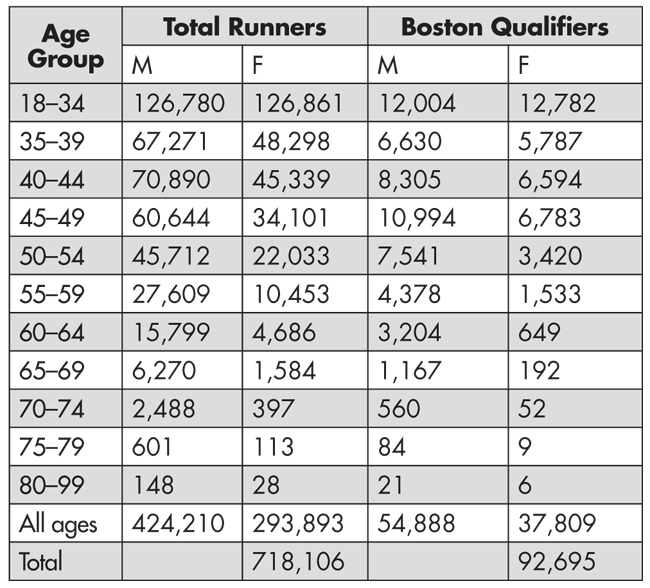
Table 2—Estimated Totals by Age Group of All Male and Female Marathon Runners in All Races and Numbers of Qualifiers Under 2011 Qualifying Standards
This exercise was then repeated for a number of adjustments to the qualifying times—QT1 representing the qualifying times as of 2010 and QT1-2, QT1-5 through QT1-30 to represent adjustments of the standards by 2, 5, 10, 15, 20, and 30 minutes. The results are expressed in Table 3 as percentages of total runners who are Boston qualifiers in each age and sex group. Total numbers of runners are easily calculated by reversing this process. For example, for the M18–34 age group under QT1-10, we estimate 5.3% of 126,780 runners, or about 6,700.
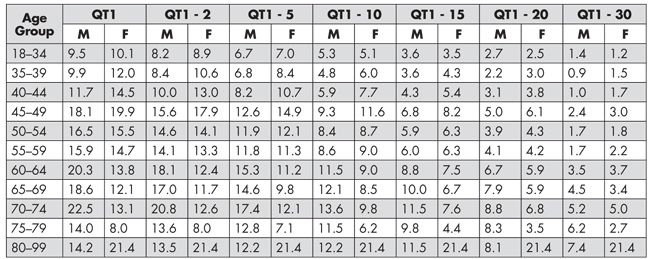
Table 3—Percentage of Qualifiers for All Races with QT Adjustments
Overall, there is some discrepancy between the percentages of males and females who qualify for Boston. Females have a higher percentage of qualifiers in the 18–34 age group, but this is reversed in some older age groups. However, the overall discrepancies (between males and females) are small. Within the 18–34 age group, there are more women qualifiers than men, but there are also more women runners in total in that age range. The percentage of women qualifiers is higher than men (10.1 against 9.5), but it’s not a very big discrepancy. If the women’s qualifying time were adjusted by as little as 2 minutes (the men’s remaining the same), the balance would again shift in favor of men (9.5% of men, 8.9% of women). Therefore, any change in the relative M/F qualifying times to correct for the discrepancy would have to be very slight (less than 2 minutes) and hardly worth making. If there were to be a real tightening of the qualifying times (10 minutes or more), the advantage would again shift back to the men.
These results point toward the difference between M18-34 and F18-34 qualifying times remaining at 30 minutes. Among all the age groups under 60, the 45–49 age group (M and F) has the highest percentage of qualifiers. This may be the consequence of the 2003 revision of the qualifying times, when the 45–49 standards were changed from 3:25/3:55 to 3:30/4:00. Maybe something like 3:27/3:57 would be more consistent with the surrounding age groups, if the rest of the standards remained the same. Also, women in the 60-79 age range get a bit of a raw deal: there are far fewer of them (than men in the same age groups), but also a substantially lower percentage of Boston qualifiers.
Table 4 shows what these results mean for the total number of qualifiers under each of the proposed revisions, aggregated over all age groups. For example, a 5-minute reduction in qualifying times would result in about a 29% reduction in the number of male qualifiers and a slightly smaller (28%) reduction in the number of female qualifiers. This information was valuable to the BAA in determining how much of a reduction in the number of entrants might be expected with different adjustments.
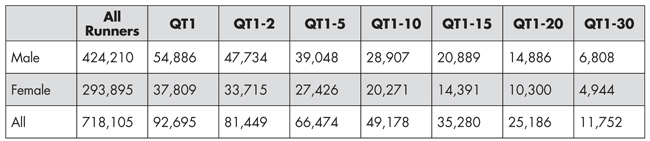
Table 4—Estimated Total Runners Under 2011 Qualifying Times (QT1) and by Various Adjustments of the Standards
The Problem of Multiple Qualifiers
The results given here do not account for the possibility that the same runner may run multiple qualifying times. This was addressed by another sampling exercise, as follows.
We sampled 115 runners from the results of the 2010 Boston Marathon. For each, we used the data at www.marathonguide.com to trace each of those runners and all the qualifying times they had run during the 2010 qualifying races. For 35 of the runners, we were unable to trace any qualifying time. We suspect most or all of these were either overseas runners who had qualified in overseas races or charity runners who did not qualify at all. Among the 80 runners for whom we could trace a qualifying time, the counts were as in Table 5. In other words, 54 runners had exactly one qualifying time, 10 had two qualifying times, 11 had three qualifying times, etc.
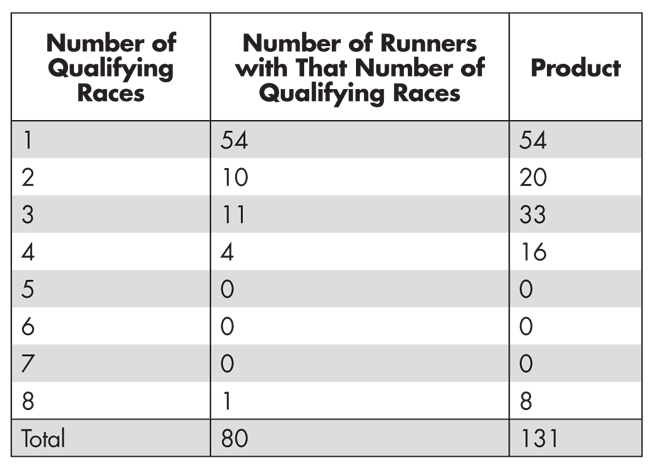
Table 5—Number of Multiple Qualifiers from Sample of 115 Runners
Overall, the 80 runners had run a total of 131 qualifying times, a ratio of 131/80=1.6. If this ratio held up over all runners, the implication would be that we should reduce our estimated numbers of qualifying runners by a factor of 1.6. For instance, under current qualifying standards, the estimated total numbers of qualifiers would become 54,886/1.6=34,304 men and 37,809/1.6=23,631 women, for a total of 57,935.
This is an admittedly crude result. We didn’t distinguish between men and women in our sample, let alone the different age groups. Also, it’s unlikely that the www.marathonguide.com results are complete. However, it does give a rough guide to the extent by which our earlier results could be affected by the issue of multiple qualifiers.
Estimating the Sampling Error
We already made the analogy between our sampling method and the way pollsters conduct an election poll. In election polls, it’s common to quote a margin of error, which is supposed to represent the error in the poll due to sampling. For example, in a poll based on a sample of size 1,000, the margin of error is usually quoted as plus or minus 3%. A more precise statement is that this is a 95% confidence interval.
We have performed a rough calculation of the margin of error involved in these samples. This was achieved by bootstrapping. From among the same 25 races selected at random in the second stage of the procedure, we resampled by selecting races at random, with replacement. This gives us a bootstrap sample of 25 races, for which we calculated total qualifiers by the same procedure as before. The bootstrap procedure was repeated 10,000 times and the 0.025 and 0.975 quantiles of the bootstrap sample were used to define a 95% confidence interval. Results are shown in Table 6.
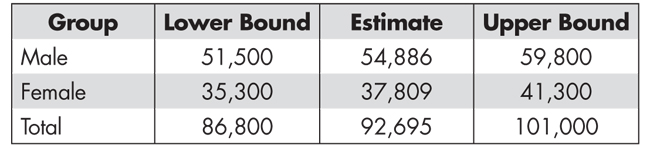
Table 6—95% Confidence Intervals for Qualifiers
These ranges give a rough idea of how accurate our estimates are. However, it should be pointed out (as with election polls) that they account only for the error associated with drawing a sample and not with other sources of error. They do not take into account that we have omitted overseas races, that some of the results we used may contain wheelchair racers, or the other non-random sources of error we have pointed out. We also ignored the multiplicity correction described earlier. Despite these caveats, we believe the results can be interpreted as something of a reality check on the results we have given.
The Current Qualifying Time Standards
The BAA did decide to set new qualifying time standards that took effect with the 2013 Boston Marathon. The new qualifying times were 5 minutes below the old ones for all age groups and sexes and eliminated the 59-second cushion (so the new qualifying times are 5 minutes 59 seconds, or 5.9833 minutes, faster than the old ones).
In addition, the organizers introduced a four-tier entry system, whereby runners who beat the (new) qualifying standard by 20 minutes or more got to enter first, then those who beat the qualifying standard by 10 minutes or more, then those who beat the qualifying standard by 5 minutes or more, and finally everyone else who beat the qualifying standard. If the race was oversubscribed, entrants would be accepted according to the degree by which they beat the qualifying standard. For example, in 2012 (the first time the four-tier entry system was used, though still based on the old qualifying times) everyone who beat their qualifying standard by 1 minute 14 seconds or better was accepted for the race. In 2013, the new standards went into effect and everyone who applied for the race with a legitimate qualifying time was accepted.
After the 2013 race ended with two bombs exploding, organizers expected a substantial increase in the number of entrants, partly because of runners who were unable to finish the 2013 race (who were accepted without being required to re-qualify), but also because of a general upsurge in interest as runners demonstrated their support for the race. They therefore increased the total size of the field to 36,000 (from the previous 25,000). Even so, not every qualified runner was accepted—everyone who beat their age- and sex-adjusted qualifying time by 1 minute 38 seconds or more was accepted. (One of the authors of this article beat the relevant qualifying time by 1 minute 54 seconds and was therefore accepted.) [Read more about a the bombings and a tribute to Remembering Lingzi Lu by Scott Evans.]
Given the fluctuation in numbers of entrants that occurs naturally from year to year, even in the absence of special circumstances such as those that followed the 2013 bombings, it is not possible to say definitively how accurate our predictions of future numbers of entrants were. However, we can make some comparisons. The top two (blue and green) plots in Figure 1 show our projected numbers derived from Tables 3 and 4, plotted against the projected change in qualifying time, separately for men and women, but with all ages combined. On a log-linear scaling, the fit is remarkably close to a straight line. To be specific, each 1-minute reduction in qualifying time is expected to result in a 6.4% reduction in entrants for either men or women. For 5.98333 minutes reduction in qualifying time, this calculation projects a 33% reduction in number of qualified entrants. We do not know whether this was the reduction in field size the organizers were aiming for, but it seems to be in the right ballpark.
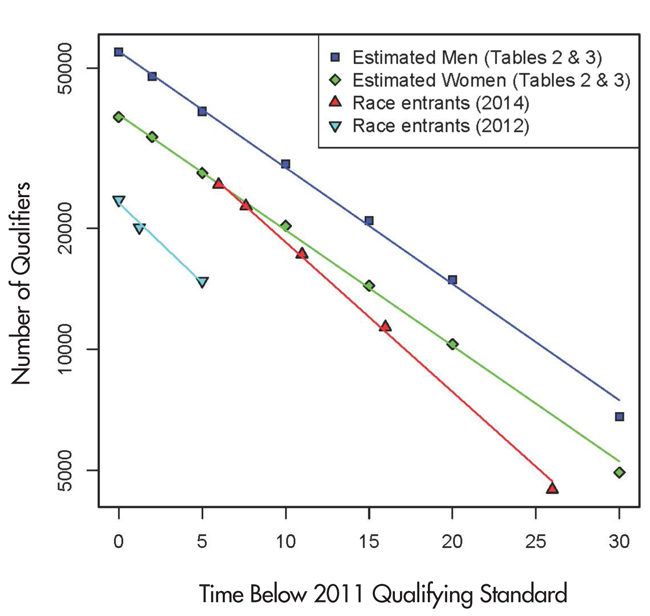
Figure 1. Numbers of estimated and actual qualifiers by time increment
Even though we cannot directly compare entrants in the same year under the old and new qualifying standards, a loose proxy for this is to look at the numbers of entrants who beat each of the intermediate qualifying times under the four-tier entry system. Specifically, the organizers released the following information for the 2012 race:
- 23,521 applications were received during the two weeks of registration
- 20,081 applicants were accepted, having beaten the (same as 2011) qualifying standard by 1 minute 14 seconds or better (subject to verification of qualifying performance)
- Among those, 14,780 beat their qualifying standard by 5 minutes or better
- An additional 277 qualifiers who had run 10 or more consecutive Boston Marathons also were accepted
For the 2014 race, by which time the new standards were in effect:
- 25,654 applications were received during the two weeks of registration.
- 22,679 applicants were accepted, having beaten the qualifying standard by 1 minute 38 seconds or better (subject to verification of qualifying performance).
- 5,450 applicants beat their qualifying time by between 1 minute 38 seconds and 5 minutes.
- 5,879 applicants beat their qualifying time by between 5 and 10 minutes.
- 6,866 applicants beat their qualifying time by between 10 and 20 minutes.
- 4,484 applicants beat their qualifying time by 20 minutes or better.
An additional 5,625 runners who were 2013 Boston Marathon starters who reached the half marathon checkpoint or later but did not have the opportunity to cross the finish line on Boylston Street on April 15 were invited to participate in the 2014 race, some of whom were qualified. Of those runners, 4,615 registered for 2014, 1,649 of whom were qualifiers.
In addition, 402 qualifiers who had an active streak of 10 or more consecutive Boston Marathon completions also entered during a pre-registration period and were accepted.
For the purpose of the following discussion, we ignore those who were accepted by virtue of having not finished the 2013 race or because they had 10 or more Boston Marathons.
The above numbers have been translated into numbers of race entrants who beat the 2011 qualifying standard by various margins and are plotted on Figure 1 (2014 entrants in red, 2012 entrants in cyan).
For these numbers as well, the log-linear fit is good, but the slope is slightly different from the estimates computed from Tables 3 and 4. Specifically, according to the straight lines fitted to the actual data from 2012 (2014 in parentheses), a 1-minute reduction in qualifying time corresponds to an 8.2% (8.7%) reduction in number of entrants, and a 5.9833-minute reduction in qualifying time corresponds to a 40% (42%) reduction in number of entrants.
The one factor that our analysis cannot take into account is what proportion of marathon runners who are qualified for the Boston Marathon actually decide to enter. It is entirely plausible that runners who have beaten the qualifying time by a large margin are less concerned about taking their “one and only chance” to run the Boston Marathon. In other words, the proportion of qualified runners who enter the race is smaller among faster runners. This is in the right direction to explain the differences among the slopes of the various straight lines in Figure 1.
Estimated Changes in the Age-Sex Distribution of Runners in the Boston Marathon
Here we extend the preceding discussion to consider also the age and sex categories. The changes in total qualifiers envisioned from our results imply not only an approximately 33% reduction in Boston Marathon qualifiers based on the actually adopted 5 minutes 59 seconds tightening of the qualifying times, but also a slight redistribution of qualifiers among the different age and sex categories. We demonstrate here that it is also possible to see the signal of that change in the observed race results.
To illustrate, consider Table 7. Based on Table 4, the expected proportion of women under the old (2011) qualifying time is 37809/92695=0.408, or 40.8%, while based on the new qualifying times, it is 27426/66474, or 41.3%. We can compare this with the actual number of finishers. The data for this comparison come from finishers in the 2010 and 2011 Boston Marathons to represent the old qualifying times and the 2013 Boston Marathon to represent the new qualifying times. The three race results are compiled in the file TIM.txt at the UNC website and include runners in the 2013 Boston Marathon who were unable to finish because of the bombs (the vast majority of whom would have finished had they been able to reach the finish line).
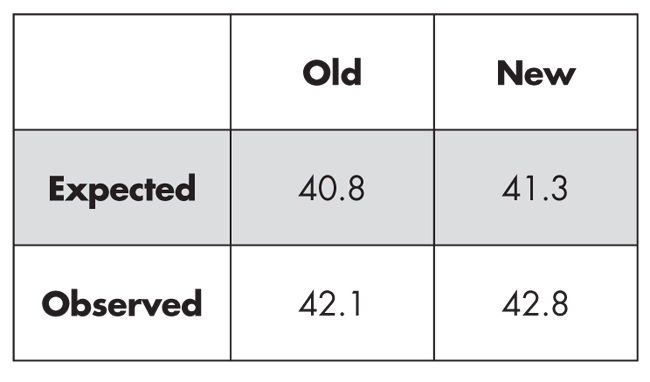
Table 7—Expected and Observed Percentages of Women Under Old and New Qualifying Times
For both old and new qualifying times, the observed percentage of women is higher than the expected percentage under our tables. We have speculated a little about the reason for this, but one possible explanation is that, even 50 years after Roberta Gibb became the first woman to unofficially complete the Boston Marathon, women are still relative newcomers to the sport (especially in the older age groups) and consequently more likely to take up their place in the race if they qualify. As a result, it may not be reasonable to directly compare the observed and expected percentages in the different age and sex categories.
However, it does make sense to look at the changes in percentages between the old and new qualifying standards, which presumably would be much less affected by differential selection effects. From this point of view, Table 7 shows good agreement: Our calculations predicted a 0.5% increase in the total percentage of women, and we actually observed 0.7%.
We can make similar comparisons of the age distribution—see Table 8. For example, the expected proportions of qualifiers aged under 45 based on the old and new qualifying times went from 56.2% to 54.9%. (The calculation under the new qualifying times differs slightly from Table 3 because it is based on the 5 minute 59 second increment and not exactly 5 minutes as in the QT1-5 column of Table 3.) The observed change was from 59.4% to 57.7%. In this case, it looks as though younger runners are more likely to take up their place in the race (which possibly, again, reflects a bias toward runners new to the marathon) but the change in percentage (1.3% expected, 1.7% observed) is still quite close.
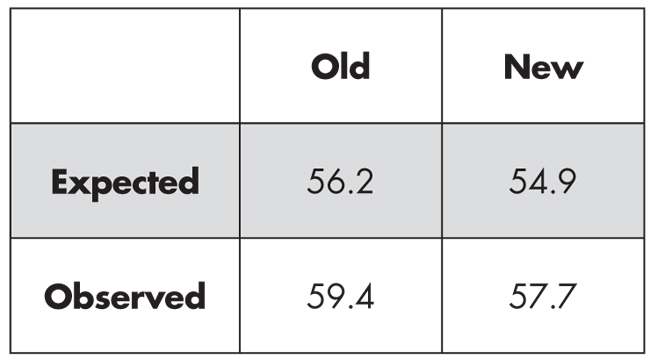
Table 8—Expected and Observed Percentages of Runners of Age<45 Under Old and New Qualifying Times[/caption]
We can extend this comparison to all age-sex categories—see Table 9. Here, we have computed the change in the percentage of runners in each of the 22 age-sex categories, both expected based on our calculations and as observed in the 2010, 2011, and 2013 race results. In this case, it is rather hard to decide whether the observed and expected percentages match—there are some cells where they differ substantially. However, one way to assess the overall agreement between the observed and expected percentage changes in Table 9 is to compute their correlation. Specifically, we computed the standard Pearson correlation coefficient between the 22 “expected” percentage changes in Table 9 and the 22 “observed” percentage changes. The result is a correlation of 0.527, which seems to imply substantial agreement among the expected and observed values.
[caption id="attachment_8883" align="aligncenter" width="400"]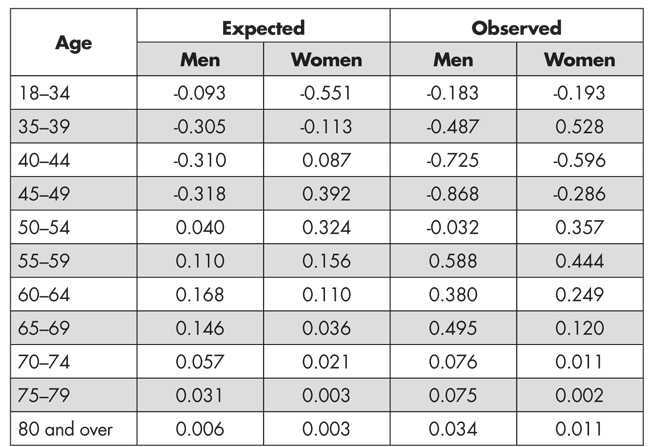 Table 9—Changes in Expected and Observed Percentages from Old to New Qualifying Times for Each Age-Sex Category
Is this, in fact, a statistically significant correlation? Standard statistical tests based on correlation coefficients, such as Fisher’s z-transformation, do not apply in this rather complicated sampling framework, so we have used a simple bootstrap method to evaluate the uncertainty in the estimated 0.527 correlation coefficient. Specifically, for each of 5,000 bootstrap samples, we resampled with replacement from the entire 69,923-runner database in the TIM.txt file. For each bootstrapped sample, we recomputed Table 9 and hence the corresponding bootstrapped correlation coefficient. A histogram of bootstrapped correlation coefficients is shown in Figure 2. As shown in red, 95% of the bootstrapped correlation coefficients lie between 0.28 and 0.68, which is therefore an approximate 95% confidence interval for this coefficient. Note that the confidence interval does not include 0. Therefore, we conclude that the observed correlation between the expected and observed percentage changes is statistically significant.
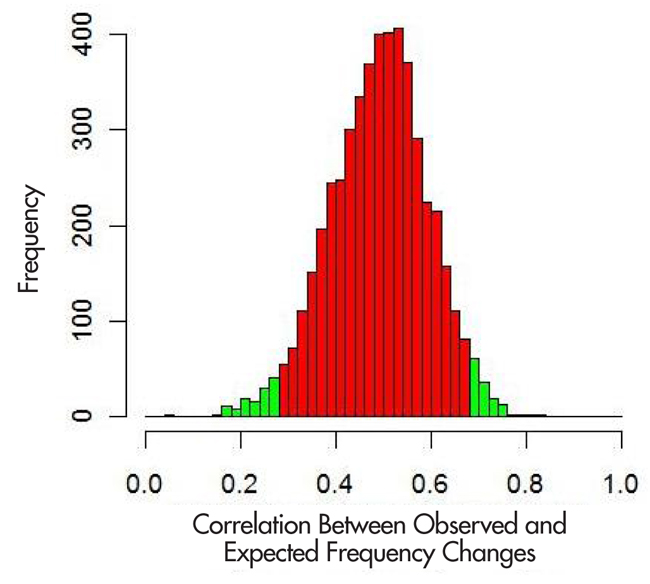
Figure 2. Histogram of bootstrapped correlation coefficients: central 95% in red
This is admittedly a mild test, since it only establishes that the changes in the age-sex distribution are different from random, but given the small percentage changes predicted by our model and the considerable variation in the composition of the field from year to year (in other words, a lot of random variation), we consider it an achievement that we can still detect the effect of the changes in the qualifying standards on the percentages of women and younger runners in the 2013 race.
Conclusions
As the community of marathon runners continues to grow, the demand for an entry into the historical Boston Marathon will increase with it. This makes the issue of establishing appropriate Boston Marathon qualifying times even more crucial due to its impact on a large number of runners. In this work, we presented a procedure for modifying the previously established qualifying times by analyzing the effect of a variety of reductions by age and sex. A specified population of marathons that were feeders for the 2010 Boston Marathon was used for this analysis.
The BAA made the decision to change the qualifying times for the 2013 Boston Marathon. They reduced the qualifying times by 5 minutes 59 seconds across the board and introduced a new tier structure for entries. According to our estimates, the changes should have resulted in an approximate 33% reduction in the number of entrants, compared with what would have happened if the qualifying times had not changed. Two comparisons based on subsequent events—one tracking the numbers of entrants in different qualifying groups for the 2012 and 2014 races, the other based on differences in the distribution of finishers across age groups—both showed that our estimates worked well in practice. The 2014 race, with 32,458 starters and 31,926 finishers, was the second-largest Boston Marathon in the history of the race, behind the 1996 centenary race.
In the future, it is likely that increasing pressure on the field size in the Boston Marathon will require further adjustments to the qualifying standards. Other races such as the New York and London marathons also use qualifying times as a means of ensuring guaranteed entry for fast runners. The methodology employed here provides a systematic means of fine-tuning the qualifying times to achieve certain goals both for the overall field size and the distribution across sex and age groups.
Editor’s Note: This article is based on the talk, “Completing the Results of the 2013 Boston Marathon,” presented by Richard Smith at the 2013 New England Symposium on Statistics in Sports, held September 21, 2013, at the Harvard University Science Center. The talk is available to view on YouTube.
About the Authors
Richard L. Smith is professor of statistics at The University of North Carolina at Chapel Hill and director of the Statistical and Applied Mathematical Sciences Institute. His main research interests are in environmental statistics, including climate change and air pollution. He ran his first marathon in 1978 and has completed the Boston Marathon 11 times.
Scott Powers is a PhD student in the department of statistics at Stanford University. He earned his BS in mathematics and mathematical decision sciences in 2011 from The University of North Carolina at Chapel Hill. He also has worked on statistical analyses in baseball and volleyball.
Jessi Cisewski is a visiting assistant professor in the department of statistics at Carnegie Mellon University. She earned her PhD in 2012 from the department of statistics and operations research at The University of North Carolina at Chapel Hill. She enjoys running and completed the Twin Cities Marathon in 2010.


