
Letters to the Editor
Beware the Ides of March?

This article is in response to “Can Tax Deadlines Cause Fatal Mistakes?” by D.A. Redelmeier and C.J. Yarnell in CHANCE 26(2). The authors examined the hypothesis that increased stress stemming from the deadline for filing tax returns, usually April 15, affects the number of people involved in fatal crashes (drivers, passengers, pedestrians, bicyclists, motorcyclists, killed, injured, uninjured, unknown). They compared Tax Day with days one week before and one week after, which controls for day of week and seasonality. They found a 6% increase in the number of people involved in fatal crashes on Tax Day, relative to the comparison days. The difference was statistically significant, based on the assumptions of the test they used.
Given that many people file tax returns before the deadline and, more recently, electronically, the hypothesis that increased stress would have any effect on fatal crashes (especially as measured by counting everyone involved in them) seems a bit unlikely. Be that as it may, a more measurable criticism involves answering the question: How does the observed Tax Day effect compare with that of other days throughout the year? In particular, what if the same method were used to study the 15th day of other months? As with any effect estimate in a statistical analysis, it is important to know if the observed result is unusual compared with what would be expected with no true effect.
The 15th day of March, otherwise known as the Ides of March, is widely held as the day Julius Caesar was assassinated by some Roman senators (and Brutus, too) in 44 BC, yet surely thoughts of this historical regime change would not be expected to affect present day fatal crashes on its anniversary. August 15 marks the Catholic Church’s Feast of the Assumption of Mary, also recognized in the Orthodox Church as the Feast of the Dormition of the Theotokos, but this tends not to be widely celebrated in the United States. January 15 is the birthday of the late Dr. Martin Luther King Jr., but the holiday in his honor is celebrated on the third Monday of January, rather than on the actual 15th. In other words, there’s no reason to expect an effect of the 15th day of other months, beyond random variation, on fatal crashes.
So looking at the 15th days of other months provides a reasonable way of studying the variance of this measure of the effect of Tax Day. The solid line in Figure 1 provides these results. For each month, the 15th was compared with the average of the 8th and the 22nd, analogously to and using the same years of data as Redelmeier and Yarnell. Interestingly, the April figure went from a 6% increase, when factoring in the eight times Tax Day did not occur on April 15 during these 30 years, to a 2% increase when studying just April 15. The Ides of March effect was similar to the April 15 effect, as was the birthday of Dr. Martin Luther King Jr. The largest effects included a 6% increase for Sept 15 and a 9% decrease for December 15. As a further illustration of the variance of this measure, the analysis was repeated for the 14th (vs. 7th and 21st) and 16th (vs. 9th and 23rd) days of each month. A similar amount of variability was observed. Interestingly, February 14, or Valentine’s Day, had a near-zero effect.
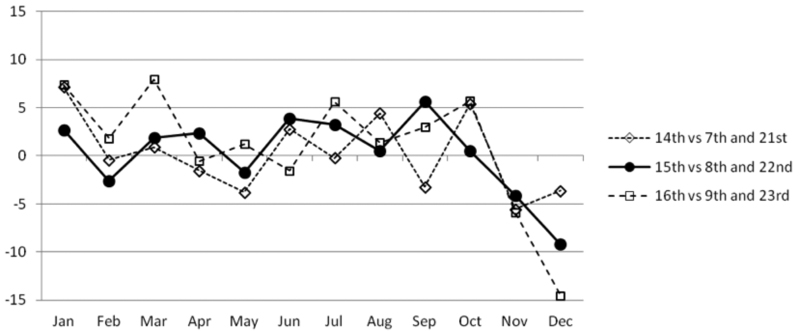
Figure 1: Percent change in the total number of people involved in fatal crashes, relative to the average of comparison days, 1980–2009. Data extracted from the Fatality Analysis Reporting System, a census of fatal crashes on U.S. public roads maintained by the U.S. Department of Transportation, National Highway Traffic Safety Administration.
Taken as a whole, five of the 36 points, or 14%, in Figure 1 are at least as great in magnitude as the 6% increase observed by Redelmeier and Yarnell for Tax Day. This indicates that the observed Tax Day effect isn’t that unusual when considering the typical variation in crash risk for days around the middle of the month.
Response to Eric R. Teoh: The Lethal Risks of Tax Deadlines
We thank Eric Teoh for his creativity, rigor, and effort in analyzing factors important to highway safety. We agree that traffic risks fluctuate substantially, as measured by the numbers of people in fatal motor vehicle crashes each day over the last three decades in the United States. One reason relates to weekends and holidays, which have about a 30% increase in risk compared to other days. Such fluctuation was our rationale for identifying an exact day for each year, because tax deadlines are never scheduled on a weekend or holiday (and thereby avoid such fluctuation). We wish we had made this point more clearly.
The letter contains new results that strengthen our finding; namely that traffic risks are distinct to tax deadlines and disappear if April 15 is not a tax deadline. We have now rechecked our data, confirmed this pattern, and continue to find a 6% increase in traffic risks on tax days (95% confidence interval 3 to 10, p < 0.001). This finding is mostly explained by years when the deadline was April 15 (and partially by years when the deadline was April 16 or 17). Secondary analyses show that when the deadline is not April 15, then the April 15 day shows no significant increase in traffic risks (95% confidence interval -7 to 3, p = 0.401).
The letter also introduces more dates throughout the year, such as the Ides of March (March 15) and Valentine’s Day (February 14). We have rechecked these dates and observed no significant increase in traffic risks on the Ides of March (95% confidence interval -1 to 5, p = 0.192) or Valentine’s Day (95% confidence interval -3 to 2, p = 0.767). Analysis of all the data set showed significant increases (p < 0.05) for 11 of the 36 dates, of which only three of the 36 dates exceeded a 6% increase (perhaps inflated due to multiple comparisons). Together, these patterns suggest tax deadlines are one factor, but not the only factor, in traffic risks.
The figure depicting the 36 dates provides a visual display of relative increases in traffic risks (compared to control dates). This display is somewhat ambiguous because it does not provide sample counts or standard errors. We are grateful for subsequent exchanges that provided these data and allowed us to recalculate the necessary 95% confidence intervals for confirmations. The remarkable high outlier point in the figure was on March 16, which is not the Ides of March. Perhaps this date marks the start of the March Madness festivities in the United States and might merit future research for lowering traffic risks.
In general, the monthly fluctuations in the figure may indicate that the selected dates were relatively risky or that the control dates were relatively safe. Checking the actual data suggests that neither January 14, 15, or 16 was above the full mean (of the 36 dates); instead, the apparent increase relates to the low counts on the control dates in January. Similarly, neither December 14, 15, or 16 was significantly below the full mean; instead, the apparent decrease relates to the high counts on the control dates in December. The riskiest days were in August—yet easily neglected since their control days had high counts, too.
We appreciate the attention to road safety, understand the contentious nature of taxation, and realize the Internal Revenue Service (IRS) inspires endless debate. As CHANCE goes to press, the IRS is the subject of a criminal probe led by the United States Attorney General. The current allegation is that the IRS unfairly targeted some partisan groups. This allegation has led to public protests and forced the resignation of the head of the agency (Steven T. Miller). We are thankful that statistical analyses tend to examine thoughtful scientific hypotheses, rather than such unforeseen volatile political conflicts.
Further Reading
Redelmeier, D.A., and B.A. McLellan. 2013. Modern medicine is neglecting road traffic crashes. PLOS Medicine 10(6):e1001463.
U.S. Department of Transportation. 2013. Traffic safety facts 2011. DOT 811754. Washington DC: National Highway Traffic Safety Administration.
March, B. 2006. The innocent birth of the spring bacchanal. The New York Times March 19.
Nowinski, J. 2012. Spring break: From March Madness to beer pong. The Huffington Post, April 5.
Wikipedia Foundation. 2013 IRS scandal. Wikipedia: The Free Encyclopedia.
Response to Christian Robert
I would like to thank Dr. Robert for reviewing my book, [Parodoxes in Scientific Inference on Page 52 of Volume 26.2]. Unfortunately, his review is quite misleading.
For instance, he is mistaken in saying I considered Brownian motion a paradox because it reconciled a paradox. In fact, I didn’t say or imply that at all. Just below the paragraph he quoted, I gave reasons why Brownian motion is considered a paradox: three paradoxical properties of Brownian motion (pages 50-51).
Another example, Robert said I ignored the dependence of the p-value on a realized random variable. But, in fact, just before the sentence he quoted, I clearly stated (p.105), “… p-value, which is defined as the (least upper bound of the) probability of getting data the same as or more extreme than the observed data when the null hypothesis Ho is true.” I also provided other interpretations of p-value.
He quoted the second half of my sentence about MLE on Page 119, making it look like a whole sentence by capitalizing “the.” From this, he concluded that the author doesn’t understand the difference between likelihood principle (LP), likelihood ratio test (LRT), and MLE, while he really missed my point about their common notion: Likelihood is a measure of the relative plausibility of different parameter values. If this notion is questionable, then the rationality of LP, LRT, and MLE are questionable.
What can be considered paradoxes involves personal opinions. In the preface, I clearly defined what are considered paradoxes in the book. Some may appear not paradoxical today, but historically were, and made a great impact. From his comments, the reviewer seems not to have read the preface and didn’t know the intended broad readership. He didn’t even mention the last chapter (5) of the book for some reason. In contrast, Professor Sandra Keith provided a transparent review for The Mathematical Society of America.
The reviewer noted an obvious error/ typo on the posterior distribution (thanks!), but, at the same time, he missed completely the point here. When observations (vectors) x1, x2, …, xn are viewed from different experiments, they are considered independent and every posterior serves as the prior for the next experiment. Therefore, after n experiments, the posterior distribution is proportional to ∏f(xi |t) [≠ ∑ f(xi |t)]. On the other hand, if the n observations are viewed from the same experiment, their dependencies can be seen, thus the posterior is proportional to f(x1, x2 , … , xn |t). An example would be studies conducted by different investigators at different times for related events/diseases, but on the same patients.
It is not surprising for a book of paradoxes involving scientific foundations to receive controversial reviews from readers, but I do expect a reviewer to quote accurately and not to truncate the text and make critiques out of context. I’d like to warn readers that many paradoxes in the book are philosophical and beyond statistics (even if they may be called statistical paradoxes), and thus cannot be fully understood from a statistical perspective only. One should not assume to know fully a paradox just because one has seen it before. As to the paradoxes concerning the foundations of statistical paradigms, if one tries to understand from a specific paradigm, he may feel a text is “missing in its statistical foundations.”
The reviewer regrets that some paradoxes of interest to him have been omitted. Thanks for the feedback. As this book is about paradoxes in general scientific inference, if one is only interested in statistical paradoxes, the books by Székely (1986) and Stoyanov (1997) might be a better choice, where one can find five times more statistical paradoxes. I much appreciate the reviewer’s discussions in his blog; despite some misunderstandings and disagreements at the moment, it will clarify matters eventually.
Further Reading
Székely, G.J. 1986. Paradoxes in probability theory and mathematical statistics (mathematics and its applications). New York: Springer.
Stoyanov, J. 1997. Counterexamples in probability (2nd Ed.). New York: John Wiley.
A Response to Chang’s Letter on My Review
While I understand the author’s ire at my negative review, and while I acknowledge picking the quotes from the book in the most revealing manner, I do remain convinced that the book is lacking in its statistical foundations. Let me repeat two major illustrations here.
First, the fact that the MLE is biased is deemed either a paradox or a cause for rejecting MLE as an estimation principle: “The peaks of the likelihood function indicate (on average) something other than the distribution associated with the drawn sample. As such, how can we say the likelihood is evidence supporting the distribution?” (p.119) This is missing both the fact that MLE is usually asymptotically efficient and the sad truth that there exists no unbiased estimator for most estimation problems.
Second, the point about the paradoxical updating(s) of the posterior distribution remains misunderstood by the author in this letter: Whether I observe (x1 , . . . , xn ) and build the posterior π(θ|x1, . . . , xn ) or start from x1, build the posterior π(θ|x1 ) and use it as a prior, observe x2 and build the posterior π(θ|x1, x2), etc., I do end up with the same distribution, unless I make simplifying and false assumptions on the conditional distributions of x2 given x1, x3 given (x1, x2 ), etc. Far from being a paradox, this property is a characteristic of the coherence of the Bayesian learning approach.
I thus object to the relativity statements made in this letter that “[what] can be considered paradoxes involves personal opinions” and that “many paradoxes in the book are philosophical and beyond statistics (…) and thus cannot be fully understood from a statistical perspective only.” It is not a matter of perspective, nor of philosophy, that the MLE leads to biased estimators, but rather the use of a statistical principle unlikely to agree with unbiasedness. As a result, while the book makes for interesting reading for more senior readers, I would not advise it for student audiences.


